Journal of Diabetes Mellitus
Vol.3 No.1(2013), Article ID:28110,6 pages DOI:10.4236/jdm.2013.31005
Expression profiling of putative type 2 diabetes susceptibility genes in human islets and in rat beta cell lines*
![]()
Institute of Biomedical and Clinical Sciences, University of Exeter Medical School, Exeter, UK; #Corresponding Author: L.W.Harries@exeter.ac.uk
Received 27 November 2012; revised 29 December 2012; accepted 7 January 2013
Keywords: Human; Type 2 Diabetes; Islet; GWAS; Gene Expression
ABSTRACT
Over 50 single nucleotide polymorphisms (SNPs) have been identified by genome wide association studies (GWAS) to be associated with susceptibility to type 2 diabetes (T2D); however the causal gene in most cases is not known. In this study we sought to identify which may be the most likely causal genes at five T2D GWAS loci by measuring their expression in control and T2D islets, as well as observing their regulation by glucose. We measured the expression of ten genes at five loci (CDKN2A/2B, CDC123/CAMK- 1D, HHEX/IDE, TSPAN8/LGR5, and DGKB/TMEM 195), in control and human pancreatic islets by real-time PCR. We then measured the expression of these genes in the rodent pancreatic beta cell line INS-1 exposed to 5.6 mmol/l, 11 mmol/l and 28 mmol/l glucose for 48 hours. We found differential expression of the longest isoform of CDKN2B specifically between control and T2D human islets, whereas the shortest isoform of this gene had no expression in islets. Tmem195 was the only gene to show differential expression in response to increasing glycemia in INS-1 cells under the conditions described. Our study is an example of how the differential expression of genes in loci spanning more than one gene can aid identification of the more likely causal gene.
1. INTRODUCTION
Genome wide association studies (GWAS) have identified more than 50 single nucleotide polymorphisms (SNPs) associated with susceptibility to type 2 diabetes (T2D) in human populations of different ethnicities [1-3]. Variants associated with T2D risk predictors, such as fasting glucose and fasting insulin have also been identified [4]. Very few GWAS SNPs lie in the regions of the genome that encode proteins; to date, the only coding variants associated with T2D lie in the SLC30A8 and GCKR genes [5]. Accordingly, the vast majority of the diabetes-associated variation is located in non-coding regions of the genome; at least 80% of which was recently described to contain functional regulatory elements by the ENCODE project [6-11]. Genetic variation thus has the potential to alter the regulation and function of genes by several mechanisms, including modulation of constitutive or alternative splicing or modification of mRNA stability, since such post-transcriptional mechanisms of gene regulation rely on sequence context for binding of regulatory proteins or RNAs [12-14]. This suggests that most genetic variants may exert their effects by influencing the expression and regulation or processing of particular genes.
Identification of precisely which gene may be affected by the variant is not straightforward; most candidates are predicted by the distance from the index SNP, their location in open chromatin and by biological plausibility. The recent characterization of the genome by ENCODE [6-11] highlights many previously uncharacterized regulatory elements which may also inform on the identity of the gene affected, but in many cases, the index locus still will encompass several possible candidates. An important first step in identifying which genes play a role in the etiology of diabetes is to determine which of those genes are expressed in human islet samples: genes not expressed either in control or type 2 diabetic beta cells may be less likely to be causative genes. Whether or not candidate genes are expressed in relevant tissues is complicated by the fact that their expression may also be affected by the diabetic microenvironment [15], so the initial study of non-diabetic samples is essential. Since the T2D microenvironment (i.e. hyperglycemia, dyslipidemia) has been shown to alter regulation of gene expression [16,17], it is possible that candidate genes may also be involved in disease progression by altering beta cell function.
In this study, we aimed to use gene expression profiling in human islet samples to provide evidence to aid definition of the causal genes at 5 loci which were amongst the first to be associated with T2D susceptibility by GWAS and had more than one candidate gene at each locus [1,2]. In each case the most significantly associated SNP was positioned at a locus spanning two genes where both are equally plausible candidates in terms of proximity to the index SNP [1,2]. The 5 loci were located at chromosome 10p13 (CAMK1D/CDC123), 9p21.3 (CDK N2A/CDKN2B), 7p21.2 (DGKB/TMEM195), 10q23.33 (HHEX/IDE) 12q21.1 (TSPAN8/LGR5). Moreover, all but the TSPAN8/LGR5 locus have been associated with glucose and insulin traits [18-20], indicating that they may have their effect through altered beta cell function. We analyzed the expression of target genes in normal human islet samples (n = 5) and to establish whether the expression of candidate genes could be responsive to the diabetic microenvironment, we analyzed the expression of the same set of genes in islet samples from donors with T2D (n = 3). We also analyzed the expression of the 10 genes in the rodent pancreatic beta cell line INS-1 treated with exogenous glucose.
2. METHODS
2.1. Details of Islet Cohort
Islet samples from control and T2D donors were procured from ProCell Biotech (Newport Beach, USA). Islet purity and viability measurements were conducted by the donor company and were determined by dithizone and fluorescein diacetate/propidium iodide staining, respectively. The control and T2D islet donor cohort information is shown in Table 1. We compared the expression of genes associated with T2D by GWAS in islets from five control donors and three donors who had T2D. Small sample sizes were used because of the scarcity of human islet samples available. Donors were of mixed gender and ethnicity. Cause of death was mostly from head trauma, except for donor OD35543, where the cause of death was from an intracranial solid neoplasm. The mean ages and BMIs of the control and T2D donors were as follows: Control: 42 (age), 33.2 (BMI); T2D: 55 (age), 37.6 (BMI). The differences between age and BMI in the control and T2D groups were not statistically significant when compared using a two-tailed Student’s T-test.
2.2. Rna Extraction, Reverse Transcription and Gene Expression Analysis
RNA was extracted from the cells and human isletpreparations using the MirVana RNA Isolation pro-
Table 1. Cohort information for the human cadaveric islet donors. RNA from five control islet samples were available, and three from individuals with T2D. Difference in age or BMI did not reach statistical significance between the two groups. M = male; F = female; C = Caucasian; AA = African-American; A = Asian; CVA = cerebrovascular accident; CNS = central nervous system.

cedure, according to the manufacturer’s instructions (Life Technologies, Foster City, USA). RNA from the INS-1 cells (3 biological replicates), and from diabetic and non-diabetic human islets was reverse transcribed using Superscript III enzyme (Life Technologies, Foster City, USA), after DNA was removed from the RNA samples using TURBO DNA-free (Life Technologies, Foster City, California). Loci were chosen on the basis that they have been associated with T2D susceptibility or fasting glucose by GWAS and include 2 equally likely candidate genes based on proximity to the index SNP [1,2]. Expression of the 10 candidate genes was analyzed on custom designed cards using TaqMan Low Density Array (TLDA) on the ABI Prism 7900HT platform (Life Technologies, Foster City, USA). Expression of each target was measured by relative quantification, and normalized back to the global ΔCt in order to allow comparison of expression levels across genes and between tissues.
2.3. Cell Culture
The rodent pancreatic beta cell line INS-1 was cultured in RPMI 1640 medium (Life Technologies, Foster City, USA) at an ambient glucose concentration of 11 mmol/l, with 10% fetal calf serum and 1% penicillin/ streptomycin. Cells were incubated under these conditions in a humidified atmosphere at 37˚C for 72 hours. After 72 hours, the INS-1 cells were then seeded at a density of 1.4 ´ 104 cells/cm2 in 25 cm2 flasks. Cells were cultured at one of three glucose concentrations for 48 hours: 5.6 mmol/l (low glucose), 11 mmol/l (ambient glucose), and 28 mmol/l (high glucose) (Figure 1) (conditions used by Cnop and colleagues to simulate hypo/ hyperglycemia in type 2 diabetes) [21].
2.4. Statistical Analyses
Significant changes in gene expression between control and T2D human islets were identified using the Mann-Whitney U test and the most stable endogenous controls (B2M, GUSB) were found using the GeNorm algorithm [22] in the StatMiner TLDA gene expression analysis software (Integromics, Granada, Spain). Pairwise comparisons between low (5.6 mmol/l) and ambient (11 mmol/l), low (5.6 mmol/l) and high (28 mmol/l), and ambient (11 mmol/l) and high (28 mmol/l) glucose conditions were carried out using one-way ANOVA to determine significant changes in gene expression across these groups. The most stable endogenous controls (B2m, Hprt1, Tbp) were identified as before.
3. RESULTS AND DISCUSSION
Dozens of loci have been associated with T2D susceptibility by GWAS, although the causal gene or genes in most cases remain elusive. We have analyzed the expression of ten genes at five loci in control and T2D human

Figure 1. Gene expression in INS-1 cells cultured in low (5.6 mmol/l), ambient (11 mmol/l), and high (28 mmol/l) glucose concentrations for 48 hours. The only gene significantly altered in expression by glucose under the conditions described was Tmem195. The expression of this gene was significantly altered between low and high glucose concentrations. Gene expression differences were statistically analyzed by one-way ANOVA and were normalized to the mean expression of the most stable endogenous controls (B2m, Hprt1, Tbp). Expression is shown relative to median expression across all genes. **indicates P < 0.005.
islets in the hopes of identifying which gene at each of these loci is more likely to be the causal gene. All but one (TSPAN8/LGR5) of these loci have been associated with glucose and insulin traits [18-20], indicating that they may have their effect through altered beta cell function.
Results of our screen are given in Table 2. We found some expression of TSPAN8 in human islets, whereas LGR5 was not expressed in either control or T2D human islets, which makes TSPAN8 a more likely candidate at the TSPAN8/LGR5 locus. The current literature corroborates this proposal, although this is the only locus of the five studied that shows no evidence of association with measures of beta cell function [18,23]. TSPAN8 is a cell surface glycoprotein with a role in cell migration, differentiation and adhesion [24]. A study by Marselli and colleagues found an upregulation of this gene in human T2D beta cells compared to beta cells from healthy individuals separated by laser capture micro-dissection [13]. Our results show the same pattern of expression as found in this study, although the difference in expression in our study between control and T2D human islets did not reach statistical significance. Animal knockout models of Tspan8 show changes in pancreatic development, whereas Tspan8 over-expression results in pancreatic structural differences in Xenopus [25]. Although no differences in glucose metabolic traits were seen in Tspan8 mouse knockout models, the authors suggest that this could be due to a species-specific difference, as no expression of Tspan8 was found in mouse pancreatic cells, as opposed to documented expression in human pancreas [26]. We also found no expression of Tspan8 in the rodent pancreatic beta cell line INS-1 in this study. The orphan receptor LGR5 on the other hand shows little evidence of expression in the beta cell, although it has a role in WNT signaling in stem cells of the intestinal crypt and hair follicles (as well as expression in skeletal muscle, placenta, spinal cord and brain) [27,28]. Neither of these genes were differentially regulated in response to increasing glycemia in INS-1 cells. Together, these findings point to TSPAN8 as the more likely causal gene at the TSPAN8/LGR5 locus.
The CDKN2B gene is in a locus spanning two potential candidate genes (CDKN2A/2B). This particular susceptibility locus is also associated with impaired GSIS, with individuals with the risk allele for rs10811661 showing decreased insulin release after an oral or IV glucose challenge [20], perhaps indicating a role in the transition from impaired glucose tolerance to overt diabetes. Both potential genes linked to rs10811661 are good candidates, both being involved in cell cycle control through the CDK4 pathway and potently inhibiting pancreatic beta cell proliferation [5,29]. Cdk4 knockout mice have been shown to have decreased beta cell
Table 2. Table showing the median gene expression differences for the ten candidate genes at five loci. The table shows the chromosome location of each loci with association by GWAS. Further information about the T2D loci such as strongest SNPs can be found in [1,2]. Taqman Assay IDs (Life Technologies, Foster City, USA) used to analyze the expression of these genes by real-time PCR are shown. Median expression in control and T2D islets is shown as well as the range of expression. The P-values are shown and significant (P < 0.05) changes in expression between control and T2D islets are highlighted in bold type. *specific to CDKN2B transcript NM_078487.2; **specific to CDKN2B transcript NM_004936.3.

proliferation and develop diabetes and Cdkn2a transgenic mice models show differences in islet cell proliferation [5]. We found that the short isoform of CDKN2B (NM_078487.2; isoform 2) had no expression in control or T2D islets, whereas the long isoform of CDKN2B (NM_004936.3; isoform 1) had higher expression in T2D islets, compared to having little or no expression in control islets (Figure 2). This suggests that isoform 1 of CDKN2B may be either part of the causal pathway to diabetes, or affected by the diabetic microenvironment, whereas CDKN2B isoform 2 may not have an important role in the beta cell. Although CDKN2A was expressed in control and T2D islets, no significant changes in expression for this gene were observed. We found no expression of Cdkn2b in INS-1 cells, although this may be due to a species-specific difference in isoform expression (there is only one full-length isoform for Cdkn2b described in rats, compared to two CDKN2B full-length isoforms described in humans [30]).
We observed an up-regulation of Tmem195 in response to increasing glycemia in INS-1 cells, although we found little evidence for expression of this gene or the other candidate gene at this locus, DGKB, in human islets (Table 2). TMEM195 (alkylglycerol monooxygenase; AGMO) is a class of tetrahydrobiopterin-dependent enzyme, which cleaves ether lipids, which have various structural roles and are involved in signaling processes, whereas the other candidate gene at that locus, DGKB, encodes a regulator of the second messenger diacylglycerol [31]. The DGKB/TMEM195 locus is associated with
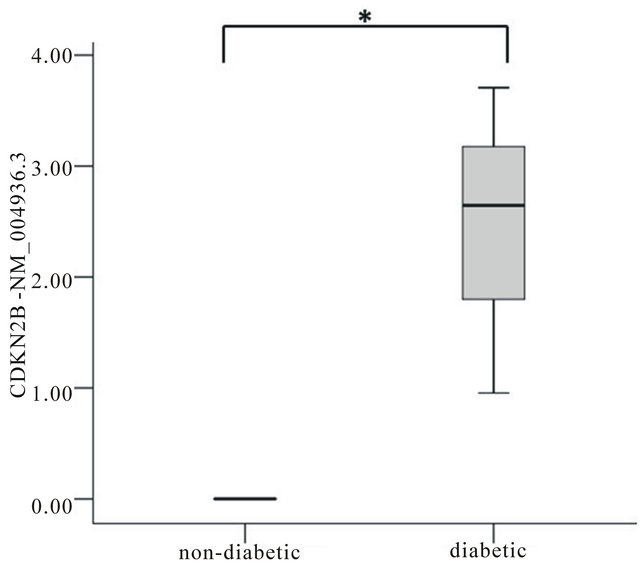
Figure 2. Significant differences in expression of genes associated with T2D susceptibility by GWAS in islets from controls and individuals with T2D. The relative expression of the longest transcript of CDKN2B between control and T2D islets is shown, where NM_004936.3 has no expression in control human islets and is upregulated in T2D islets. Gene expression differences were analyzed using the Mann-Whitney U test and were normalized to the mean expression of the most stable endogenous controls (B2M, GUSB). The expression is shown relative to median expression across all genes. Significant results (P < 0.05) are indicated by*.
estimates of beta cell function and decreased GSIS [19], however, there is little evidence in terms of gene function that points to either gene as the most likely causal gene.
At the remaining two loci (CAMK1D/CDC123 and HHEX/IDE), all 4 genes showed evidence of expression in human islets, but we found no evidence of significant gene expression differences between control and T2D islets. Cdc123, Hhex and Ide (Camk1d is not present in rat) did not show differential regulation in INS-1 cells in response to increasing glycemia, providing no evidence for a role of these genes in T2D progression. These results could indicate that altered gene expression may not mediate the effects of these genes at these loci, although isoform-specific expression differences for CAMK1D and IDE, which encode more than one transcript variant, cannot be ruled out. Both loci have been associated with aspects of beta cell function, indicating that they have their effect through altered beta cell function [18,20,32].
In conclusion, we have demonstrated that expression profiling of human islets could be a useful tool in indicating causality at T2D susceptibility loci. Our data suggest that CDKN2B, rather than CDKN2A, and TSPAN8 rather than LGR5, may be better candidates at their respective loci, based on their expression profiles in nondiabetic and diabetic human islets, and in beta cells treated with glucose in vitro.
4. ACKNOWLEDGEMENTS
This study was funded by the Wellcome Trust Project Grant WT081278MA to L.W. Harries and by a charitable donation from the Mendip Golf Club.
REFERENCES
- Dupuis, J., Langenberg, C., Prokopenko, I., et al. (2010) New genetic loci implicated in fasting glucose homeostasis and their impact on type 2 diabetes risk. Nature Genetics, 42, 105-116. doi:10.1038/ng.520
- Voight, B.F., Scott, L.J., Steinthorsdottir, V., et al. (2010) Twelve type 2 diabetes susceptibility loci identified through large-scale association analysis. Nature Genetics, 42, 579-589. doi:10.1038/ng.609
- Morris, A.P., Voight, B.F., Teslovich, T.M., et al. (2012) Large-scale association analysis provides insights into the genetic architecture and pathophysiology of type 2 diabetes. Nature Genetics, 44, 981-990. doi:10.1038/ng.2383
- Vassy J.L. and Meigs J.B. (2012) Is genetic testing useful to predict type 2 diabetes. Best Practice & Research: Clinical Endocrinology & Metabolism, 26, 189-201. doi:10.1016/j.beem.2011.09.002
- van de Bunt M. and Gloyn A.L. (2010) From genetic association to molecular mechanism. Current Diabetes Report, 10, 452-466. doi:10.1007/s11892-010-0150-2
- Consortium, E.P., Bernstein, B.E., Birney, E., et al. (2012) An integrated encyclopedia of DNA elements in the human genome. Nature, 489, 57-74. doi:10.1038/nature11247
- Thurman, R.E., Rynes, E., Humbert, R., et al. (2012) The accessible chromatin landscape of the human genome. Nature, 489, 75-82. doi:10.1038/nature11232
- Neph, S., Vierstra, J., Stergachis, A.B., et al. (2012) An expansive human regulatory lexicon encoded in transcription factor footprints. Nature, 489, 83-90. doi:10.1038/nature11212
- Gerstein, M.B., Kundaje, A., Hariharan, M., et al. (2012) Architecture of the human regulatory network derived from ENCODE data. Nature, 489, 91-100. doi:10.1038/nature11245
- Djebali, S., Davis, C.A., Merkel, A., et al. (2012) Landscape of transcription in human cells. Nature, 489, 101- 108. doi:10.1038/nature11233
- Sanyal, A., Lajoie, B.R., Jain, G., et al. (2012) The longrange interaction landscape of gene promoters. Nature, 489, 109-113. doi:10.1038/nature11279
- Parikh, H., Lyssenko, V. and Groop, L.C.(2009) Prioritizing genes for follow-up from genome wide association studies using information on gene expression in tissues relevant for type 2 diabetes mellitus. BMC Medical Genomics, 2, 72.
- Marselli, L., Thorne, J., Dahiya, S., et al. (2010) Gene expression profiles of beta-cell enriched tissue obtained by laser capture microdissection from subjects with type 2 diabetes. PLoS One, 5, e11499. doi:10.1371/journal.pone.0011499
- Schadt, E.E., Monks, S.A., Drake, T.A., et al. (2003) Genetics of gene expression surveyed in maize, mouse and man. Nature, 422, 297-302. doi:10.1038/nature01434
- Cnop, M. (2008) Fatty acids and glucolipotoxicity in the pathogenesis of type 2 diabetes. Biochemical Society Transactions, 36, 348-352.
- Ghanaat-Pour, H., Huang, Z., Lehtihet, M., et al. (2007) Global expression profiling of glucose-regulated genes in pancreatic islets of spontaneously diabetic Goto-Kakizaki rats. Journal of Molecular Endocrinology, 39, 135-150. doi:10.1677/JME-07-0002
- Ghanaat-Pour, H. and Sjoholm, A. (2009) Gene expression regulated by pioglitazone and exenatide in normal and diabetic rat islets exposed to lipotoxicity. Diabetes/ Metabolism Research and Reviews, 25, 163-184. doi:10.1002/dmrr.896
- Simonis-Bik, A.M., Nijpels, G., van Haeften, T.W., et al. (2010) Gene variants in the novel type 2 diabetes loci CDC123/CAMK1D, THADA, ADAMTS9, BCL11A, and MTNR1B affect different aspects of pancreatic beta-cell function. Diabetes, 59, 293-301. doi:10.2337/db09-1048
- Boesgaard, T.W., Grarup, N., Jorgensen, T., et al. (2010) Variants at DGKB/TMEM195, ADRA2A, GLIS3 and C2CD4B loci are associated with reduced glucose-stimulated beta cell function in middle-aged Danish people. Diabetologia, 53, 1647-1655. doi:10.1007/s00125-010-1753-5
- Grarup, N., Rose, C.S., Andersson, E.A., et al. (2007) Stu- dies of association of variants near the HHEX, CDKN2A/ B, and IGF2BP2 genes with type 2 diabetes and impaired insulin release in 10,705 Danish subjects: Validation and extension of genome-wide association studies. Diabetes, 56, 3105-3111. doi:10.2337/db07-0856
- Cunha, D.A., Hekerman, P., Ladriere, L., et al. (2008) Initiation and execution of lipotoxic ER stress in pancreatic beta-cells. Journal of Cell Science, 121, 2308-2318.
- Vandesompele, J., De Preter, K., Pattyn, F., et al. (2002) Accurate normalization of real-time quantitative RT-PCR data by geometric averaging of multiple internal control genes. Genome Biology, V3, research0034.0031-research- 0034.0011.
- Schleinitz, D., Tonjes, A., Bottcher, Y., et al. (2010) Lack of Significant effects of the type 2 diabetes susceptibility loci JAZF1, CDC123/CAMK1D, NOTCH2, ADAMTS9, THADA, and TSPAN8/LGR5 on diabetes and quantitative metabolic traits. Hormone and Metabolic Research, 42, 14-22. doi:10.1055/s-0029-1233480
- Berditchevski, F. (2001) Complexes of tetraspanins with integrins: More than meets the eye. Journal of Cell Science, 114, 4143-4151.
- Jarikji, Z., Horb, L.D., Shariff, F., et al. (2009) The tetraspanin Tm4sf3 is localized to the ventral pancreas and regulates fusion of the dorsal and ventral pancreatic buds. Development, 136, 1791-1800. doi:10.1242/dev.032235
- Champy, M.F., Voci, L.L., Selloum, M., et al. (2011) Reduced body weight in male Tspan8-deficient mice. International Journal of Obesity, 35, 605-617. doi:10.1038/ijo.2010.165
- Haegebarth, A. and Clevers, H. (2009) Wnt signaling, lgr5, and stem cells in the intestine and skin. American Journal of Pathology, 174, 715-721. doi:10.2353/ajpath.2009.080758
- Carmon, K.S., Gong, X., Lin, Q., et al. (2011) R-spondins function as ligands of the orphan receptors LGR4 and LGR5 to regulate Wnt/beta-catenin signaling. Proceedings of the National Academy of Sciences of the United States of America, 108, 11452-11457. doi:10.1073/pnas.1106083108
- Lowe, S.W. and Sherr, C.J. (2003) Tumor suppression by Ink4a-Arf: Progress and puzzles. Current Opinion in Genetics & Development, 13, 77-83. doi:10.1016/S0959-437X(02)00013-8
- Pruitt, K.D., Tatusova, T., Brown, G.R., et al. (2012) NCBI Reference Sequences (RefSeq): Current status, new features and genome annotation policy. Nucleic Acids Research, 40, D130-D135.
- Watschinger, K., Keller, M.A., Golderer, G., et al. (2010) Identification of the gene encoding alkylglycerol monooxygenase defines a third class of tetrahydrobiopterindependent enzymes. Proceedings of the National Academy of Sciences of the United States of America, 107, 13672- 13677. doi:10.1073/pnas.1002404107
- Pascoe, L., Tura, A., Patel, S.K., et al. (2007) Common va- riants of the novel type 2 diabetes genes CDKAL1 and HHEX/IDE are associated with decreased pancreatic beta-cell function. Diabetes, 56, 3101-3104. doi:10.2337/db07-0634
NOTES
*Conflict of interest: The authors do not have any conflict of interest with the content of the manuscript.