Advances in Chemical Engineering and Science
Vol. 2 No. 3 (2012) , Article ID: 20827 , 9 pages DOI:10.4236/aces.2012.23041
Infrared Spectroscopy and Thermal Stability Studies of Natural Rubber-Barium Ferrite Composites
1Physics Department, Faculty of Science, Taif University, Taif, KSA
2Physics Department, Faculty of Science, Benha University, Benha, Egypt
Email: *cairouni1@yahoo.com
Received December 13, 2011; revised January 15, 2012; accepted January 26, 2012
Keywords: Natural Rubber; Barium Ferrite; TG; Thermal Stability
ABSTRACT
Natural Rubber (NR)-barium ferrite (BaF) composites (RFCs) have been prepared. Structural features of the composites were characterized by Infrared spectroscopy and scanning electron microscope (SEM). Differential scanning calorimetry (DSC) analysis showed that there is small variation of glass transition temperature (≈–1˚C). The activation energy of glass transition was calculated by Kissinger method and has values between (53 - 110 kJ/mol). Thermodynamic parameters such as activated entropy, enthalpy and Gibbs free energy were calculated for glass transition also. Thermogravimetric analysis TG and its derivative DTG showed one stage thermal decomposition between 300˚C - 400˚C with weight loss between (19.47% - 52.13%). Increasing barium ferrite loading will increase the thermal stability of natural rubber. The kinetic parameters such as activation energy, entropy, enthalpy and Gibbs free energy for composites in the decomposition region were calculated and analyzed using Coats-Redfern technique.
1. Introduction
Natural Rubber (NR) has long been considered as an excellent general purpose polymer with wide-ranging industrial applications. Also, its unique combination of properties has made it an elastomer of choice for many of the sophisticated engineering applications [1]. However, one of the limitations of NR is its low value of hightemperature stability. Quite often, the additives, such as plasticizers, fillers, curatives, flame-retardants, etc., used for compounding, affect the thermal and thermo-oxidative stability of the base polymer, good information about which may be obtained from thermal analysis methods such as TGA, DSC. Hard ferrite or ceramic permanent magnets are considered to be an important and sophisticated class of engineering materials, which are used extensively in various applications. Hexaferrite magnets have found acceptance in many electronic products, as a result of their superior cost efficiency, large corecivity, and specific magnetic saturation associated with their high magnetic and chemical stability [2,3]. The advantages of polymer bonded magnets over their metallic and ceramic counterparts include low weight and cost, resistance to corrosion, ease of machining and forming, and capability of high production [4]. The impregnation of magnetic fillers in the matrix imparts magnetic properties and modifies the physical properties of the matrix considerably [5]. A few researches have reported the processing and dynamical properties of polymer composites containing hexaferrite prepared by ordinary methods up to 120 phr (part per hundred part of rubber). The result indicates poor adhesion between ferrite particles and polymer, in spite of the fact that the percolation was not achieved yet for these types of composites. The maximum loading was about 120 phr [6-9].
This work forms part of a comprehensive study focusing on the fabrication of hard magnetic ferrite and rubber-ferrite composites (RFCs), and study their physical properties (curing, mechanical, magnetic, and electrical properties) as a function of ferrite content. The present manuscript is an attempt to understand the IR, thermal stability and decompositions characteristic in the case of high coercivity materials-polymer composites as a function of ferrite loading up to 200 phr.
2. Experimental Procedure
Barium ferrite powders having a coercive force of 5.2 kOe, magnetization 67 emu/gm and 45 - 200 µm particle size were prepared by a coprecipitation method according to Makled et al. [10]. After characterization they were mixed with a natural rubber ADS (air dried sheet) by various loading up to 200 phr to form rubber-ferrite composites (RFCs). The recipe used for this study is given in Table 1. The composites were prepared in a two-roll mixing mill and after homogenization they were cured and molded into thin sheets of 1 - 2.5 mm in thickness at 150˚C using a hydraulic press according to ASTM D-15. The SEM samples were prepared by fracturing the samples and polishing the surfaces under liquid nitrogen, followed by carbon coating. The IR analysis was performed using a PYE spectrophotometer over the range 200 - 1000 cm–1. Thermal analysis was carried out using a computerized DSC and TGA, TA-50 Schimadzu Corporation, Kyoto, Japan. Measurements were carried under nitrogen atmosphere (30 ml/min).
3. Results and Discussion
3.1. SEM Characterization
Figure 1 shows the distribution of ferrite particles in rubber matrix at 200 phr. The variation of particle sizes, the broad particle distribution, and the homogeneous
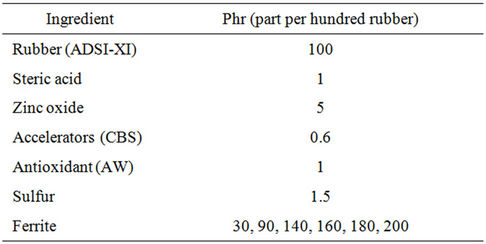
Table 1. Formulation of the mixes for preparing natural rubber-barium ferrite-composites.
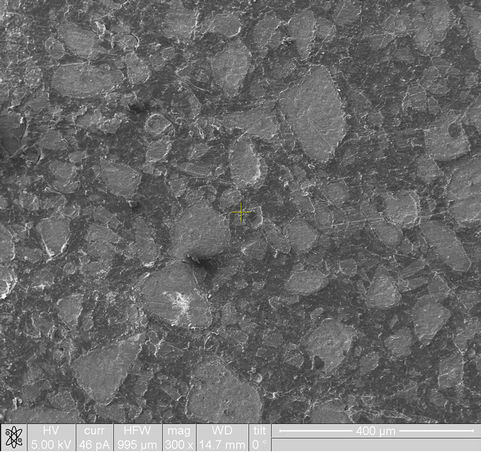
Figure 1. SEM image for natural rubber-barium ferrite composites at 200 phr ferrite loadin.
dispersion can be observed. It also noticed there is no tendency to form agglomerates in the present RFCs even at high loading level. These unusual behaviors can be attributed to the nature of ferrite particles and the degree of mixing, which are critical factors in controlling the physical properties of a polymer-bonded magnet [11].
3.2. IR Spectroscopy
Infrared studies indicated the presence of two strong absorption bands ν1 and ν2 which are found in the expected range as shown in Figure 2. Assignment of bands is given in Table 2. The high frequency band ν1 is in the range 590 to 600 cm–1 and the lower one ν2 in the rang 438 to 446 cm–1. The change in the band position is due to the change in the Fe3+-O2– internuclear distance of the octahedral and tetrahedral sites. Waldron [12] and Hafner [13] attributed the ν1 to the intrinsic vibration of the tetrahedral groups, whereas ν2 is due to is due to octahedral groups. A small band ν3 in the range of 334 to 342 cm–1 is assigned to the divalent octahedral metal ions—oxygen ion complex [14]. The appearance of the band ν4 in the range 292 - 298 cm–1 depends on the mass of the divalent tetrahedral cation and is assigned to the lattice vibration [15]. It is also observed that, ν1 shifts towards higher frequency side with increasing particle size. The reason for this could be attributed to shifting of Fe3+ ions toward oxygen ions with increasing the particle size, then the average bond length increases.
3.3. Differential Scanning Calorimetry and Thermodynamic Parameters
DSC provides information concerning the enthalpy change accompanying a physical or chemical event, within a material. The glass transition is a second order event, which manifests itself in a DSC curve as a step changing corresponding to the change in the heat capacity of the system [16].
Figure 3 shows DSC curves measured from natural rubber-barium ferrite composites at heating rate 10˚C/min. The curves exhibited changes in the base line in the temperature range (–59˚C - 58˚C) which are attributed to the
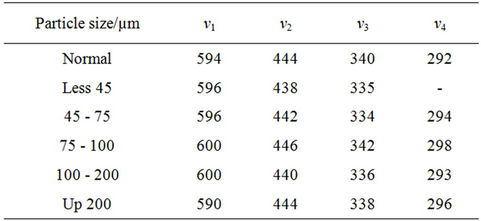
Table 2. IR absorptions bands for natural rubber-barium ferrite-composites.
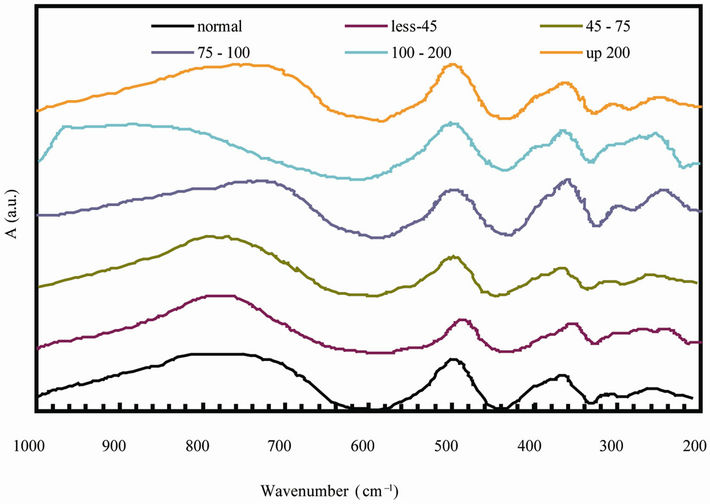
Figure 2. IR spectra of for natural rubber-barium ferrite composites.
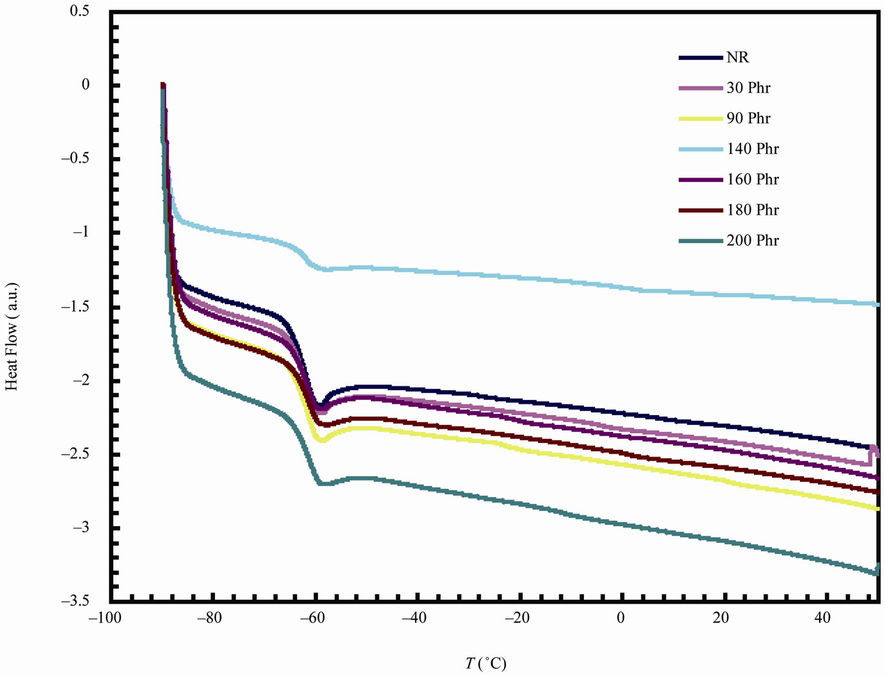
Figure 3. DSC thermograms for natural rubber-barium ferrite composites.
glass transition temperatures of the investigated samples. The results of the glass transition temperatures are summarized in Table 3. The variation of glass transition temperature with ferrite loading is small (≈–1˚C). This
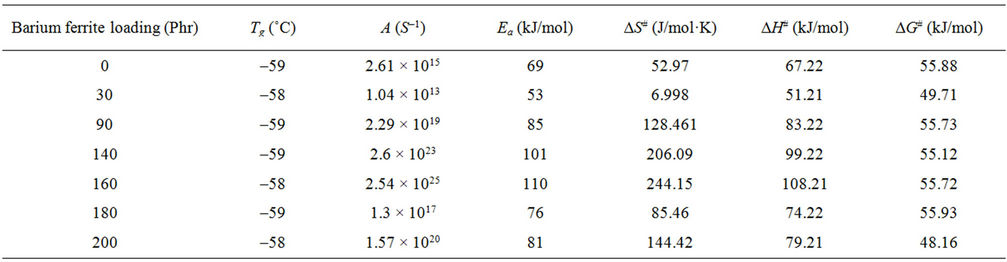
Table 3. Glass transition thermodynamic parameters for natural rubber-barium ferrite composites.
small variation could be associated with the imposed restriction due to the interaction between the filler and the rubber matrix [17]. The present Tg behavior is exactly coincide with the results which obtained from the dynamic properties of RFCs [18]. The activation energy of glass transition can be achieved by using the Kissinger formula, which was initially derived for the crystallization process but it is suggested as being valid for the glass transition [19,20]. This formula has the following form:
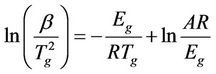 (1)
(1)
where R is the universal gas constant, β is heating rate, Tg is the glass transition temperature, Eg is the glass transition activation energy, and A is the pre-exponential factor. The change of the entropy (∆S#) may be calculated according to the relation [21,22]:
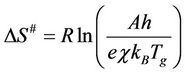 (2)
(2)
where A is the pre-exponential factor obtained from the Kissinger method, e is the Neper number, χ is transition factor, kB is the Boltzmann constant, h is the Plank constant. The change of enthalpy (∆H#) may be obtained according to:
 (3)
(3)
where E# is the activation energy. The change of Gibbs free energy ∆G# for the glass transition process can be calculated using the well known thermodynamic relation:
 (4)
(4)
The variation of glass transition temperature with heating rate (β = 10, 20, 30, 40˚C/min) is represented in Figure 4 for NR and 90 phr loading samples (for sake of brevity). The values of Eg can be estimated from the plot of  versus 1/Tg relation (Figure 5) whose slope is –Eg/R.
The values of the activation parameters are summarized in Table 3. The activation energy takes values between (53 - 110 kJ/mol). The higher values of activation energy can be attributed to the adhesion between the ferrite particles and NR matrix [10] as a result of increasing ferrite loading up to 160 phr. After this ferrite loading the dilution effect occurs as a result of the diminishing volume fraction of the polymer in the composites. The values of ∆S# for glass transition are positive indicating that the corresponding activated composites have higher disorderness than the initial state. The positive values of ∆G# indicated that glass transition process is not spontaneous at room temperature. The larger ∆G#, the harder transition process. The endothermic peaks in DSC curves agree well with the positive sign of the activation enthalpy. The larger values of ∆H# means more energy needed for transition.
3.4. Thermal Decomposition Characteristics and Thermal Stability
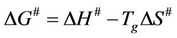
Figure 6 shows the Thermogravimetric (TG) and its derivative DTG curves for natural rubber-barium ferrite composites. The decomposition step as well as percentage weight loss are given in Table 4. TG and DTG curves of all samples have shown the same general shape, suggesting that the decomposition mechanisms are simi-
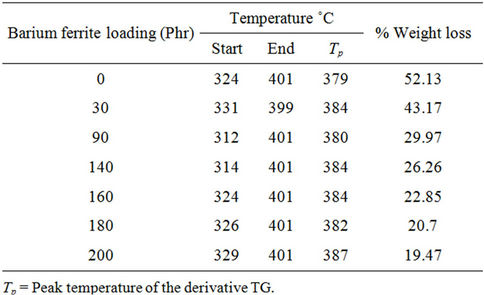
Table 4. TG and DTG data for natural rubber-barium ferrite composites in the decomposition region.
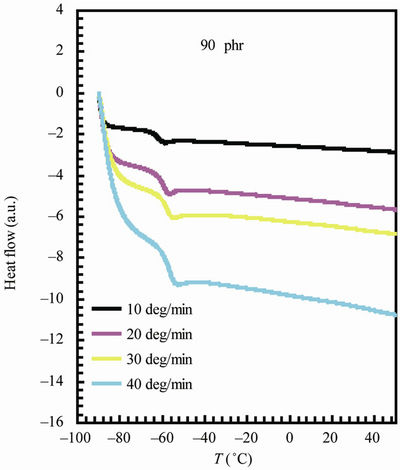
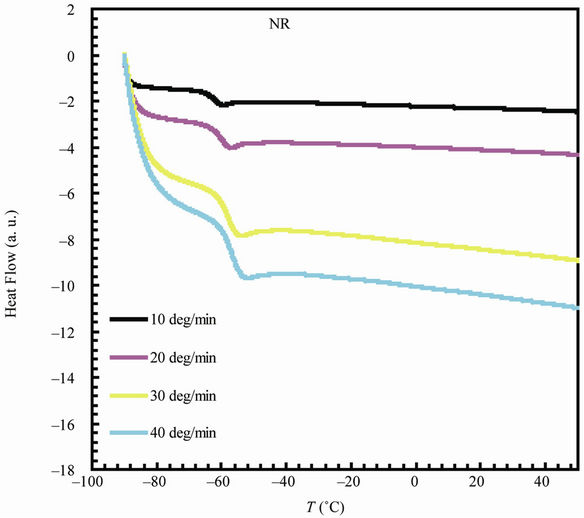
Figure 4. DSC thermograms for natural rubber and 90 phr composite samples at different heating rates.
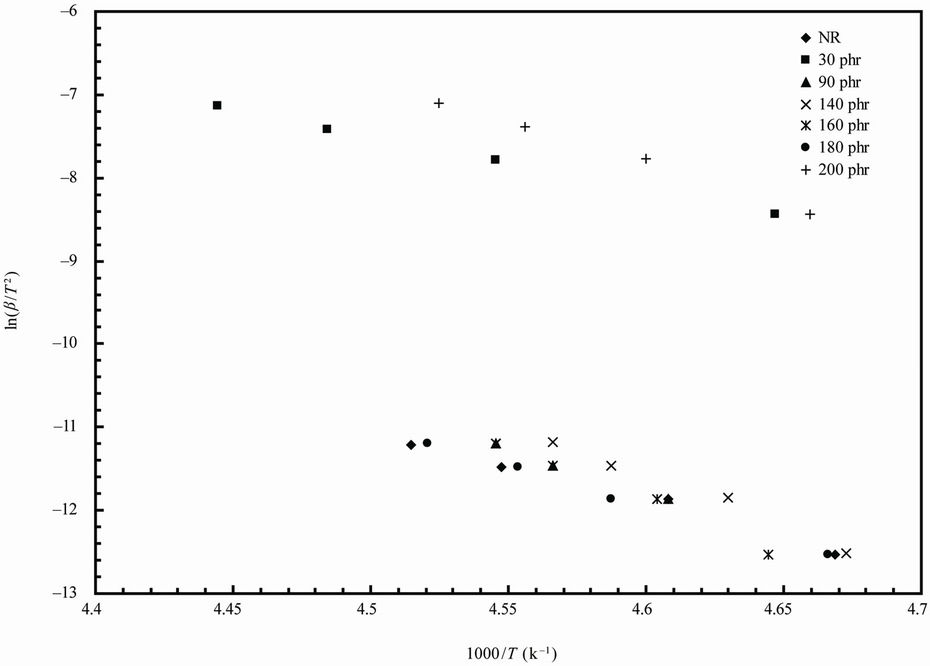
Figure 5. Kissinger plots for natural rubber-barium ferrite composites.
lar. All samples studied exhibited an initial small mass loss attributed to the elimination of volatile components such as water, and ammonia residue [23]. All samples are stable up to 300˚C. It can be seen that the TG curves
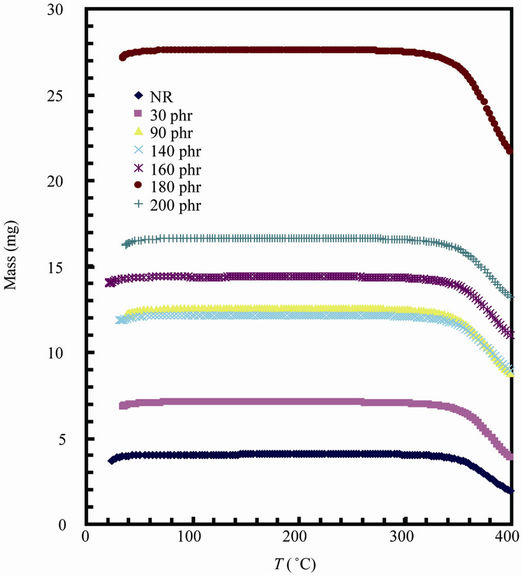
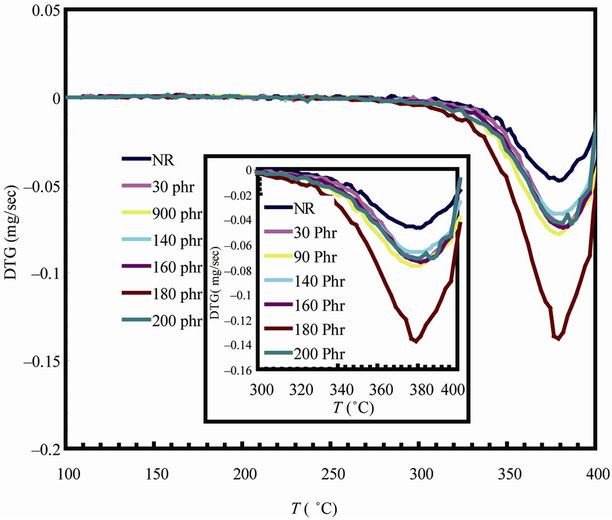
Figure 6. TG and DTG curves for natural rubber-barium ferrite composites.
have only one large plateau and the DTG curves have only one degradation peak, indicating that thermal degradation of samples is mostly one stage process. The decomposition ranged from approximately 300˚C - 400˚C, with mass loss ranging from 52.17% - 19.43%, and this is assigned to thermal decomposition of natural rubber into monomers, dimers, trimers, etc.
The temperature of the maximum loss rate or peak temperature of the DTG curves ranges from 379˚C - 387˚C, and the decreasing of weight loss is due to the increase of non-volatile filler content in the composite samples.
3.5. Kinetics of Thermal Degradation
It has been reported that above 300˚C, the volatilization of natural rubber becomes more rapid and is substantially complete at temperature near 400˚C. In cis-1,4-polyisoprene vulcanizates, the transitions which occur above 300˚C have been found to be of greater significance because of a strong correlation between the thermal properties and the elastomer combustibility [24]. Therefore, the kinetic parameters have been evaluated only for the major decomposition observed between 300˚C and 400˚C. The kinetic parameters are calculated using Coates and Redfern method [25]:
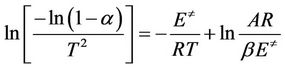 (5)
(5)
where α is fraction of decomposition,  is the activation energy and other symbols as defined before. Therefore, plotting
  against 1/T according to Equation (5) should give a straight line whose slope is directly proportional to the activation energy (
 ).
).
The activation entropy ∆S# [26]:
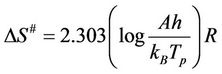 (6)
(6)
The activation enthalpy ∆H#, and the Gibbs free energy ∆G# were calculated using the following Equations (3) and (4) with replacing Tg by Tp (Tp is the peak temperature of DTG). The entropy ∆S# gives information about the degree of disorder of the system, the enthalpy ∆H# gives information about the total thermal motion and Gibbs or free energy (∆G#) gives information about the stability of the system.
Figure 7 represents the Coats-Redfern plots of the decomposition step for NR and 90 phr loading samples
(for sake of brevity). The calculated kinetic parameters are given in Table 5. The higher values of activation energies show an improved resistance to degradation process.
4. Conclusion
Natural rubber-barium ferrite composites have been prepared. Variation of particle sizes, distribution, and the homogeneous dispersion can be observed Via SEM. Also there is no tendency to form agglomerates in the present composite system even at high loading level. Infrared studies indicated the presence of two strong absorption bands ν1 and ν2. The change in the band position is due to the change in the Fe3+-O2– internuclear distance of the octahedral and tetrahedral sites. There is small variation of the glass transition temperatures under increasing of ferrite loading. The thermodynamic parameters values indicated that the glass transition process is more disorderrness, not spontaneous or harder process, more energy
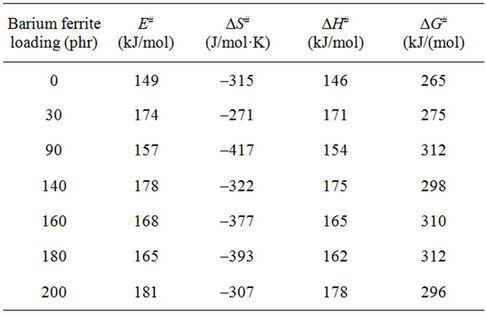
Table 5. Thermodynamic parameters for natural rubberbarium ferrite composites in the decomposition region.
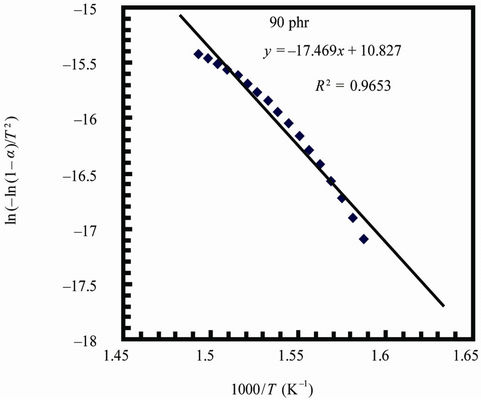
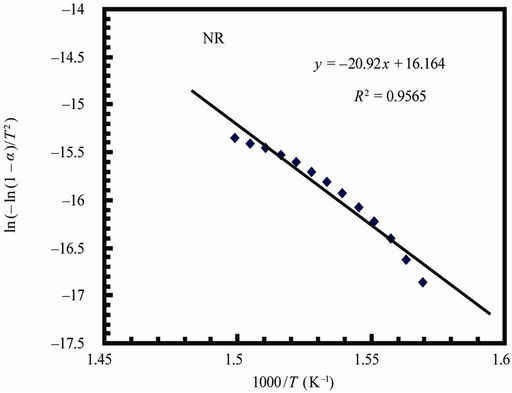
Figure 7. Coats-redfern plots for natural rubber and 90 phr composite samples.
needed to occur. Increasing of ferrite loading enhance the thermal stability of natural rubber.
REFERENCES
- D. E. El-Nashar, S. H. Mansour and E. Girgis, “Nickel and Iron Nano-Particles in Natural Rubber Composites,” Journal of Materials Science, Vol. 41, No. 2, 2006, pp. 5359-5364. HUdoi:10.1007/s10853-006-0179-4U
- M. H. Makled, T. Matsui, H. Tsuda, H. Mabuchi, M. K. El-Mansy and K. Moric, “Magnetic and Dynamic Mechanical Properties of Barium Ferrite-Natural Rubber Composites,” Journal of Material Processing Technology, Vol. 160, No. 2, 2005, pp. 229-233. HUdoi:10.1016/j.jmatprotec.2004.06.013U
- E. C. Milke, M. Rei, J. P. de Souze and L. Schaeffer, “Powder Injection Molded Strontium-Ferrite Magnets,” International Journal of Powder Metallurgy, Vol. 37, No. 5, 2001, pp. 47-51.
- J. U. Otaigbe, H. S. Kim and J. Xiao, “Effect of Coupling Agent and Filler Particle Size on Melt Rheology of Polymer-Bonded Nd-Fe-B Magnets,” Polymer Composites, Vol. 20, No. 5, 1999, pp. 697-704. HUdoi:10.1002/pc.10393U
- J. Xiao and J. U. Otaigbe, “Polymer Bonded Magnets. II. Effect of Liquid Crystal Polymer and Surface Modification on Magneto-Mechanical Properties,” Polymer Composites, Vol. 21, No. 2, 2000, pp. 332-342. HUdoi:10.1002/pc.10190U
- M. A. Solomon, P. Kurian, P. A. Joy and M. R. Anantharaman, “Processability and Magnetic Properties of Rubber Ferrite Composites Containing Barium Ferrite,” International Journal of Polymeric Material, Vol. 53, 2004, pp. 565-575.
- M. A. Solomon, P. Kurian, M. R. Anantharaman and P. A. Joy, “Evaluation of the Magnetic and Mechanical Properties of Rubber Ferrite Composites Containing Strontium Ferrite,” Polymer Plastic Technology and Engineering, Vol. 43, No. 4, 2004, pp. 1013-1028. HUdoi:10.1081/PPT-120038602U
- D. R. Saini, V. M. Nadkarni, P. D. Grover and K. D. P. Nigam, “Dynamic Mechanical, Electrical and Magnetic Properties of Ferrite Filled Styrene-Isoprene-Styrene,” Journal of Material Science, Vol. 21, No. 10, 1986, pp. 3710-3716. HUdoi:10.1007/BF02403026
- M. A. Solomon, P. Kurian, M. R. Anantharaman and P. A. Joy, “Cure Characteristics and Dielectric Properties of Magnetic Composites Containing Strontium Ferrit,” Journal of Elastomers and Plastics, Vol. 37, No. 2, 2005, pp. 109-121. HUdoi:10.1177/0095244305046488
- M. H. Makled, T. Matsui, H. Tsuda, H. Mabuchi, M. K. El-Mansy and K. Morii, “Effect of Particle Size and Its Distribution on the Fabrication and Magnetic Properties of Barium Ferrite Powders Prepared from Coprecipitated Precursors,” Journal of the Ceramic Society of Japan, Vol. 112, No. 1304, 2004, pp. 200-203. HUdoi:10.2109/jcersj.112.200
- J. Xiao and J. U. Otaigbe, “Polymer-Bonded Magnets: Part I. Analytic Thermogrvimetry to Determine the Effect of Surface Modification on Dispersion of Nd-Fe-B Filler,” Journal of Materials Research, Vol. 14, No. 7, 1999, pp. 2893-3896. HUdoi:10.1557/JMR.1999.0386
- R. D. Waldrons, “The Infrared Spectra of Ferrites,” Physics Review, Vol. 99, No. 6, 1955, pp. 1727-1735. HUdoi:10.1103/PhysRev.99.1727
- M. A. Mousa and M. A. Ahmed, “Electrical Conduction in γ-Irradiated and Unirradiated Zinc-Iron Ferrites,” Chemistry and Material Science, Vol. 23, No. 9, 1988, pp. 3083-3087. HUdoi:10.1007/BF00551277
- O. S. Josyulu and Sobhanadri, “The Far-Infrared Spectra of Some Mixed Cobalt Zinc and Magnesium Zinc Ferrites,” Physica Status Solidi (a), Vol. 65, No. 2, 1981, pp. 479-483. HUdoi:10.1002/pssa.2210650209U
- J. Preudhomme and P. Tarae, “Infrared Studies of Spinels: III: The Normal II-III Spinels,” Spectrochim Acta Part A, Vol. 27, No. 9, 1971, pp. 1817-1835.
- D. W. Brazier, “Applications of Thermal Analytical Procedures in the Study of Elastomers and Elastomer Systems,” Rubber Chemistry and Technology, Vol. 53, No. 3, 1980, pp. 437-512. HUdoi:10.5254/1.3535051
- A. D. Falco, S. Goyanes, G. H. Rubiolo, I. Mondrayon and A. Marzocca, “Carbon Nanotubes as Reinforcement of Styrene-Butadiene Rubber,” Applied Surface Science, Vol. 254, No. 1, 2007, pp. 262-265. HUdoi:10.1016/j.apsusc.2007.07.049U
- M. H. Makled, Y. Washiya, H. Tsuda and T. Matsui, “Effect of Coprecipitated Barium Ferrite on the Cure Characteristics and Dynamic Properties of Natural Rubber-Ferrite Composites around Percolation,” Journal of Applied Polymer Science, Vol. 113, No. 5, 2009, pp. 3294-3299. HUdoi:10.1002/app.30263
- H. E. Kissinger, “Reaction Kinetics in Differential Thermal Analysis,” Analytical Chemistry, Vol. 29, No. 11, 1957, pp. 1702-1706. HUdoi:10.1021/ac60131a045
- R. P. Wang, C. J. Zha, A. V. Rode, S. J. Madden and B. Luther-Davies, “Thermal Characterization of Ge-As-Se Glasses by Differential Scanning Calorimetry,” Journal of Materials Science: Materials Electronics, Vol. 18, No. 1, 2007, pp. 419-422.
- B. Boonchom and S. Puttawong, “Thermodynamics and Kinetics of the Dehydration Reaction of FePO4·2H2O,” Physica B, Vol. 405, No. 9, 2010, pp. 2350-2355. HUdoi:10.1016/j.physb.2010.02.046
- L. Vlaev, N. Nedelchev, K. Gyurova and M. Zagorcheva, “A Comparative Study of Non-Isothermal Kinetics of Decomposition of Calcium Oxalate Monohydrate,” Journal of Analytical and applied Pyrolysis, Vol. 81, No. 2, 2008, pp. 253-262. HUdoi:10.1016/j.jaap.2007.12.003
- L. C. S. de Oliveira, E. J. de Arruda, R. B. da Costa, P. S. Goncalves and A. E. Job, “Evaluation of Thermal Behavior of Latex Membranes from Genetically Improved Rubber Tree (Hevea Brasiliensis),” Thermochimica Acta, Vol. 445, No. 1, 2006, pp. 27-31. HUdoi:10.1016/j.tca.2006.03.027
- L. Slusarski and G. Janowska, “The Effect of the Network Structure of the Thermal Properties of Cis-1,4-Polyisoprene Vulcanizates,” Journal of Thermal Analytical and Calorimetry, Vol. 29, No. 1, 1984, pp. 95-104. HUdoi:10.1007/BF02069944
- A. W. Coats and J. P. Redfern, “Kinetic Parameters from Thermogravimetric Data,” Nature, Vol. 201, No. 4914, 1964, pp. 68-69. HUdoi:10.1038/201068a0U
- F. Yakuphanoglu, A. O. Gorgulu and A. Cukurovali, “An Organic Semiconductor and Conduction Mechanism: N-[5-methyl-1,3,4-tiyodiazole-2-yl] Ditiyocarbamate Compound,” Physica B, Vol. 353, No. 3-4, 2004, pp. 223-229. HUdoi:10.1016/j.physb.2004.09.099U
NOTES
*Corresponding author.