Open Journal of Geology
Vol.3 No.2(2013), Article ID:30364,4 pages DOI:10.4236/ojg.2013.32010
Application of Activity and Wavelet Analysis on Well Logging Sedimentary Cycle Division
School of Geology and Environment, Xi’an University of Science and Technology, Xi’an, China
Email: gloria_gy@live.cn
Copyright © 2013 Xinhu Li, Yuan Guo. This is an open access article distributed under the Creative Commons Attribution License, which permits unrestricted use, distribution, and reproduction in any medium, provided the original work is properly cited.
Received December 29, 2012; revised January 8, 2013; accepted February 8, 2013
Keywords: Well Logging; Activity; Sedimentary Cycle; Wavelet Transform
ABSTRACT
The method of sedimentary cycle division is studied based on comprehensive research and activity analysis of well logging, combined with wavelet analysis and characteristics of stratigraphic cycle. Based on the method above, this paper divided stratigraphic cycles and finely classified the tratifigraphic by taking H1518 in HSS oilfield as an example. The result shows that sedimentary cycle can be divided effectively based on key stratum study, activity and wavelet analysis of well log, and the research of sedimentary cycle characteristics. H1 formation can be divided into 1 sand group, 3 sand layers and 7 single layers.
1. Introduction
The H1 formation in HSS oilfield is the upper part of the Permian Pingdiquan formation, whose sedimentary thickness is 1500 - 2000 m, and it belongs to lacustrine faciesdelta sedimentary system. H1 formation is a set of offwhite, gray fine sandstone, siltstone interbedded with gray, dark gray mudstone and dolomitic mudstone. The reservoir mainly consists of feldspathic packsand with dense cementation whose main component is calcite and analcime followed by. According to the statistics of 3 sands layer, H1 formation contains 64 oil sand bodies in which 38 are single well oil sand bodies and the average area is 0.55 km2. The reserves abundance is low and the physical property is bad.
According to sedimentary facies analysis, we know H1 formation mainly contains some small channels and terminal channel deposits and is characterized by moderate or poor delta channel and terminal channel sand. Although the channel extends very far, the flow potential is weak, and the boundary between the channels is unclear, with the characteristics of net channel. The division of the layer sand in the research area requires high resolution, besides deltaic deposit stratigraphic change quickly in horizon and is massive in vertical, so the study of horizontal comparison is difficult.
Three logs, interval transit time (DT), natural gamma ray (GR), deep resistivity (RT) are chosen in order to make a better comparability between each well in the area. In full use of core, logging and laboratory analysis data, based on marker bed, fine correlation of horizons are doing by combining the activity, wavelet analysis and sedimentary cycle.
2. Division of Cycle Interface
2.1. Characteristics of Activity and Wavelet Analysis [1-6]
When formation lithology (layer interface) changes, the corresponding changes in the magnitude of logging is the biggest and the fastest, so where formation lithology (layer interface) changes is the peak of well logging activity, namely logging interface is the peak of the activity curve.
Sand/mud relative content and sand-mud interbedded frequency is an important indicator of stratigraphic division, and also is important evidence for the division of continental basin base-level cycle and sequence. The two indicators can be accessed by GR-Dmey wavelet transform fast and accurately, so GR-Dmey wavelet can be used as the quantitative indicator of stratigraphy division.
For the decomposition and reconstruction of logging signal based on Dmey wavelet, first, the signal S is decomposed into high frequency signal d1 and low-frequency signal a1; then a1 is divided into low frequency signal a2 and high frequency signal d2, and so on (the logging signal will be decomposed 7 times in this paper); then the signals are reconstructed by use of the low and high frequency coefficients to obtain the similar signal a6-a1 of logging under different levels and the corresponding detail signal d1-d7, d1-d6 ··· d1-d2 and d1. The a7- a1 represents low-frequency of original logging, which shows the trend of logging, and d1-d7, d1-d6 ··· d1-d2 and d1 represent high frequency of the logging corresponding to a7-a1.
2.2. Division of Cycle Interface
Sequence boundary usually is lithology abrupt interface. The differences in lithology between the interfaces respond to most well logs significantly, that is, on different lithological boundaries, the physical properties change obviously which shows mutations of logging [1]. This dynamic change of the logging can be expressed by use of characteristic classification function GRAY. Characteristic classification function is mainly used to determine the size of interface and the relative mutation degree of the logging. It is calculated as:

In the formula, ACTIV represents activity peak; DVALU represents difference of logging between interfaces and WIDT represents the width of activity peak.
Large interface corresponds to bigger characteristic classification function, while small interface corresponds to smaller characteristic classification function. According to the degree of detail in the study, characteristic classification function can be processed further.
Through the analysis and solution above, the interface corresponding to the sample point extracted from lager characteristic classification function represents cycle surface at certain level, the rock strata group in which range composed some cycle characteristic.
3. Distinguishing of Sedimentary Cycle
3.1. Distinguishing of Loging Curve Shapes
In different sedimentary environments, the difference of source conditions, hydrodynamic and water depth conditions inevitably lead to different sediment combination and sequence features (forward cycle, reverse cycle and massive), which reflect different logging curve shapes, namely the bell-shaped, funnel-shaped, cylinder and so on. Through the identification of cycle interface, at certain section that was defined by cycle surface, the well logging is fitted to obtain mathematical expressions of the fitting logging, whose first rank derivative is deduced to get the coefficient of independent variable in the highest rank. Based on the coefficient of independent variable in the highest rank, from bottom to top, if the value is negative, which represents that the curve amplitude (GR, SP) showed an increasing trend and the logging is bellshaped; if the value is positive, then the logging is funnel-shaped; if it changes near 0, the curve is cylinder.
3.2. Characteristic of Sedimentary Cycle
Characteristic of sedimentary cycle that was defined by sequence interface shown as: 1) sandstone group or layer thinning or thickening upward; 2) sand-shale ratio reducing or increasing upward; 3) particle size decreasing or increasing upward. Logging response characteristics of sedimentary cycle mainly show changes of combination type and stacking pattern, which can be divided into progradation stacking pattern, retrogradation stacking pattern, aggradation stacking pattern and so on.
1) Aggradation stacking pattern shows as the same rhythm repeating to form the combination of sendimentary rock without obvious changes in thickness of strata and size of rock grain. The amplitude of logging changes little, and well logging curves appear cylinder whose characteristic classification function is small as a whole (Figure 1(a)).
2) Progradation stacking pattern presents as single sandstone increasing upward and grain size thickening which are the combination features of lithological during water regression. It reflects the sedimentary background like water shoaling and sedimentary energy increasing gradually. The logging’s magnitude increase from the bottom to up, take turns, and well logging curves appear funnel-shaped; whose characteristic classification function shows an increasing trend from the bottom to up (Figure 1(b)).
3) Regressive stacking pattern displays as sandstone thicken decreasing from the bottom to up, which is deposit product at water-transgression. The logging’s magnitude decrease from the bottom to up, and well logging curves appear bell-shaped, whose characteristic classification function shows decreasing trend from the bottom to up (Figure 1(c))
4. Applications
Base on the analysis above, the solution of the logging’s activity and optimal eigenvalue, the division of cycle interface, the distinguishing of the logging shape and wavelet analysis of H1518 in HSS oil field are done by use of MATLAB© program. In Figure 2, the data point 0 - 656 from left to right represents the logging depth from top to bottom, and “XX line” is broken stick divided artificial for analysis. Figure 3 is an example of using activity and optimal eigenvalue to assist the division of strata. As to the high-frequency signals d4, d5 from decomposing and reconstructing, the well logging shows significant differences in upper and lower of Line 1, which can be regarded as a major interface corresponding to the depth 1461.625 m, and larger characteristic classification
 (a)
(a)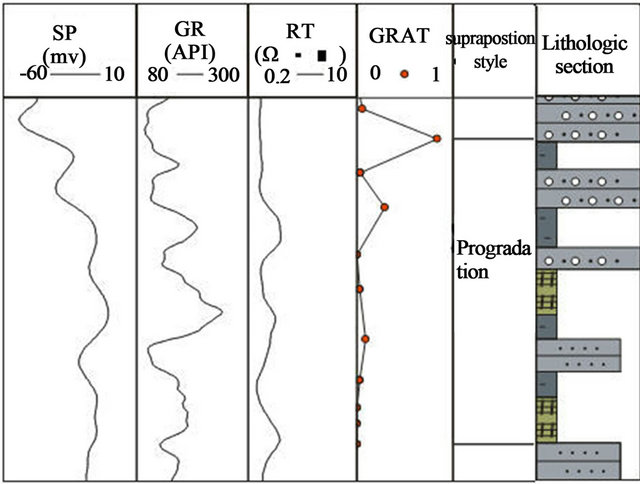 (b)
(b)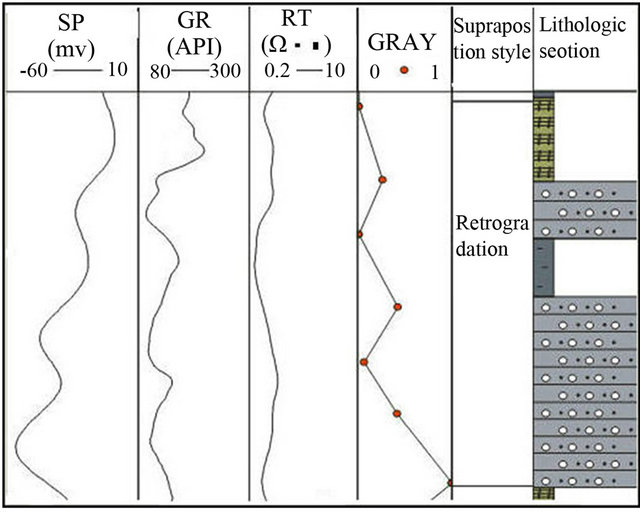 (c)
(c)
Figure 1. The well logging response characteristics of sedimentary cycle; (a) Aggradation (b) Progradation (c) Retrogradation.
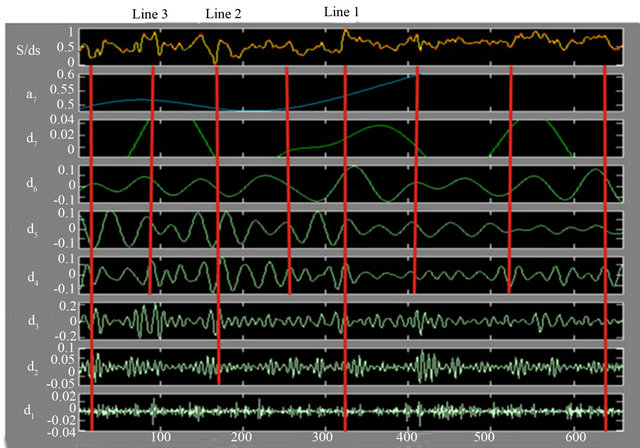
Figure 2. The decomposed diagram of Demy wavelet from well H1518 in HSS oilfield based on GR logging.
function appears in Figure 3. There showed larger characteristic classification function in depth 1443.75 in finger 3 which corresponding to Line 2 in Figure 2. In the view of the high-frequency signal d2, d3, there exists difference in the depth 1443.75, which showed relative greater amplitude in the up (left), where the characteristic
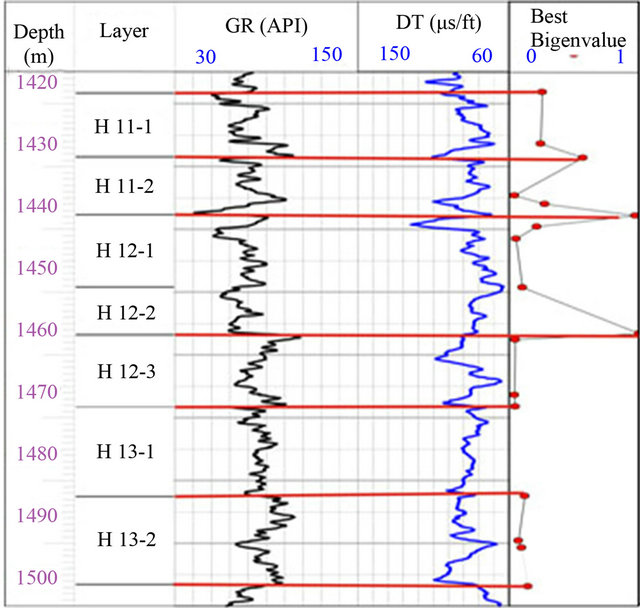
Figure 3. Stratum cycle division diagram of well H1518 in HSS oilfield based on activity and wavelet analysis.
of signal is different from top to bottom, and the upper (left) relative shows greater amplitude. The high-frequency signal d2, d3 appears abnormal fluctuations on Line 3 at 1433.625 m in Figure 2, whose characteristic classification function reach maximum value at the same depth in Figure 3. The other interface whose characteristic classification functions are relatively large can be distinguished with other data. As to the 7 decomposition of Dmey wavelet in well H1518, the low frequency and high frequency signal from 7 decomposition and reconstruction with obvious regularity show law and characteristic of sedimentary cycle.
Based on the analysis above, the thin layer of approximately 500 wells in whole area are divided by use of 5 key stratum (mudstone at top of H11-2 and H12-2; mudstone at bottom of H12-3, H13-1 and H13-2; thick shale at bottom of H12-2), activity analysis of the logging, Demy wavelet analysis and interpretation of sedimentary cycle. Thus, H1 formation can be divided into 1 sands group, 3 sand layers and 7 single layers. The formation thickness is pinching from north to south and thickening from west to east gradually.
5. Conclusions
1) The key stratum in this study is mudstone at top of H11-2 and H12-2; mudstone at bottom of H12-3, H13-1, and H13-2; thick shale at bottom of H12-2. The characteristics of the main well logging are DT, RHOB, and RT reducing significantly and borehole diameter expanding at some part.
2) Activity and wavelet analysis of the logging can be regarded as assistant index beds for sedimentary cycle division. Interface divided by logging corresponds to the peak of the activity curve. Large interface corresponds to the larger characteristic classification function value, while small interface corresponds to smaller characteristic classification function value.
3) H1 formation can be divided into 1 sand group, 3 sand layers and 7 single layers according to the shale markers, assisted by activity and wavelet analysis of the logging, combined with the sedimentary cycle characteristics of stratum.
6. Acknowledgements
Thanks for the supports of National Natural Science Foundation of China (41072110), Natural Science Research Projects of Shaanxi Province (SJ08D06) and Natural Science Research Projects of Shaanxi Education Bureau (09JK575).
REFERENCES
- X. H. Li, “Application of Wavelet Analysis to Well Logging Sequence Stratigraphic Division: Taking Tenggeer Formation Well Da 30 in Baiyinchagan Sag, Erlian Basin as an Example,” Natural Gas Geoscience, Vol. 19, No. 3, 2008, pp. 385-389.
- J. B. Zhu and P. K. Zhao, “Application of Well Log Activity Curve to Parasequence Classification,” Xinjiang Petroleum Geology, Vol. 26, No. 4, 2005, pp. 426-427.
- J. B. Zhu, Y. L. Ji and P. K. Zhao, “Application of Wavelet Transform in Auto-Identify Units of Stratigraphy Sequence,” Petroleum Exploration and Development, Vol. 2, No. 2, 2005, pp. 84-86.
- X. B. Li, Y. R. Guo, H. Q. Liu, et al., “The Application of Wavelet Analysis in Sequence Stratigraphic Subdivision of the Yanchang Formation, Ordos Basin,” Natural Gas Geoscience, Vol. 17, No. 6, 2006, pp. 779-782.
- X. Li, Y. R. Fan, L. W. Yang, et al., “Applicat Ion of Wavelet Inversion Characteristics of Logging Curve in the Classification of Sequence Stratigraphy,” Petroleum Geology & Oilfield Development in Daqing, Vol. 25, No. 4, 2006, pp. 112-115.
- J. L. Zhao, C. Q. Tan, N. Li, et al., “Application of Wavelet Analysis in High Resolution Sequence Analysis,” Journal of Earth Sciences and Environment, Vol. 29, No. 1, 2007, pp. 90-94.