Agricultural Sciences
Vol.4 No.5(2013), Article ID:32102,6 pages DOI:10.4236/as.2013.45034
Efficiency of RAPD in assessing genetic variation in commercially viable local varieties of blueberry (Vaccinium)
![]()
1Instituto de Química, Laboratorio de Química-Biológica Pontificia, Avda, Universidad Católica de Valparaíso, Facultad de Ciencias, Valparaíso, Chile; *Corresponding Author: escobarj@ucv.cl
2Universidad Andrés Bello, Facultad de Medicina, Center for Integrative Medicine and Innovative Science, Santiago, Chile
3Centro para el Desarrollo de la Nanociencia y la Nanotecnología, Avda, Libertador Bernardo O’Higgins, Estación Central, Santiago, Chile
4Departamento de Biología, Avda, Libertador Bernardo O’Higgins, Facultad de Química y Biología, Estación Central, Universidad de Santiago de Chile, Santiago, Chile
Copyright © 2013 Christian Mandiola Quililongo et al. This is an open access article distributed under the Creative Commons Attribution License, which permits unrestricted use, distribution, and reproduction in any medium, provided the original work is properly cited.
Received 19 March 2013; revised 25 April 2013; accepted 17 May 2013
Keywords: Blueberry; RAPD; Genetic Variation; Molecular Marker
ABSTRACT
The growth in both production and plantation surface area of blueberries in Chile has been positive, with an estimated surface area of 13,057 hectares (16.9% planting surface) and production in the order of 56,000 tons (16.3% mundial production). Of all the different species of blueberry there are several varieties that have advantages with regard to certain conditions; for example, one variety adapts better to the climate of a particular area, while others are better for early or late harvests, they can also be resistant to fungus, bacteria, etc. Companies are very interested in this issue because prior knowledge of such data can bring financial benefits. Blueberries have a significant degree of morphological variation, which enables recognition of different clones with different environmental adaptation characteristics, but it also allows us to discriminate between different levels of fruit quality, which is of commercial interest. However, these morphological characteristics are late in their expression, making it impossible to recognize the clones in the early stage of their development. A more efficient tool to be able to recognize different clones is the use of molecular markers. Of the techniques based the RAPD (randomly amplified polymorphic DNA). They have the advantage that the method has no need for prior knowledge of the DNA sequence. It is of great interest to the private sector to have prior access to information on the types of clone they possess, in order to then be able to differentiate the varieties, but for this it is necessary to obtain a quick and economical technique. In this study, through the use of RAPD-PCR, it is possible to differentiate between different varieties of Vaccinium grown in Chile in order to then optimize blueberry production in terms of time and resources.
1. INTRODUCTION
Blueberries are members of the Ericaceace or Heath family, genus Vaccinium, subgenus Cyanococcus. Genus Vaccinium consists of blueberries, cranberries, lingoberries and many related wild species. The genus is very diverse, containing about 400 species, mostly found in the tropics at high elecation, but also in temperature and boreal regions [1].
In Chile, blueberry plantations are found from the 4th to the 10th regions. The species that are grown are: Vaccinium corymbosum (highbush blueberry), Vaccinium ashei (rabbit-eye blueberry) and Vaccinium macrocarpon (cranberry). National production is basically focused on the international fresh produce market, which has increased in recent years thanks to free trade agreements. The growth in both production and plantation surface area of blueberries in Chile has been positive, with an estimated surface area of 13,057 hectares (16.9% planting surface) and production in the order of 56,000 tons (16.3% mundial production) [2]. The price paid for the blueberries fluctuates according to the month of export, reaching values of US$ 25 - 35/Kg. The maximum price is achieved due to the location of Chile in the southern hemisphere, which means greater productivity during the October-February period (the spring-summer seasons), a period during which production in the northern hemisphere is at a minimum, as it is the fall-winter season. Of all the different species of blueberry there are several varieties that have advantages with regard to certain conditions; for example, one variety adapts better to the climate of a particular area, while others are better for early or late harvests, they can also be resistant to fungus, bacteria, etc. Companies are very interested in this issue because prior knowledge of such data can bring financial benefits [3].
Phenotypic plasticity in plants is considered an evolutionary and environmental adaptation strategy [4,5]. In this idea, the clone of a species is seen on two recognizeable levels of organization: “genets” and “ramets” [6,7]. Evolutionary somatic mutation and genetic variation occur on the level of genes, and studies at this level have provided information on population dynamics (on a genetic level) and have enable monitoring of the evolution of differences generations of clones [8].
The identification of different clones of the same species (such as Vaccinium) has mainly been performed through evaluation of [6,9]. Blueberries have a signifycant degree of morphological variation, which enables recognition of different clones with different environmental adaptation characteristics [10], but it also allows us to discriminate between different levels of fruit quality, which is of commercial interest. However, these morphological characteristics are late in their expression, making it impossible to recognize the clones in the early stage of their development. A more efficient tool to be able to recognize different clones is the use of molecular markers [6,11], examples of which are those based on isoenzymes and DNA. Of the techniques based on DNA, the most notable are AFLP (amplified fragment length polymorphism) [12,13] RFLP (restriction fragment length polymorphism), SSRs (simple sequence repeats) [14], microsatellites and RAPD (randomly amplified polymorphic DNA) [13,15]. The advantage of the latter methodology is that there is no need for prior knowledge of the DNA sequence [16].
It is of great interest to the private sector to have prior access to information on the types of clone they possess, in order to then be able to differentiate the varieties, but for this it is necessary to obtain a quick and economical technique. In this study, through the use of RAPD-PCR, it is possible to differentiate between different varieties of Vaccinium grown in Chile in order to then optimize blueberry production in terms of time and resources.
2. MATERIALS AND METHODS
Varieties of Vaccinium were obtained from the company, HORTIFRUT. The samples were new leaves of the V. corymbosum varieties Misty (V1), Michigan (V2), Elliot (V3 and V6), Bluecrop (V4), Duke (V5), and two unknown varieties (V7 and V8).
DNA Analysis
Total genomic DNA was extracted from the new leaves (approx. 20 days) using the CTAB method [17]. For each 25 mg of leaf, the following was added: 1 ml of 2× CTAB buffer, 1% PVP and 1:1000 2-b-mercaptoethanol, and this was then left to soak for 2 minutes at 4˚C. The soaked leaves were then incubated for half an hour at 65˚C to completely separate the DNA from the nuclear proteins. During incubation the mixture was carefully stirred by inversion every five minutes. The separation of the genomic DNA from the rest of the cellular components was done by extraction with an organic solvent, for which a quantity of chloroform/isoamyl alcohol (24/1) was added and then mixed by inversion at room temperature. Final separation was achieved by centrifugation are 10,000 rpm at room temperature for 10 minutes.
After centrifugation there were two phases; to minimize sugar co-precipitation the aqueous phase was supplemented with a solution of 5% CTAB in a proportion of 1:10 and this was carefully mixed by inversion. Then 2/3 of the quantity of isopropyl alcohol was added and again mixed by inversion, followed by incubation at room temperature for one hour. This was then centrifuged at 7000 rpm. Finally, the precipitate was re-suspended in an adequate amount of TE buffer solution. In order to avoid contamination with RNA, RNase A was added at a concentration of 730 U/ml with 2 l of the sample. Reaction conditions were set at 37˚C for one hour. Once the reaction was completed the samples were stored at −20˚C.
In order to amplify the genomic DNA using RAPD, synthetic markers or primers were used (oligonucleotides of around 10 bp, Table 1). PCR was carried out in a total volume of 50 ml. The reaction mixture was 47 ml MIX (5 ml 10× amplification dampening solution, 8 ml of a mix of deoxynucleotides 1.25 mmol each, 0.5 ml Taq polymerase DNA 5 U/ml and 33.5 ml water), 2 ml of divider at
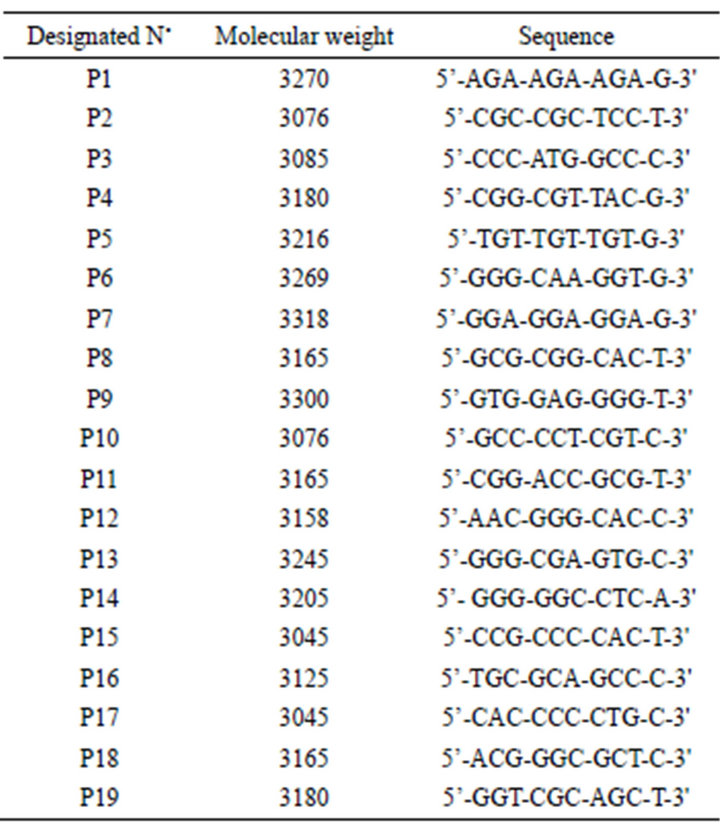
Table 1. List of characteristics of the chosen primers.
10 pmol/ml, and 1 l genomic DNA at 54 ng/ml. This procedure was performed at 4˚C. This was followed by complete denaturation of the DNA for 4 minutes at 94˚C, then 45 cycles for 1 minute at 94˚C, 1 minute at 36˚C and 2 minutes at 72˚C, and ending with synthesis for 4 minutes at 72˚C.
The PCR products from the study of all primers were visualized on a BIO RAD Gel Doc 1000 and the images were then analyzed with the computer program Gel-Pro AnalyzerTM version 3.0.
3. RESULTS AND DISCUSSION
RAPD Analysis. Once the quality of the DNA obtained from the 8 varieties of blueberry had been verified, we considered 19 random primers GIBCO®-LifeTechnologies (Table 1), from which it was possible to choose 4 (P1; P5; P10 and P16) which gave individual responses on at least one of the studied varieties (Figure 1, other data not shown).
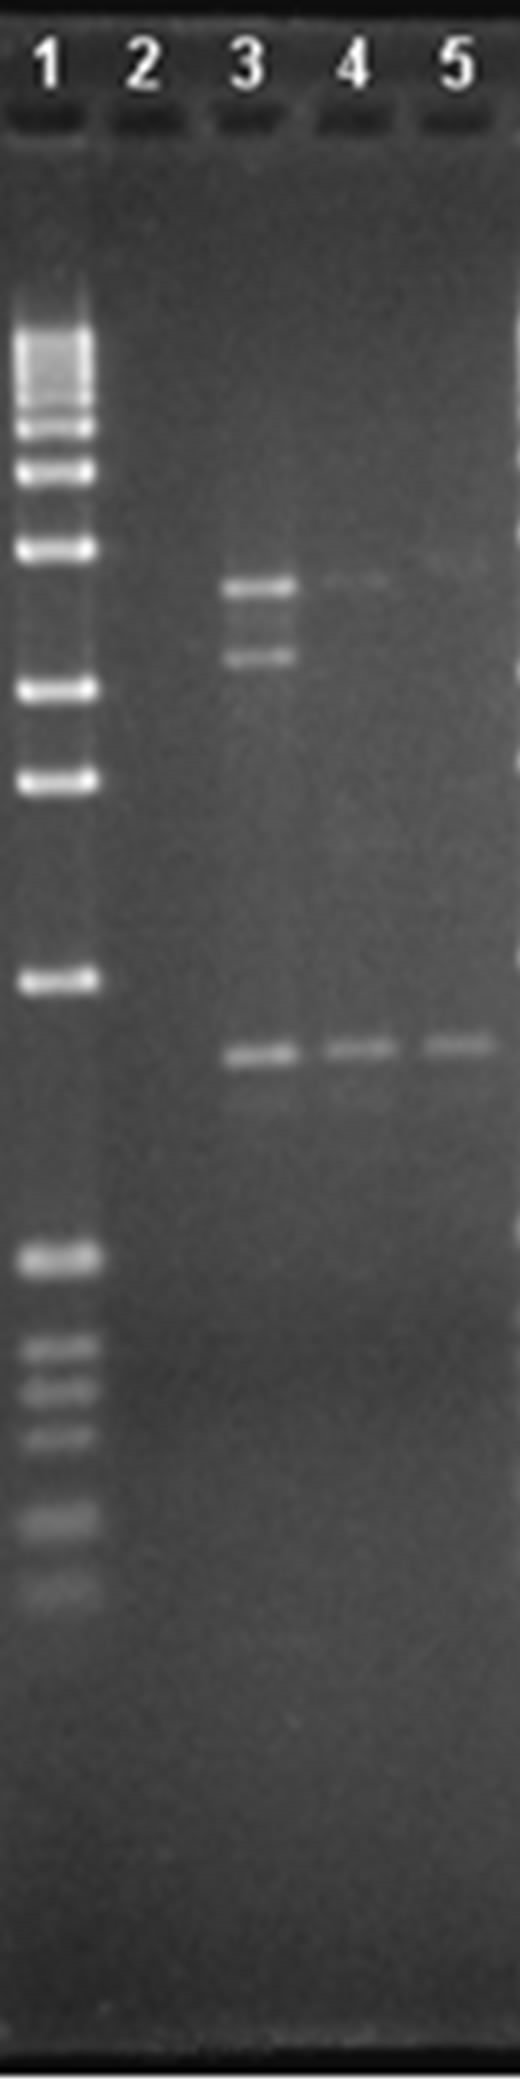
In the case of P1 (Figure 1(a)), a band can be seen in lane 3, around 2183 pb, which does not appear in lane 4 or lane 5, which thus differentiates V1 from V2 and V3.
 (a)
(a)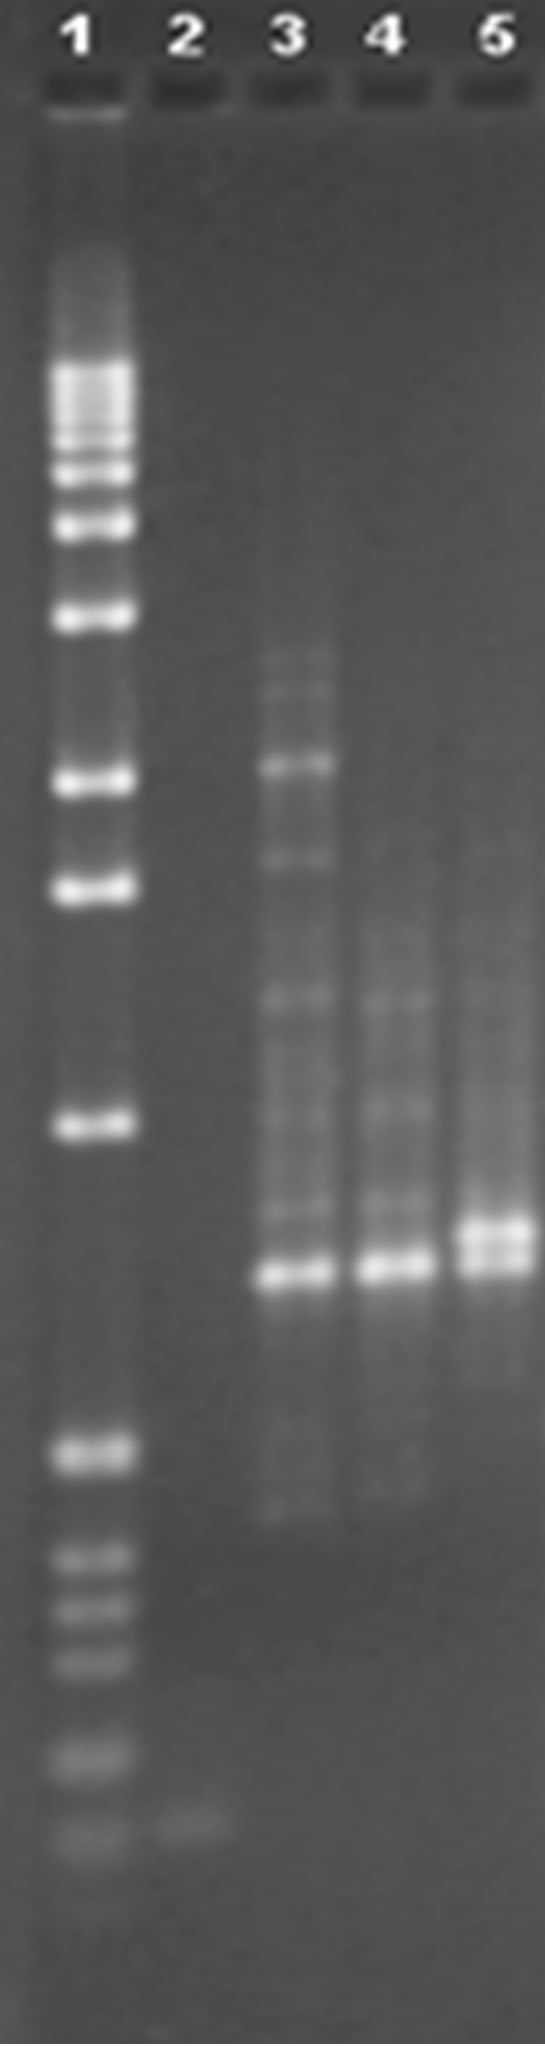 (b)
(b)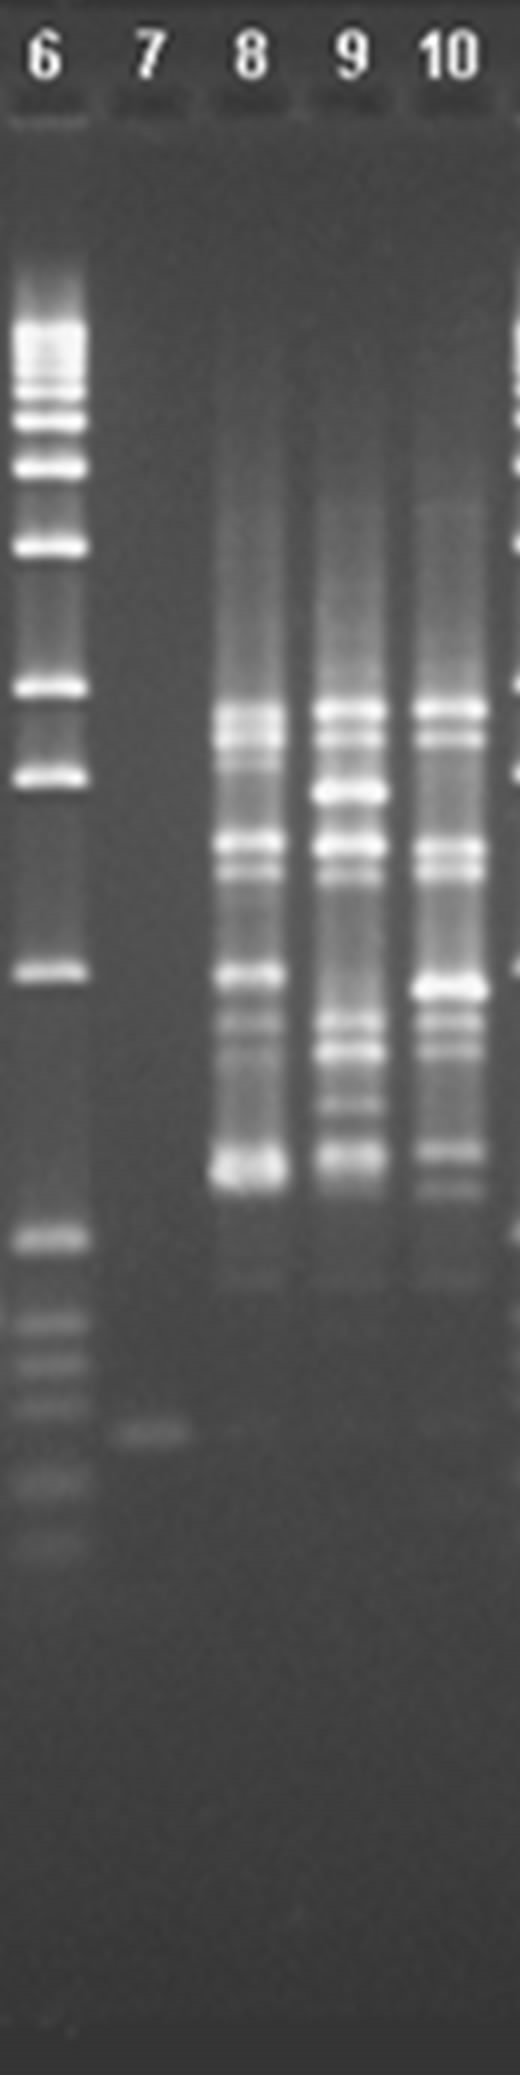 (c)
(c)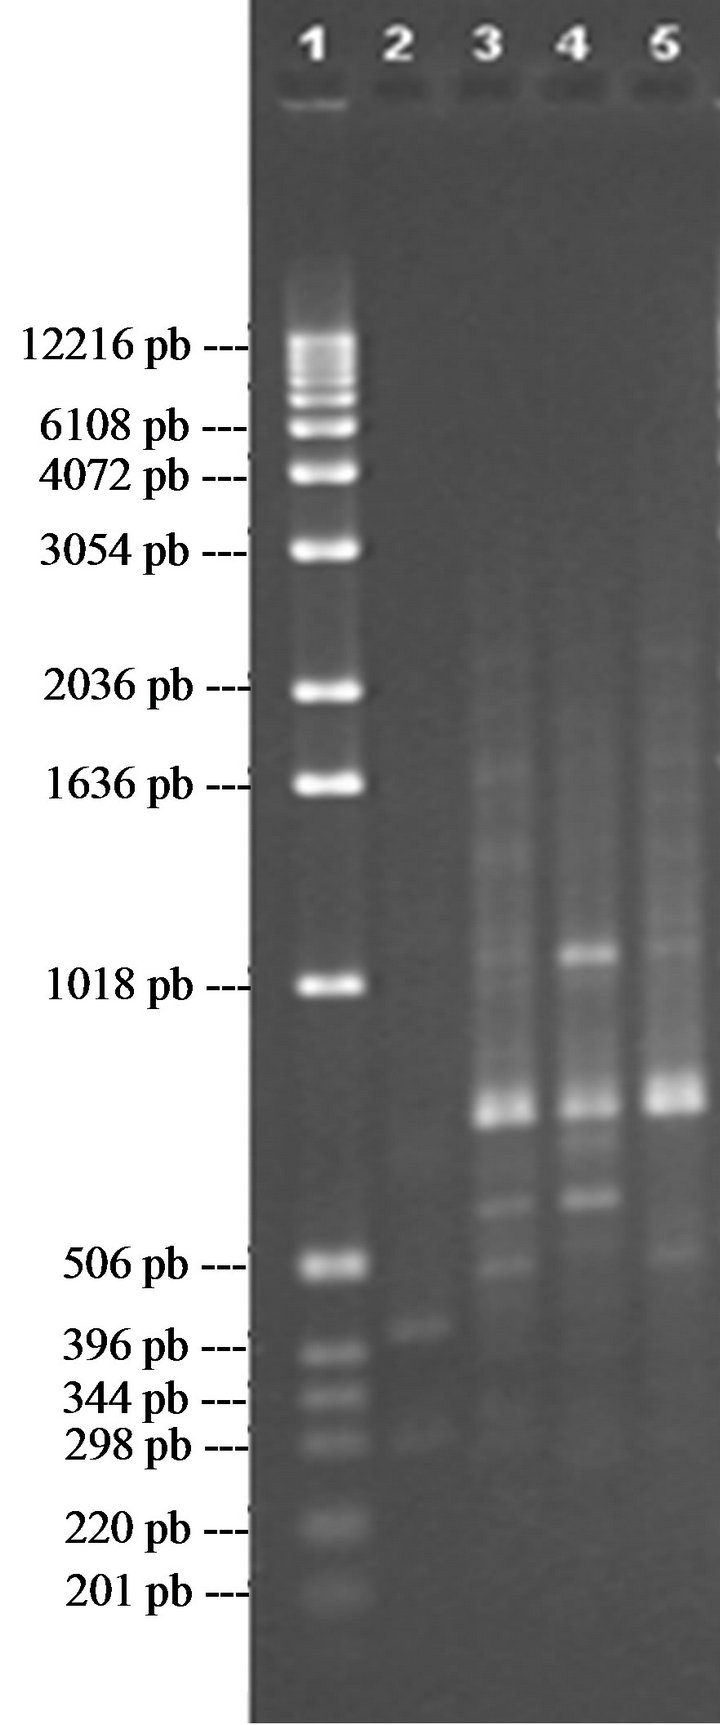 (d)
(d)
Figure 1. (a) 1.3% agarose gel with DNA amplification of blueberry varieties V1, V2 and V3 using primer P1, lane 1 1 kb marker, lane 2 control with primer only, lane 3 with amplification of variety V1, lane 4 with amplification of variety V2 and lane 5 with amplification of variety V3; (b) 1.3% agarose gel, with DNA amplification of blueberry varieties V1, V2 and V3 using primer P5, lane 1 1 kb marker, lane 2 control with primer only, lane 3 with amplification of variety V1, lane 4 with amplification of variety V2 and lane 5 with amplification of variety V3; (c) 1.3% agarose gel with DNA amplification of blueberry varieties V1, V2 and V3 using primer P10, lane 1 1 kb marker, lane 2 control with primer only, lane 3 with amplification of variety V1, lane 4 with amplification of variety V2 and lane 5 with amplification of variety V3; (d) 1.3% agarose gel with DNA amplification of blueberry varieties V1, V2 and V3 using primer P16, lane 6 1 kb marker, lane 7 control with primer only, lane 8 with amplification of variety V1, lane 9 with amplification of variety V2 and lane 10 with amplification of variety V3.
In lane 4 there is an amplified fragment of some 2693 pb, which is repeated in lane 3 but not in lane 5, this then differentiates variety V2 from V3. In the case of lane 5 there is a band approximately 2763 pb in size which is not present in lane 3 or lane 4; this would allow identifycation of variety V3.
For the case of primer 5 (Figure 1(b)), there is a series of bands in lane 3 of 2711; 2435; 2060; 1699; 527; 475 and 431 pb that are not seen in lane 4 or in lane 5, which would differentiate variety V1 from V2 and V3. In lane 4 there is a band of approx. 829 pb in size, which is not in lane 5 but is in lane 3; this differentiates variety V2 from V3, but not from V1 (with this fragment). Finally, in lane 5, we can see a band, of around 763 pb, that is not in lanes 3 and 4, meaning we can differentiate V3 from V2 and V1.
In the case of primer P10 (Figure 1(c)), three bands can be seen in lane 8, approx. 1691, 1006 and 604 pb in size, and which are not present in lanes 9 or 10, allowing differentiation of variety V1 from V2 and V3. In lane 9 there are three fragments approximately 1584, 713 and 626 pb in size which are not in lanes 8 and 10, allowing differentiation of variety V2 from V1 and V3. In lane 10, there are three bands, around 971, 634 and 570 pb which cannot be seen in lanes 8 and 9, thus differentiating V3 from V1 and V2.
Finally, for the case of primer P16 (Figure 1(d)), a fragment of 632 pb can be seen in lane 3 and not in lanes 4 and 5, differentiating variety V1 from V2 and V3. In lane 4 there are two bands of 658 and 500 pb, which are not present in lane 3 or in lane 5, via which we can differentiate variety V2 from V1 and V3. In lane 5 there is a band of 517 pb which differentiates V3 from V1 and V2.
Once the primers had been selected using the aforementioned criteria, we proceeded to use them on the eight varieties of blueberry in the study. Figure 2 shows a 1.0% agarose gel, in which the varieties were compared via amplification of primer P1.
Three bands can be seen in lane 4 in the P1 profiles, of around 2926, 1688 and 1476 pb, and a band that is not at 800 pb that is found in all the other lanes, thus differentiating V4 from V1, V2, V3, V5, V6, V7 and V8. As for lane 5, there is a band of around 644 pb which does not appear in this lane but which is visible in all the others, thus differentiating V1 from V2, V3, V4, V5, V6, V7 and V8. In lane 6 there is one band, of around 1291 pb, that is not in any other lane, thus differentiating V2 from V1, V3, V4, V5, V6, V7 and V8. In lane 7 there are two bands, of around 313 and 2241 pb, that are not in any other lanes, thus differentiating V5 from V1, V2, V3, V4, V6, V7 and V8. In lanes 10 and 11 the same band pattern can be seen, there is a band at around 2745 pb that is not visible in any other lane, thus differentiating V3 and V6
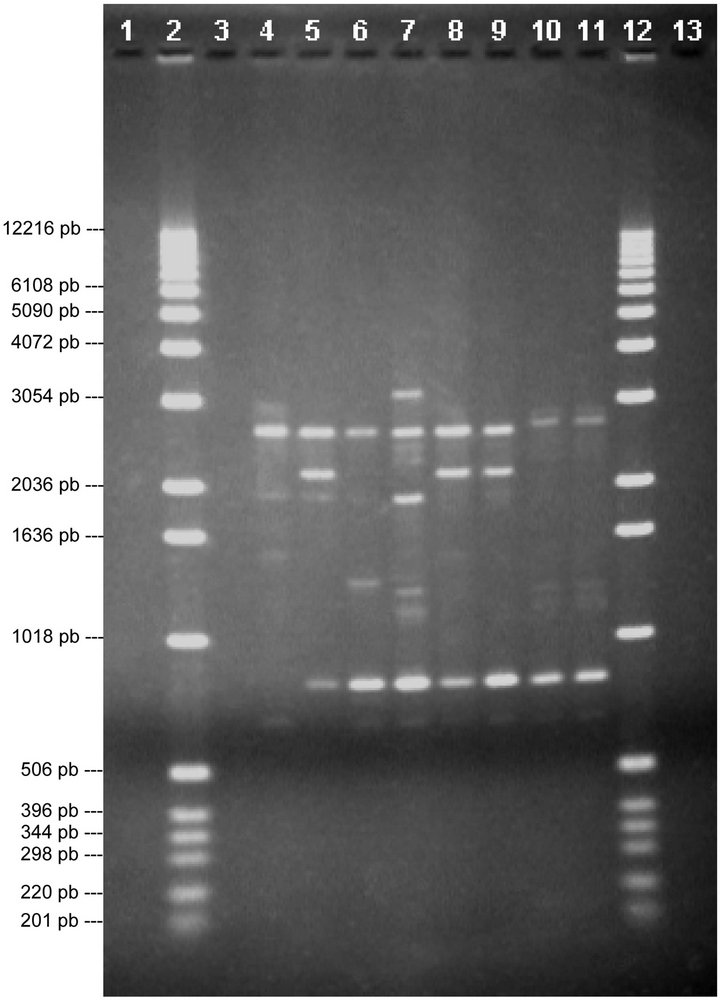
Figure 2. Analysis of chosen primers with all solutions of genomic DNA. Tests were performed with the four chosen primers using the solutions of genomic DNA (V1, V2, V3, V4, V5, V6, V7 and V8), the above are images obtained from electrophoresis with the respective analysis data. 1.0% agarose gel showing the band patterns of the DNAg V1, V2, V3, V4, V5, V6, V7 and V8 with primer 1.
from V1, V2, V4, V5, V7 and V8. Therefore, using this primer we can differentiate the varieties Misty (V1), Michigan (V2), Bluecrop (V4), Duke (V5) and Elliot (V3 and V6), but it is not possible to separate varieties V7 and V8.
When using primer P5 and comparing the 8 varieties (Figure 3), it can be seen that there is a band in lane 6, of around 1724 pb, that is not seen in the other lanes, thus differentiating V2 from V1, V3, V4, V5, V6, V7 and V8. In lane 8 there is a band of around 1680 pb that is not seen in the other lanes, thus differentiating V7 from V1, V2, V3, V4, V5, V6 and V8. Thus, with this primer it is only possible to differentiate between Michigan (V2) and V7.
The profiles from primer P10 are shown in Figure 4. In lane 4 a band of around 1786 pb can been seen that is not in any other lane, thus differentiating V4 from V1, V2, V3, V5, V6, V7 and V8. In lanes 10 and 11 there are two bands, around 1966 and 227 pb, that are not seen in the other lanes, thus differentiating V3 and V6 from V1,
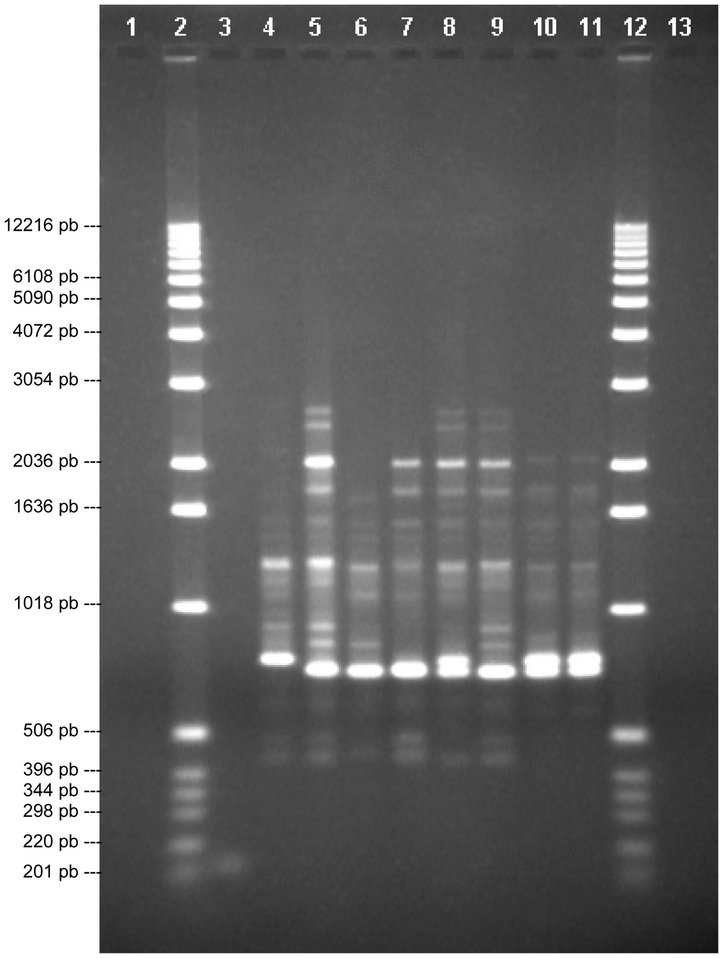
Figure 3. Analysis of chosen primers with all solutions of genomic DNA. Tests were performed with the four chosen primers using the solutions of genomic DNA (V1, V2, V3, V4, V5, V6, V7 and V8), the above are images obtained from electrophoresis with the respective analysis data. 1.0% agarose gel showing the band patterns of the DNAg V1, V2, V3, V4, V5, V6, V7 and V8 with primer 5.
V2, V4, V5, V7 and V8. Thus, with this divider it is only possible to differentiate Bluecrop (V4) from Elliot (V3 and V6).
Finally, with primer P16 (Figure 5) we can see a band on lane 7, of around 879 pb, that is not found in any other lane and a band that is not in this lane and is in all the others, around 2125 pb, thus differentiating V5 from V1, V2, V3, V4, V6, V7 and V8. In lane 8 there is a band, around 758 pb, that is not seen in the other lanes, thus differentiating V7 from V1, V2, V3, V4, V5, V6 and V8. Hence, this divider differentiates between Duke (V5) and V7.
Based on two extracts of DNAg (V3 and V6) from the same variety (Elliot) it can be seen that they followed the same band profile with all four of the chosen primers (P1, P5, P10 and P16).
The varieties that could not be determined are V7 and V8, of which V7 could be differentiated from the rest, meaning that it is a variety that is different from the other six mentioned above. Variety V8, on the other hand, could not be differentiated from all other varieties using
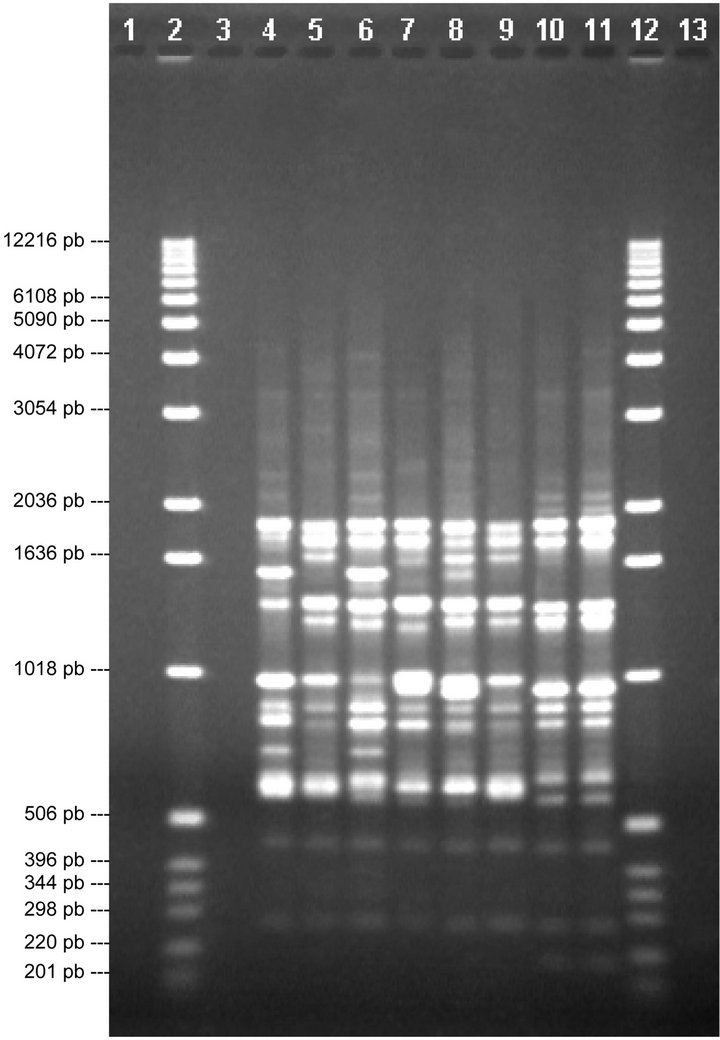
Figure 4. Analysis of chosen primers with all solutions of genomic DNA. Tests were performed with the four chosen primers using the solutions of genomic DNA (V1, V2, V3, V4, V5, V6, V7 and V8), the above are images obtained from electrophoresis with the respective analysis data. 1.0% agarose gel showing the band patterns of the DNAg V1, V2, V3, V4, V5, V6, V7 and V8 with primer 10.
the chosen primers, but there were very similar patterns with between V8 and V1 (Misty). Comparing these it can be seen that the band patterns of V1 with primers 10 and 16 are exactly the same as those of V8 with the same primers. With primer 5, V1 also has the same pattern as V8 with this primer, though the latter has lower band intensity. The only difference found was with the pattern given by primer 1: with V8 a band can be seen in the profile of around 644 pb that is not seen in the pattern given with V1. This may mean that V8 is a sub-variety of V1.
4. CONCLUSION
With the results, it can be conclude that it is possible to establish banding patterns, obtained by RAP-Marker technique, to determine the varieties of blueberry Vaccinium corimbosum (nursery commercial interests). It’s of great interest to the productive sector: a quick and economical access to information of clones, to optimiz-
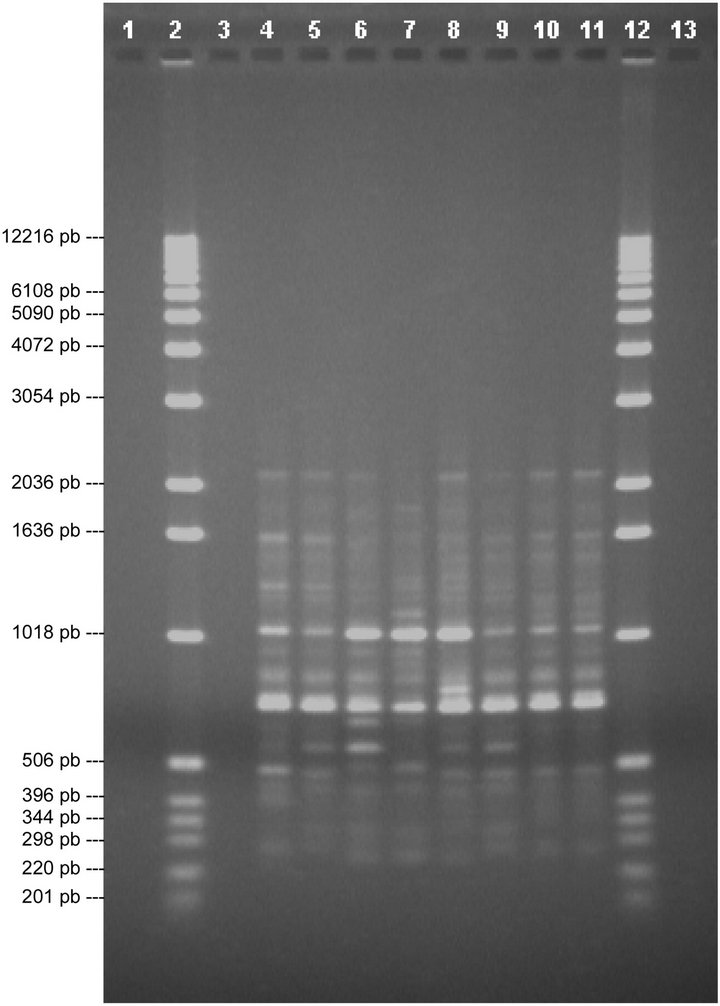
Figure 5. Analysis of chosen primers with all solutions of genomic DNA. Tests were performed with the four chosen primers using the solutions of genomic DNA (V1, V2, V3, V4, V5, V6, V7 and V8), the above are images obtained from electrophoresis with the respective analysis data. 1.0% agarose gel showing the band patterns of the DNAg V1, V2, V3, V4, V5, V6, V7 and V8 with primer 16.
ing the production and profitability of the sector.
REFERENCES
- Ratnaparkhe, M.B. (2007) Fruits and nuts. Genome Mapping and Molecular Breeding in Plants, 4, 217. doi:10.1007/978-3-540-34533-6_10
- Bravo, J. (2012) Mercado de arándanos, sin nubarrones en el horizonte. http://www.chilealimentos.com/medios/Servicios/noticiero/EstudioMercadoCoyuntura_2012/Congelados/mercado_arandanos_Odepa.pdf
- Urrutia, G. (2000) Arándanos: Un mercado en expansión. Programa gestión Agropecuaria, Fundación Chile.
- Bradshaw, A.D. (1965) Evolutionary significance of phenotypic plasticity in plants. Advanced Generation, 13, 115-155.
- Stewart, C.N. and Nilsen, E.T. (1995) Phenotypic plasticity and genetic variation of Vaccinium macrocarpon, the American cranberry. II. Reaction norms and spatial clonal patterns in two marginal populations. International Journal of Plant Sciences, 156, 698-708. doi:10.1086/297292
- Persson, H.A. and Gustavsson, B. A. (2001) The extent of clonality and genetic diversity in lingonberry (Vaccinium vitis-idaea L.) revealed by RAPDs and leaf-shape analysis. Molecular Ecology, 10, 1385-1397. doi:10.1046/j.1365-294X.2001.01280.x
- Scrosati, R. (2002) An updated definition of genet aplicable to clonal seaweeds bryophytes, and vascular plant. Basic and Applied Ecology, 3, 97-99. doi:10.1078/1439-1791-00106
- Eriksson, O. (1992) Evolution of seed dispersal and recruitment in clonal plants. Oikos, 63, 439-448. doi:10.2307/3544970
- Garkava-Gustavsson, L., Persson, H.A., Nybom, H., Rumpunen, K., Gustavsson, A. and Bartish, I.V. (2005) RAPD-based analysis of genetic diversity and selection of lingonberry (Vaccinium vitis-idaea L.) material for ex situ conservation. Genetic Resources and Crop Evolution, 52, 723-735. doi:10.1007/s10722-003-6123-4
- Hjalmarsson, I. and Ortiz, R. (1998) Effect of Genotype and enviroment on vegetative and reproductive characteristics of Lingonberry (Vaccinium vitis-idaea L.). Acta Agric. Scan. Sect. and Plant Sci. 48, 255-262.
- Kabelka, E.A. and Kristen, K. (2010) Identification of molecular markers associated with resistance to squash silver leaf disorder in summer squash (Cucurbita pepo). Euphytica, 173, 49-54. doi:10.1007/s10681-009-0105-3
- Emshwiller, E. (2000) Ploidy levels among species in th “Oxalis tuberose Alliance” as inferred by flow cytometry. Annals of Botany, 89, 741-753.
- Karp, A., Kresovich, S., Bhat, K.V., Ayad, W.G. and Hodgkin, T. (1997) Molecular tools in plant genetic resources conservation: a guide to the technologies. http://www.ipgri.cgiar.org/publications/pdf/138.pdf
- Kellogg, E. and Bennetzen, J.L. (2004) The evolution of nuclear genome structure in seed plant. American Journal of Botany, 91, 1709-1725. doi:10.3732/ajb.91.10.1709
- Fischer, M., Husi, R., Prati, D., Peintinger, M., van Kleunen, M. and Schmid, B. (2000) RAPD variation among and within small and large populations of the rare clonal plant Ranunculus reptans (RANUNCULACEAE). American Journal of Botany, 87, 1128-1137. doi:10.2307/2656649
- Manfield, I.W., Pavlov, V.K., LI, J., Cook, H.E., Hummel, F. and Gilmartin, P.M. (2005) Molecular characterization of DNA sequences from the Primula vulgaris S-locus. Journal of Experimental Botany, 56, 1177-1188. doi:10.1093/jxb/eri110
- Saghai-Maroof, K., Soliman, M., Jorgensen, R.A. and Allard, R.W. (1984) Ribosomal DNA spacer-length polymorphisms in barley: Mendelian inhertance, chromosomal location, and population dynamics. Proceedings of the National Academy of Science of the United States of America, 81, 8014-8018.