Agricultural Sciences
Vol. 3 No. 8 (2012) , Article ID: 25516 , 12 pages DOI:10.4236/as.2012.38122
Impact of climate change on agriculture during winter season over Pakistan
![]()
1Director, National Agromet Center, Pakistan Meteorological Department, Islamabad, Pakistan; *Corresponding Author: malikkm@hotmail.com
2Director General, Pakistan Meteorological Department, Islamabad, Pakistan
3Meteorologist, National Agromet Center, Pakistan Meteorological Department, Islamabad, Pakistan
4Director, Pakistan Meteorological Department, Islamabad, Pakistan
Received 19 September 2012; revised 21 October 2012; accepted 6 November 2012
Keywords: Cloud Burst; Seasonal Temperature; Moisture Transport; Shift in Precipitation
ABSTRACT
This study has been carried out to investigate the impact of climate change over Pakistan and its surrounding areas (60˚ - 80˚ E and 20˚ - 40˚ N) during winter seasons (December-February). Variability in three meteorological parameters such as: rainfall; air temperature; and moisture transport, has been investigated. Global Precipitation Climatology Center (GPCC) data for precipitation and National Centre for Environmental Prediction (NCEP) reanalysis data for computation of Moisture Flux Convergence (MFC) and temperature have been used for the period of 49 years (1961 to 2009). The study period has been divided into three phases on basis of precipitation anomaly i.e., before climate change scenario (1961-1985), transition period (1986- 1999) and after climate change scenario (2000- 2009).Variability in precipitation has been observed in three different ways such as, slightly increase in magnitudes, decrease in rainy days and shifting of precipitation pattern towards south of the country. Moisture transport from the surrounding has decreased with increase in precipitation which is indirectly associated with decreases in mass deposit on the glaciers. Increase in temperature is more prominent over upper and lower part as compared to the central parts of the country. Uncertainty in precipitation has also been observed. Shift of precipitation over southern parts showed positive impact over agriculture sector. As a result, Rabi crop yield has increased during last decade over southern parts of the country.
1. INTRODUCTION
Agriculture has always been the most important sector of Pakistan’s economy. In the agro climatic classification of Pakistan, more than two-third of Pakistan lies in semiarid to arid zones [1]. About 70% of our population is living in rural areas, where most of them along with livelihood depend on agriculture production. Approximately 50% of the total national labor force is directly engaged in agriculture [2]. Therefore, majority of the people living in arid and semi-arid areas are totally depending on agro-pastoral activities for their survival. Currently in climate change scenario Pakistan-like other developing world, is faced with the challenges of (being affected by variability of precipitation and risen temperatures) land degradation or desertification and other environmental problems like soil erosion, loss of soil fertility, flash floods, salinity, deforestation and associated loss of biodiversity and carbon sequestration [3]. Agriculture is the most vulnerable sector to climate change. Productivity of agriculture is being affected by a number of climatic factors and some indirect factors including rainfall pattern, temperature hike, changes in sowing and harvesting dates, water availability, evapo-transpiration and land suitability. All these elements have impact on crop yield and agricultural productivity [4].
Agriculture in Pakistan is dependent on rainfall as well as irrigation water. Water mainly meets from seasonal rainfall as well as melting of snow and ice from the glaciers. Pakistan has developed the world’s largest contiguous canal irrigation system. Pakistan is covered on the north by Himalaya, Karakoram and Hindukush, which host the world’s third largest snow/ice reserves. These mountains are the water tanks over the roof that provides water to the reservoirs. The environment has given the operational control of this tank in terms of temperature after the strong buildup of greenhouse gases [5].
Winter brings lot of snow over the northern mountains which melts in early summer and maintains the sustainable river flows for power generation and irrigation before the onset of the summer monsoon. In addition to solid precipitation over hilly areas, winter rain bearing systems yield substantial rainfall in sub-mountainous and low elevation plains including arid plains of Balochistan. Generally northern half gets about five times more precipitation in winter than the southern half [6]. Past analysis of precipitation data has shown a slightly decreasing trend for the northern parts of the country. On the other hand the situation for southern parts of the country is becoming better in terms of precipitation and temperature as well. But the northern belt is the major source of water to the Indus, the leading river in the country. The present increase in temperature may be major augmenting force behind the sharp decrease in this treasure of solid water. For a country which is already facing problems because of ill management in water distribution and inadequate water reservoirs, it could lead to the collapse of the local agriculture system in the time to come [6]. Higher rainfall variance seems to be the main factor behind dry-land yield fluctuations. Amount and distribution of Rainfall during crop season are important. Distribution of rainfall becomes more significant for the lands with low water holding capability and also in the seasons with adequate soil moisture available at planting [7].
Increasing temperatures may have a positive impact on agriculture in the mountain areas, for instance, through shortening of growing period for the winter season crops. Winter crops (e.g. wheat), in the high mountain areas, do not even reach to maturity in most cases and such crop is harvested premature to be used as fodder. The shortening of the growing season length due to rising temperature could be beneficial in the mountain areas as it would help the winter crops in timely maturity and as such would allow the crop to mature in the optimal period of time, with beneficial effects on crop area and yields [8].
There is high level of confidence that recent regional changes (rising tendency) in temperature have discernable impacts on precipitation, evaporation, stream flow, runoff and other elements of hydrological cycles [9]. Under increased Green House Gasses (GHG) concentrations, global climate models also exhibit enhanced intensity and shorter return periods of extreme events [10,11]. Recorded extreme events during the last decade of 20th century depict consistency in terms of intensity and frequency. The history’s worst drought with extremely high air temperatures and without snow cover during winter 2001, history’s worst flash floods in July 23, 2001 in Rawalpindi/Islamabad because of Cloud burst, are the few sound evidences of increased intensity of extreme events [12].
2. DATA AND METHODOLOGY
The basic water equation for the column is given as:
 (1)
(1)
Here E represents evapotranspiration, P is precipitation,  is the horizontal divergence operator and W is vertically integrated water content per unit area given by:
 (2)
(2)
Whereas, Q is the vertically integrated moisture flux given by
 (3)
(3)
Whereas q is the specific humidity in kg/kg, dp is change in pressure, ps is surface pressure, pt is pressure at top of an atmospheric column taken to be at 300 hPa where q becomes negligible, g is the acceleration due to gravity, 9.8 m/s2, and V is the horizontal wind vector defined as:
 (4)
(4)
Here u and v are the eastward and northward wind components respectively. Bold variables indicate vector representation.
The National Center for Environmental Prediction and National Center for Atmospheric Research (NECPNCAR) pressure level data were obtained at 6 hours intervals, 00, 06, 12 and 18 Z. Four atmospheric variables such as the specific humidity q, zonal wind u, the meridional wind v and the surface pressure Ps are used for this study. All the variables except surface pressure are located on a 144 × 73 horizontal grid with a resolution of 2.5 degrees of latitude and longitude, and at 8 levels in the vertical, 1000, 925, 850, 700, 600, 500, 400, 300 hPa. Above 300 hPa, the air is very dry and contributes little to water vapor transport. Surface pressure is also available on 144 × 73 horizontal grids.
The vertically integrated Moisture Flux Convergence (MFC) into the region was calculated by using Green’s Divergence Theorem.
 (5)
(5)
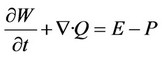
where n is the unit outward normal vector on the domain boundaries and l is the length of the line segment along the boundary. For domain average MFC, the right side is an integral performed around the entire domain. Evaluating the right hand side of Eq.5 around the chosen boundary, then dividing by the area of the entire domain will give average convergence rate of the domain. The boundary chosen is very coarse with a grid spacing 2.5˚ × 2.5˚. The total land area of the domain used in this study is 3.14 × 10¹² m2. Vertically integrated MFC from surface to 300 hPa for individual grid boxes (2.5˚ × 2.5˚) have also been computed and used for examining the spatial distribution of MFC. (Figure 1)
Vertical integration around the region becomes difficult due to complex terrain and uneven surface, as surface pressure does not necessarily correspond to 1000 hPa, the lowest level pressure available in the data sets. Since some points having 1000 hPa were underground while others were in the atmosphere, qV values were linearly interpolated or extrapolated as required. The Global Precipitation Climatologically Centre (GPCC) version 5 data with grid point at 0.5˚ resolution of latitude and longitude for precipitation and NCEP reanalysis data for geo-potential height at different levels and zonal wind at 200 hPa have been used in the study. Precipitation and temperature anomalies have been computed from long term (1901-2009) GPCC precipitation average and (1949- 2009) NCEP temperature data respectively. All the analysis has been made on the winter season starting from December (of previous year) to February (of current year). This implies that precipitation of 1962 consist of average precipitation of December, 1961 to February, 1962. All the calculation monthly as well as seasonal was made on monthly basis. The calculation has been made by using the software developed by the International Research Institute, University of Columbia, which is available on line at:
http://iridl.ldeo.columbia.edu
3. THE STUDY PERIOD (1961-2009)
The causes of climate change in any region can be linked with variability of moisture in atmospheric and precipitation on surface. Both these factors are closely associated with variation of air temperature in the region. Figure 2 depicted anomaly of precipitation in the domain during study period. Precipitation anomalies can easily be distributed in the three phases such as: 1) No radical change during the period 1961-1985 named as before climate change scenario, no prominent variability in precipitation is observed during this phase except for few years; 2) The period 1986-1999, during which a large variation of precipitation is observed in the domain, it is assumed that this period is considered as transition period. This period is considered as rapid climate pattern change scenario in view of surface pressure and air temperatures of Atlantic and Pacific Oceans; and 3) Drastic increase in precipitation is observed during 2000-2009 after climate change scenario. In this phase it is observed that precipitation in the region has drastically increased with increase in the possibility of uncertainty of weather conditions. The study is based on the variation of different meteorological parameters during these different phases and it has been tried to investigate causes of these variations in precipitation. The cause of this drastic increase in precipitation in the region has been framed by com-
Figure 1. Boundary line in the map represents the area used for computing MFC in this study. Grids interval = 2.5˚ × 2.5˚ (longitude × latitude).
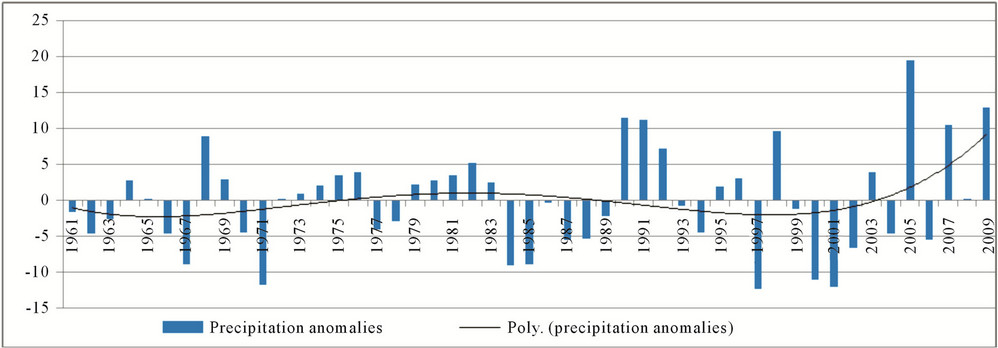
Figure 2. Anomalies of precipitation in the region during 1961-2009. Polynomial trend line represents with black steady line.
paring different meteorological parameters during these different three phases.
4. ANALYSIS OF DIFFERENT METEOROLOGICAL PARAMETERS
4.1. Moisture Flux Convergence (MFC)
Average seasonal (Dec-Feb) and five year running average MFC over entire domain has been computed and depicted in Figure 3. Highest moisture transported seasons were 1997-1998 and 1972-1973 with the values of 19.69 cm and 19.41 cm per month respectively. The least MFC seasons were 1999-2000 and 1996-1997 with 10.39 and 10.69 cm/month. Moisture flux convergence seasonal (Dec-Feb) time series fluctuate between 10.39 to 19.69 cm/month with an average value of 14.56 cm/ month. Highest value of five years MFC has been computed during late seventy’s and least was found in late ninety’s. However, decreasing trend in five year average MFC is prominent from early ninety’s. Figure 4 depicted monthly and seasonal (Dec-Feb) MFC of three different periods. During the season, February is considered as highest moisture transported month whereas during December it has the least values. Comparison showed that moisture transported decreased throught out the season as well as in corresponding months during the period of 2000-2009. Five year running average MFC of entire domain showed decreasing trend from early nineties. This corresponds that moisture transport into the domain is decreasing.
In December, moisture transported has decreased during after climate change scenario, and it has remained highest during transition period. In January, moisture transported during transition and before climate change scenario is almost same whereas during after climate change scenario it decreased. In February, moisture transported during before climate change scenario is highest while during after climate change scenario it became decreased. In seasonal comparison (Dec-Feb), moisture transported has been decreased after climate change scenario with 1 cm/month. In transition period (1986- 1999), average moisture transported in December is highest as compared to before and after climate change scenario because of too much variation in moisture transport during this period.
Figure 6 depicted spatial distribution of moisture flux convergence of entire domain. Positive values indicate moisture convergence and negative values indicates moisture divergence region. The moisture divergence regions referred as source of moisture and moisture convergence region referred as sink of moisture. There are two main source of moisture for Pakistan; one is from the south i.e. Arabian Sea during both periods and other from the west. The source of moisture indicates the track of approaching weather systems in the region. There are two moisture convergence regions in both before and after climate change scenarios, one is over extreme north extending towards south east up to Kashmir and other is over central Afghanistan extended towards east crossing from Central Pakistan and Western Punjab of India. Both periods showed almost same regions of moisture transport. This indicates that no remarkable variation in the region of moisture sink/source has been observed during the study period. However, slightly decrease in moisture transported region over Central Afghanistan and Central Pakistan has also been observed during after climate change period. Figure 6 depicted MFC anomalies along with three different, most variability values during before climate change scenario (A), transition period (B), and after climate change scenario(C). It is observed that most of the values lie in (A) from 1.75 to –2.0 cm, in (B) from 3.39 to –2.3 cm and in (C) from 0 to –2 cm. It is clear evidence that during after climate change scenario, the frequency of more transposed moisture is increased with reduced moisture transported in the entire domain. The average moisture transported is 0.78 cm/month which is about 0.81 cm/month is higher than before climate
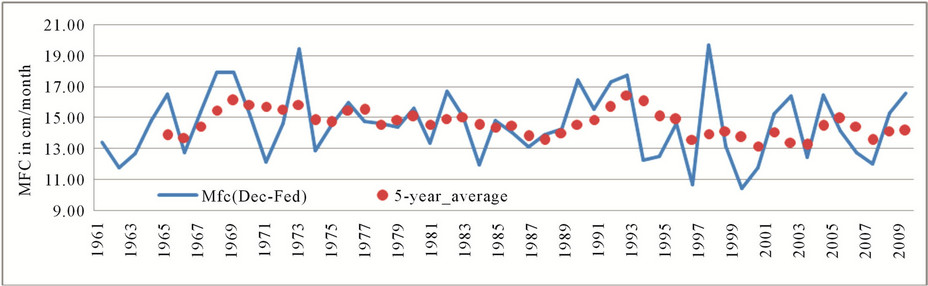
Figure 3. Seasonal (Dec-Feb) MFC (in line) and five year running average seasonal MFC (in red dots).
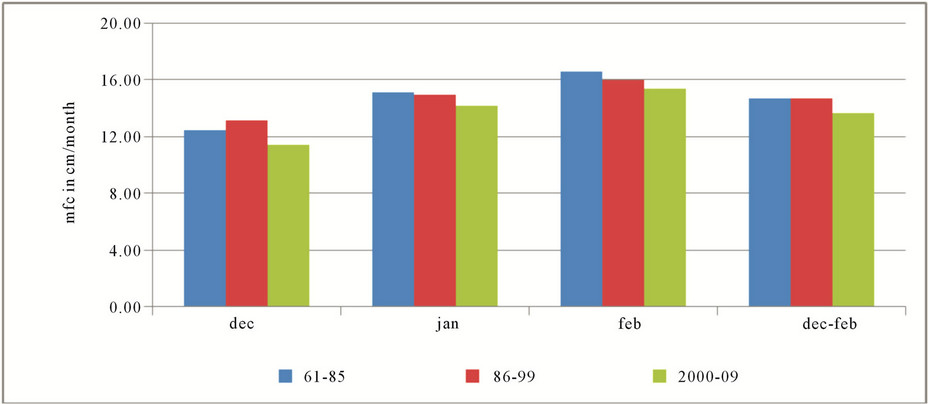
Figure 4. Comparison of Monthly and seasonal (December-February) MFC of three periods, before climate change scenario 1961-1985 (in blue), transition scenario 1986-1999 (in red) and after climate change scenario 2000-2009 (in green).
 (a)(1961-85)
 (b)(2000-09)
Figure 5. Spatial distribution of seasonal average MFC (December-February) for the period of (a) before climate change scenario (1961-1985) and (b) after climate change scenario (2000-2009) in cm.
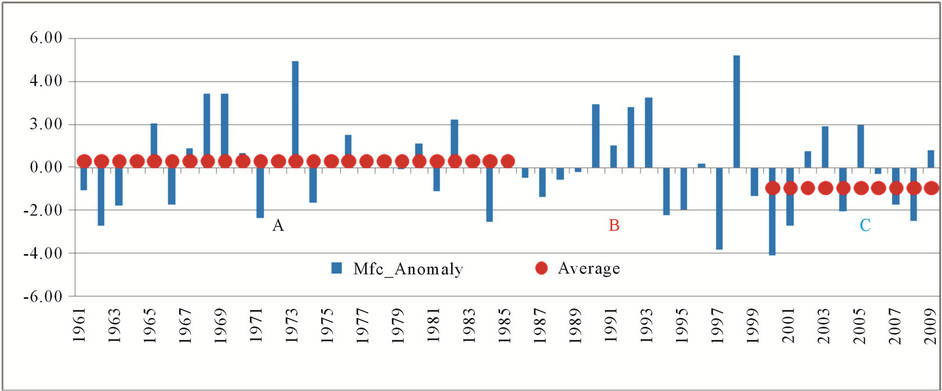
Figure 6. MFC anomalies time series (bars) and their different period averages; A) before climate change (1961-1985), B) transition period (1986-1999) and C) after climate change (2000-2009).
change scenario. The transition period showed more fluctuation in MFC anomalies is evidence that climate is going to set new reference values.
4.2. Surface Temperature
Figures 7(a)-(d) depicted monthly and seasonal temperature anomalies (departure from average 1901-2009). In December, air temperature increased all over the country except central parts of Baluchistan extended from east to west. Maximum decrease in temperature was observed at Sibi and Kalat divisions, whereas, the highest increase in temperature has been observed over western and extreme northern Baluchistan, extreme north eastern Punjab and extreme eastern Khyber Pakhtoonkhawa. Increase in temperature over central parts of the country is not so high and is less than 1˚C from long term average.
Figure 7(b) depicted January air temperature anomalies over the country. During January highest average temperature increase (more than 2˚C) is observed over northern regions along with the glaciers. Temperature has decreased over central parts of the country with maximum over Sibi, Kalat and southern Khyber Pakhtoonkhawa (KP). Overall temperature during January has been increased though out the country. Figure 7(c), depicted temperature anomalies for the month of February during 2000-2009 from long term average. Temperature increasing trend has been observed over northern areas and eastern Baluchistan with east-west extension.
By comparing changes in average seasonal (Dec-Feb) air temperature (Figures 8(a)-(b)), it is clearly evident that temperature of whole domain has increased. The shift of 0˚C contour line is nominal and in both scenarios it is situated almost over same areas. Further, it is interesting to note that this shift of corresponding contour lines of same values, on both positive and negative sides is more prominent as moving away from reference 0˚C contour. This implies that less (higher) values temperature contour lines shifted less (higher) during the period 2000-2009 as compared to the period 1961-1985, i.e. shift or rise in temperature is more prominent over south and north of the domain. In Sindh, temperature has increased roughly 2˚C over upper and lower parts. In Baluchistan, corresponding temperature contour has shifted towards north i.e. contour of 4˚C which was over Quetta region during 1961-1985 periods, has shifted to north at about 100 km and crossing over the Afghanistan region during 2000-2009 period. The contour crossing over boundary of Sindh and Punjab province has shifted at about 200 km and now crossing over Bahawalpur and adjoining areas of lower Punjab. In Punjab (2000-2009), increase in temperature is more prominent over the extreme central east and central west areas, whereas it is least over northern regions of the province as it approached towards reference of 0˚C contour line. The shifting of corresponding contour from before and after climate change scenario is roughly less than 50 km.
4.3. Precipitation
Figure 9 depicted monthly (a)-(c) and seasonal precipitation anomalies (d) of the region. The comparison of monthly precipitation anomalies showed mixed trend during all the months from December to January in the region. In December, precipitation has increased over Baluchistan, Sindh, central and lower Punjab, whereas decreasing trend is observed over KP, Kashmir and upper Punjab. Maximum increase is more than 10 mm/month over upper Sindh and adjoining areas of Baluchistan. The Lower Punjab, Southern Baluchistan and Central Sindh showed increase in the range of 5 - 10 mm/month. In
 (a)
(a)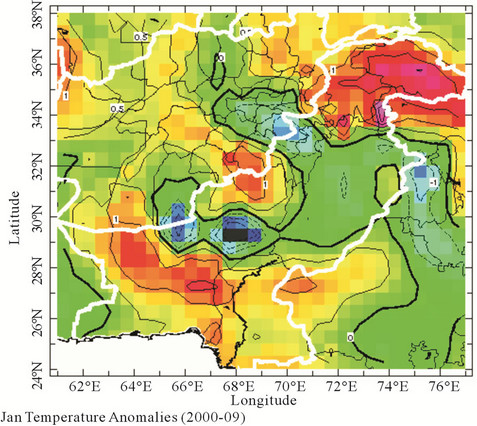 (b)
(b) (c)
(c) (d)
(d)
Figure 7. Monthly and seasonal air temperature anomalies for the period (2000-2009) after climate change scenario, (a) For December; (b) For January; (c) For February and (d) December-February along with anomalies legend.
January decreasing trend is observed over Baluchistan and lower Sindh, while increasing trend in rest of the Pakistan. Highest increase is observed over upper KP with east west extension. Another highest positive anomaly is prominent over the Himalaya Ranges extending toward south. Some parts of Upper Punjab showed 5 - 10 mm/month increase in precipitation. Increase in precipitation over rest parts of Punjab is not remarkable. In February increasing trend is prominent all over the country except some southern parts of Baluchistan. The highest increase is observed over upper KP with two extensions, one from east to west and other is towards south.
On average no change in precipitation is observed over Sindh during February. The KP, most parts of Punjab and some north western region of Baluchistan showed more than 10 mm/month increase in precipitation.
In comparison of over all season variation shown in Figure 9(d), it is observed that all over the country precipitation has increased with highest values over KP and northern regions extending towards south till southern Punjab and then further extending towards Western Baluchistan. The coastal belt showed least increase in precipitation.
Figures 10(a)-(b) depicted spatial distribution of ave-
 (a)
(a)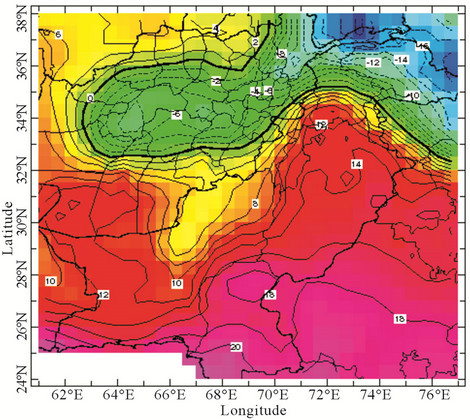 (b)
(b)
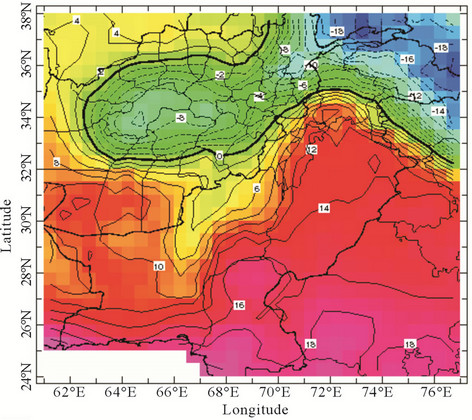
Figure 8. Spatial distribution of average seasonal (December-February) temperature for (a) before climate change scenario (1961-1985); and (b) post climate change scenario (2000-2009). C represents legend of (a) and (b).
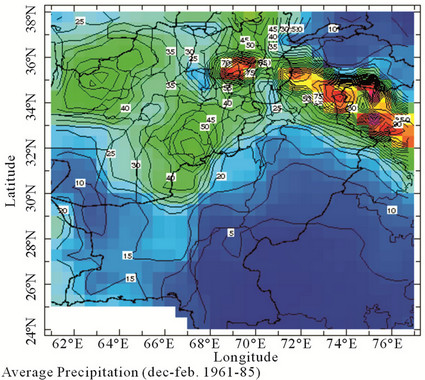
rage precipitation during 1961-1985 and 2000-2009. Comparison of average precipitation of before and after climate change scenarios showed that the areas receiving chief amount of precipitation are the same. However, it is noticed that precipitation contours of same corresponding values have shifted towards south. This shift is more prominent from Central Punjab towards south. During 1961-1985 period, 10 mm/month contour moved northeast to southwest. It moved towards north from Central Punjab, towards south from Southern Punjab and then again towards north from Eastern Baluchistan. The same contour shifted towards south during after climate change scenarios (2000-2009) with its new location crossing over Southern Punjab and then moving across Sindh-Baluchistan boundary. Similarly, contour of 5 mm/month also shifted towards south during 2000-2009. The areas of same precipitation contour have also expanded over Afghanistan and western region of the domain. In addition, average precipitation has also increased over northern mountainous region of the country.
5. REASONS OF VARIATION IN PRECIPITATION
5.1. Geo-Potential Heights at 500 mb
In comparison of geo-potential heights at 500 mb, it is clearly evident that same corresponding contour has shifted towards south during after climate scenarios. Trough over northern Afghanistan during before climate change scenario has become more deep and shifted towards south during after climate change scenario. In addition same corresponding contour has shifted south as well. It indicates that the track of western disturbances has slightly shifted towards south causes shift of precipitation towards south.
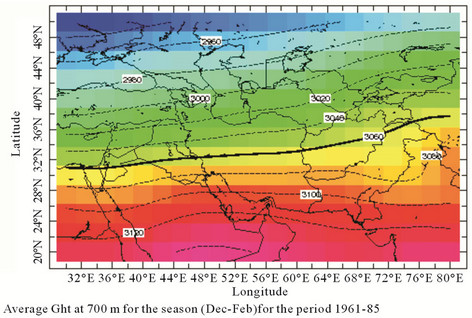
5.2. Geo-Potential Heights at 700 mb
Figure 12 depicted comparison of zonal winds at 700 mb of two periods (1961-1985) and (2000-2009). In comparison it is clearly evidence that trough become more deep during after climate change scenarios. Impact of climate change scenarios can easily be reflected during 2000-2009 period. A trough over Northern Afghanistan is prominent during after climate change scenarios. As a result, more precipitation has been observed over Afghanistan and its extension over Pakistan will be monitored as well. This may be one of the reason of shifting of precipitation towards south of Pakistan. Trough become more deepens due to persistence of followed ridge over Northern Iran.
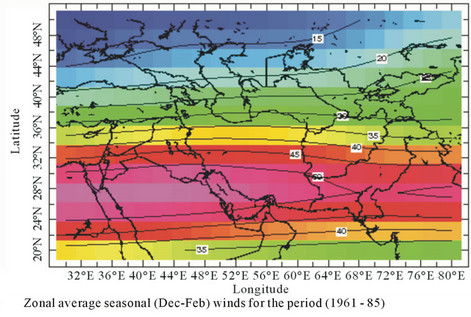
5.3. Zonal Winds
Comparison of winds anomalies at 200 mb during before and after climate change scenarios has been depicted in Figure 13. During before climate change scenarios, zonal winds showed decreased trend over Central Iran, Afghanistan and Upper Pakistan. However, during after climate change scenarios, zonal winds showed increasing trend over corresponding region. Strong winds at 200 mb
 (a)
(a)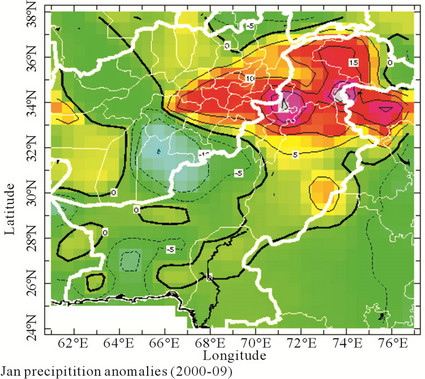 (b)
(b) (c)
(c) (d)
(d)
Figure 9. Monthly and seasonal departure of precipitation (mm/month) from normal, (a) for December; (b) for January, c) for February and d) for season December-February.
 (a)
(a) (b)
(b)
Figure 10. Average seasonal (December-February) precipitation (mm/month) during, (a) before climate change scenario (1961- 1985); and (b) after climate change scenario (2000-2009).
 (a)
(a)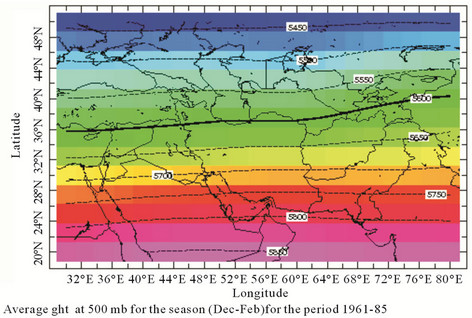 (b)
(b)
Figure 11. Average seasonal (December-February) geo-potential heights at 500 mb (in meters) during, (a) before climate change scenario (1961-1985); and (b) after climate change scenario (2000-2009).
 (a)
(a)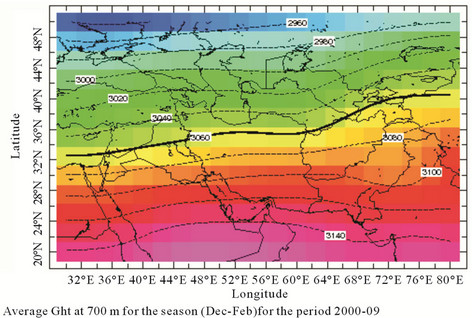 (b)
(b)
Figure 12. Average seasonal (December-February) geo-potential heights at 700 mb (in meters) during, (a) before climate change scenario (1961-1985); and (b) after climate change scenario (2000-2009).
 (a)
(a) (b)
(b)
Figure 13. Comparison of zonal average seasonal (December-February) winds anomalies (m/sec) of (a) before and (b) after climate change scenario.
may be associated with more precipitation and week winds are associated with less precipitation. The contour of zero change in wind speeds has already been shifted towards south during 2000-2009 period in comparison with 1961-1985 period, this indicates shift in precipitation towards south over Pakistan. Figures 14(a) and (b) depicted comparisons of seasonal average winds for both before and after climate change scenarios.
In comparison, four factors including speed, direction, convergence area of maximum winds, and position of zonal winds are very important. However, more precipitation is associated with high winds. Comparison showed that highest zonal winds at 200 mb has shifted towards west, as a result central parts of Pakistan showed strong winds, that might be one of the cause of increase in precipitation over that region. The channel of strong winds, which squeezed during before climate change scenarios over Pakistan region has become expanded.
6. IMPACTS OF CLIMATE CHANGE ON AGRICULTURE
The province of Sindh ranks second in wheat production. Most of the lands devoted to wheat cultivation in the Lower Indus Plains are located in the irrigated districts of Nawabshah, Hyderabad, Sukker, and Tharparkar Kharipur Districts. The time series of the annual wheat production in the province during the last decade is shown in the Figure 15, which clearly indicates a rising trend in the annual production during the last decade (2000-2001 to 2009-2010) [5]. No doubt, some other agronomy factors has also played important role for increase in yield production. However, at some extent we can correlate this increase in yield production with increase in precipitation into the region. The correlation between precipitation over Sindh and crop production is 0.67 with the confidence level of 95%. This indicates that timely precipitation in the region can increase the crop production in the region.
7. CONCLUSIONS
On the basis of variation in precipitation in the entire domain, whole study period has been divided into three categories i.e. before (1961-1985), transition (1986-1999) and after (2000-2009) climate change periods. Association of precipitation with moisture transported into the region has been investigated. It is found that moisture transported into the domain has been decreased with increase in precipitation during the season (December to February) after climate change. Moisture source region are same during both before and after climate change period whereas variation in the amount of water transported from the source region has been observed. February is considered as highest moisture transported month during the season.
Departure of after climate change period temperature from long term average (1901-2000) showed increasing trend with positive values over South and North Pakistan and decreasing trend with negative values over central parts of the country during all months (December to February). Increasing trend in temperature is more pro-
 (a)
(a)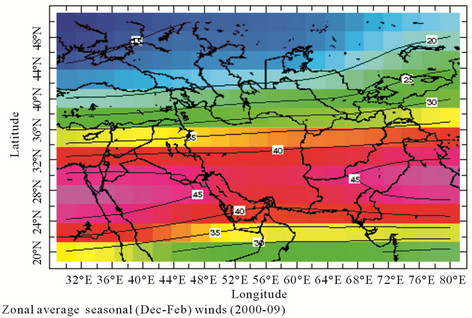 (b)
(b)
Figure 14. Comparison of zonal average seasonal (December-February) winds (m/sec) of (a) before and (b) after climate change scenario.
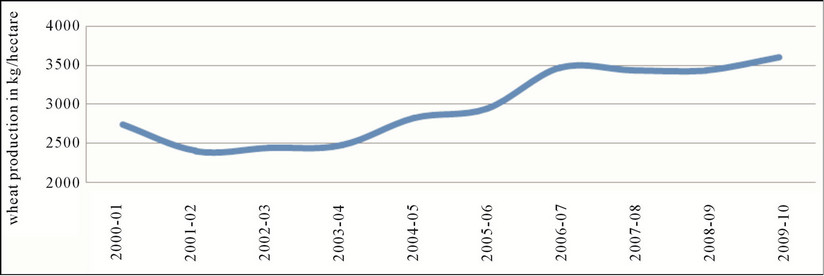
Figure 15. Time series of annual wheat production in Sindh during the last decade (2000-2001 to 2009-2010) in kg per hectare.
prominent over northern parts including glaciers. Increase in temperature caused increase in evaporation rate which increased specific humidity in the atmosphere. As a result, precipitation in the region increased without transport of moisture from surroundings. Therefore, increase in temperature is indirectly associated with increase in precipitation in these regions. This implies that as a whole mass deposited on the glacier in this region is going to decrease. Comparison in average seasonal temperature showed prominent increase in temperature over southern parts rather than northern parts of the Pakistan.
Monthly precipitation has increased (decreased) over southern Pakistan during December (January and February). However, increasing trend in seasonal precipitation is prominent over Northern and Central Pakistan. Precipitation over glacier showed increasing trend during January. Average seasonal precipitation showed increasing trend over glacier. In addition shift in average seasonal precipitation towards South Pakistan is also prominent which improved the requirement of water for agriculture land. This shift in precipitation over agriculture land is directly linked with increase in crop yields in the region. Increased in precipitation is associated with the variation in geo-potential heights at 500 - 700 mb. The variation in geo-potential height is directly linked with zonal winds at 200 mb. The zonal winds at 200 mb showed that region of maximum winds have been moved towards west, centered over central Pakistan after climate change scenario. This increase in precipitation over agriculture land has positive effect on it and crop yield has been increased after climate change scenarios.
REFERENCES
- Chaudhry, Q.Z. and Rasul, G. (2004) Agroclimatic classification of Pakistan. Science Vision, 9, 59.
- Dowswell, C. (1989) Wheat research and development in Pakistan. Pakistan Agriculture Research Council, Collaboration Program.
- Go, P. (2008) Economic survey of Pakistan (2007-08). Ministry of Finance, Government of Pakistan, Pakistan.
- Harry, M.K. and Thomas E.D. (1993) Agricultural dimensions of global climate change. St. Lucie Press, Delary Beach.
- Rasul, G., Dahe, Q. and Chaudhry, Q.Z. (2008) Global warming and melting glaciers along southern slopes of HKH ranges. Pakistan Journal of Meteorology, 5, 14 p.
- Kazmi, D.H. and Rasul, G. (2009) Early yield assessment of wheat on meteorological basis for Potohar region, Pakistan. Journal of Meteorology, 6, 73.
- Pratley, J. (2003) Principles of field crop production. Oxford University Press, Oxford.
- Hussain, S.S. and Mudasser, M. (2004) Prospects for wheat production under changing climate in mountain areas of Pakistan—An econometric analysis. Econpapers, 94, 494- 501.
- Elshamy, M.E., Wheater, H.S., Gedney, N. and Huntingford, C. (2006) Evaluation of the rainfall component of a weather generator for climate impact studies. Journal of Hydrology, 326, 1-24. doi:10.1016/j.jhydrol.2005.09.017
- Hennessy, K.J., Gregory, J.M. and Mitchell, J.F.B. (1997) Changes in daily precipitation under enhanced greenhouse conditions. Climate Dynamics, 13, 667-680. doi:10.1007/s003820050189
- Fowler, A.M. and Hennessy, K.J. (1995) Potential impacts of global warming on the frequency and magnitude of heavy precipitation. Natural Hazards, 11, 283-303. doi:10.1007/BF00613411
- Chaudhry, Q.Z., Sheikh, M.M., Bari, A. and Hayat, A. (2001) History’s worst drought conditions prevailed over Pakistan. http://www.pakmet.com.pk/journal/historyworstdrought2001report.htm