Low Carbon Economy
Vol. 3 No. 3A (2012) , Article ID: 25506 , 4 pages DOI:10.4236/lce.2012.323014
Analysis of Life-Cycle Energy Use and GHG Emissions of the Biomass-to-Ethanol Pathway of the Coskata Process under Chinese Conditions
![]()
1Institute of Energy, Environment and Economy, Tsinghua University, Beijing, China; 2China Automotive Energy Research Center, Tsinghua University, Beijing, China; 3Laboratory of Low Carbon Energy, Tsinghua University, Beijing, China.
Email: *ouxm@mail.tsinghua.edu.cn
Received October 21st, 2012; revised November 22nd, 2012; accepted December 3rd, 2012
Keywords: Life-Cycle Analysis; Biomass-to-Ethanol; Coskata Process
ABSTRACT
Life-cycle analyses of energy use and greenhouse gas (GHG) emissions were carried out for three scenarios of the Coskata biomass-to-ethanol (EtOH) process under Chinese conditions using the original Tsinghua China Automotive Energy LCA Model in conjunction with a module developed particularly for the Coskata process. The results show that 1) the Coskata pathway has good performance in terms of life-cycle fossil energy use and GHG emissions; 2) the electricity used in the biomass-to-EtOH process has the most significant effect on life-cycle fossil-energy use, natural gas as boiler fuel has the second-greatest effect, while fuel used in feedstock transportation has the third; and 3) different energy resources for boilers in the biomass-to-EtOH factory provide different life-cycle results: coal is the least favorable while biomass is the most favorable. We conclude that 1) the Coskata pathway has the dual merits of fossil energy-savings and lower GHG emissions compared with all other bio-EtOH pathways and conventional gasoline in China; and 2) shifting from coal as the fuel for factory boilers to biomass will strengthen the advantages.
1. Introduction
1.1. Ethanol for Transportation Fuel
Ethanol (EtOH) is used globally as a fuel and fuel additive and serves as an alternative to gasoline. Ethanol adoption has become widespread, as it is inexpensive to produce and can be produced in certain geographies using locally available feedstock such as corn and sugar cane. As the demand for ethanol continues to grow, it is believed that production will increasingly shift away from food-based feedstock to non-food-based resources [1]. For example, wood can be converted into ethanol while currently it provides an unattractive alternative to gasoline because of its high cost.
By the end of 2010, the use of fuel ethanol reached 1.86 million tons in China, with most of the ethanol being produced from grain. Government policy encourages the rational use of non-grain raw materials to produce fuel ethanol in the future: in the near-term, priority will be given to the production of fuel ethanol from non-grain feedstock, such as cassava, sweet potato, and sweet sorghum; in the long-term, cellulosic biomass-derived biofuels will be actively promoted. The potential of China’s energy crop resources depends on the acreage of available marginal land and the average production per unit area of land, but the total amount of liquid fuel obtained from crop resources in the future is expected to be 10% of total transportation fuel. Lignocellulosic energy crops will account for about 80% of liquid fuel produced from energy crops in the long term in China. Besides bio-chemical processes and thermal-chemical processes, more efficient energy conversion technology, such as bio-gasification-fermentation, has been explored internationally. This is leading-edge technology in the production of liquid biofuels. The preliminary research and evaluation results suggest good economic efficiency. Coskata, a USbased company, has established a bio-gasification-fermentation demonstration plant [2,3].
1.2. Biomass-to-Ethanol Conversion by Coskata
Coskata is a technology company that produces alternative fuels and chemicals. Their proprietary three-step process has been demonstrated at a significant scale and offers high yields, low costs and feedstock flexibility [4], as Figure 1 shows.
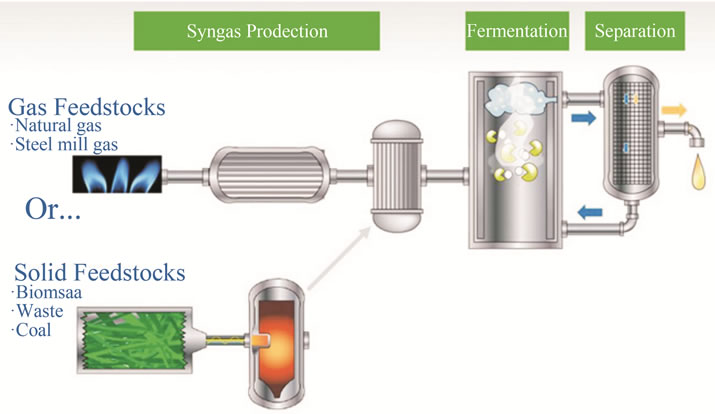
Figure 1. Overview of the Coskata process; (Source:http:// www.coskata. com/process/index.asp?source=7E352957-657F-44D4-8CEC-3FCA8BBB2 D7C).
Step 1: Syngas Production
In the first step, Coskata technology converts carboncontaining feedstock into synthesis gas, or syngas, which is a mixture of carbon monoxide, hydrogen, and carbon dioxide. The feedstock material is broken down into a syngas that Coskata can then convert into fuels or chemicals. For solid feedstock such as wood, Coskata technology produces syngas through gasification.
Step 2: Fermentation
After the syngas is cleaned and cooled, it is fed to Coskata’s innovative bioreactors where proprietary microorganisms convert the syngas into fuels and chemicals. Coskata’s microorganisms convert nearly all the chemical energy of the syngas into the desired end product.
Step 3: Separation
The third step of the Coskata process is product separation. This step uses commercially available distillation and dehydration technologies to efficiently separate the final product from the water stream exiting the bioreactor.
Although the agriculture of lignocellulosic energy crops is still in its infancy, the crops can be grown in a wide variety of regions and can be used in Coskata’s process, and they alleviate many agricultural concerns related to food-related biofuels.
1.3. Content of This Research
The life-cycle analysis (LCA) of energy use and greenhouse gas (GHG) emissions of the Coskata process under Chinese conditions has been developed using the original Tsinghua China automotive energy LCA model (TLCAM) along with a customized module developed principally for the process.
The paper is organized as follows. Section 2 describes the model, and Section 3 presents the data used in this work. Section 4 presents the results obtained and discussions, and Section 5 gives conclusions.
2. Model Description and System Boundary
2.1. Model Description
In this study, we use the well-to-wheels (WTW) analysis module of the TLCAM, which has been described in detail by Ou et al. (2009) [5] and Ou et al. (2010) [6].
Especially for this project, we developed a new module to assess the life-cycle energy and GHG emissions for the Coskata pathway to convert biomass into ethanol for transportation fuel use. With this module, we can input key assumptions and data into the model, which will then generate complete WTW final results including result summaries in the form of charts and graphs.
2.2. System Boundaries
The WTW energy consumption (EC) and GHG analysis considers the well-to-pump (WTP) and pump-to-wheels (PTW) stages. The WTP stage is the upstream production stage, including the exploitation of raw resources/feedstock plantation, feedstock transportation, fuel production, and fuel transportation, storage and distribution (TSD). The PTW stage relates to downstream fuel combustion in a vehicle engine. The WTW analysis has been used to clarify the EC and GHG impacts of conventional gasoline as well as several existing ethanol pathways, as described in Table 1 [7].
3. Key Data
3.1. Key Data on the Energy and Material Inputs/Outputs
For the energy use related to feedstock production/collection/transportation in our case, we have assumed the use of wood biomass feedstock to mirror Coskata’s previously planned US-based commercial facility, upon which the material and energy summary was based. The following specific assumptions for wood biomass are made.
1) The energy content in the feedstock (forest residuals are considered as the primary feedstock here) is 9.77 MJ/kg wet wood and this amount is included in the direct energy use calculation for the factory but is not included in the life cycle fossil energy use or related GHG emissions owing to this energy being from feedstock that is “renewable” and “carbon neutral”.
2) Owing to collection being primarily manual, the fossil energy use in collection is negligible and it is omitted in this report.
3) The average distance feedstock is transported to the factory is 100 km (Chai, 2008) [3], close to the current situation for biomass power plants. The vehicle efficiency assumed is 7.45 liters of diesel per 100 km per ton of wet wood transported [7].
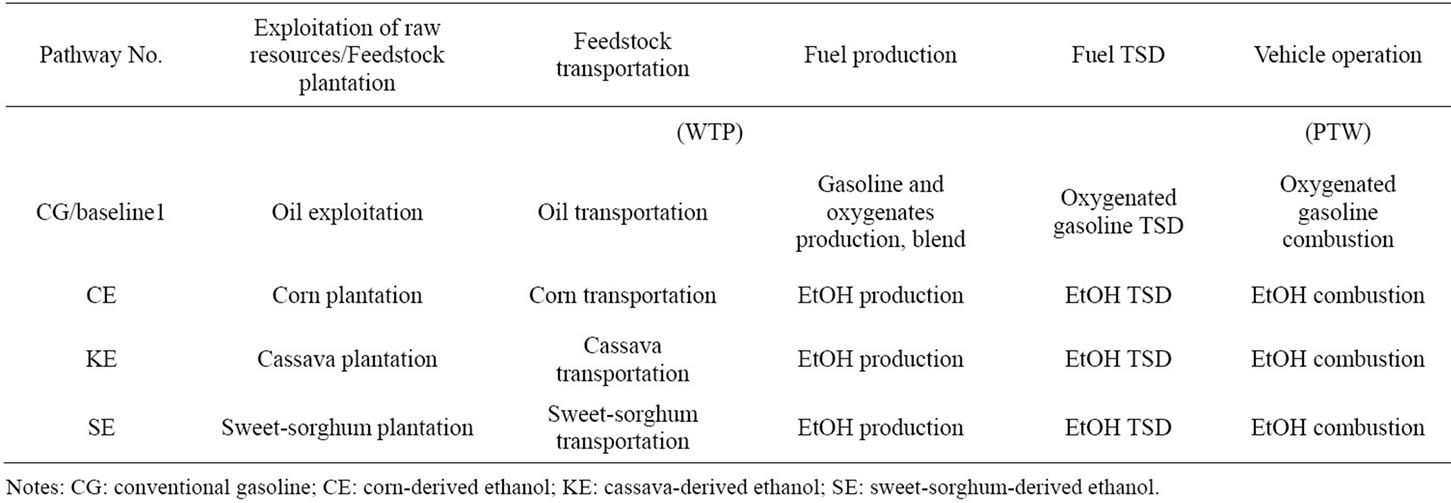
Table 1. Well-to-wheels research framework for biofuel pathways.
4) The average distance that EtOH is transported to vehicle service stations is 500 km [3], close to the current situation for the distribution of conventional gasoline in China. The vehicle efficiency assumed is twice that of the above situation for feedstock transportation: 3.725 liters of diesel per 100 km per ton of EtOH transported [7].
3.2. Key Data on Life Cycle Intensity
Ou and Zhang (2011) [7] analyzed the fossil energy and GHG emission intensities (as well as the upstream GHG intensities) of various secondary energy (SE) resources in China; the publicly available results are listed in Table 2. In this report, we use these data to convert direct energy use to life cycle results for the Coskata scenarios analyzed.
The fossil energy intensity (EFLC, MJ/MJ) and GHG emission intensity (GHGLC, g CO2,e/MJ) of a specific type of SE are defined as the sum of all the fossil energy and GHG emissions, respectively, during the entire life cycle for 1 MJ of the final fuel obtained and used. Table 2 shows the life cycle fossil energy and GHG emission intensities for the nine types of SE, ordered from lowest to highest in terms of energy intensity.
4. Results and Discussions
4.1. Results
Figures 2-4 show that the pathway of Coskata technology using natural gas (NG), coal or biomass for boiler fuel uses just 33% - 41% of the total energy and emits just 42% - 52% of the GHG emissions compared with the case for gasoline [5] over the life cycle from feedstock to EtOH distribution.
In China’s situation of a coal-dominated energy supply, coal energy is used not only for the major feedstock of N
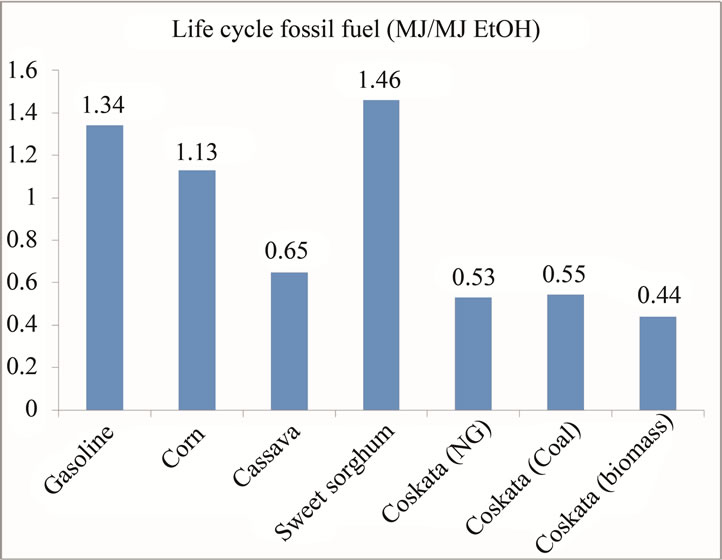
Figure 2. Life-cycle amounts of fossil fuel used for different EtOH pathways in China; Note: The terms in brackets refer to the use of NG, coal or biomass for boiler fuel.
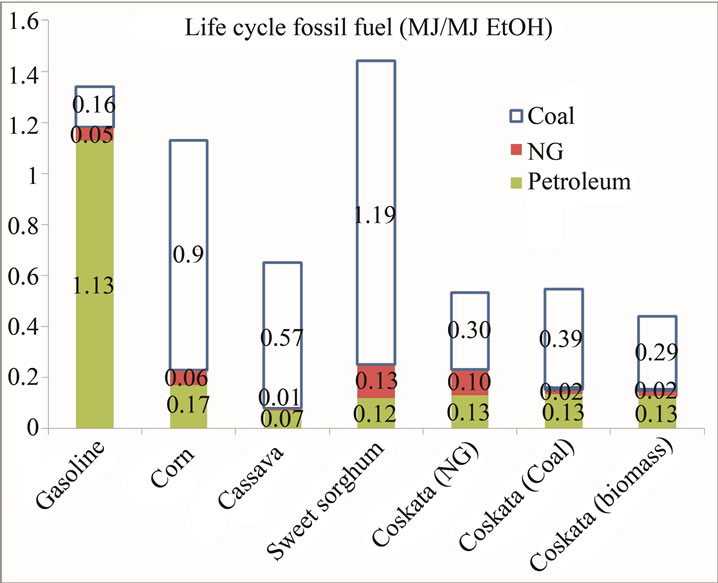
Figure 3. Life-cycle amounts of fossil fuel used for different EtOH pathways in China (by type); Note: The terms in brackets refer to the use of NG, coal or biomass for boiler fuel.

Table 2. Fossil energy intensity and GHG emission intensity results.
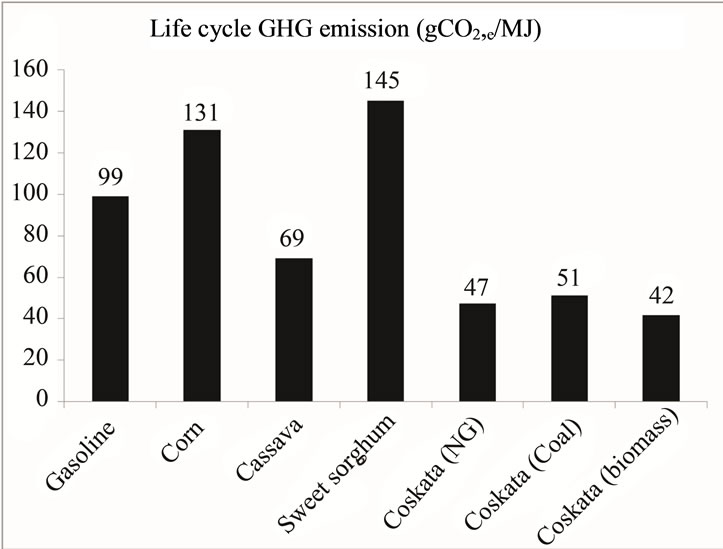
Figure 4. Life-cycle GHG emissions for different EtOH pathways in China; Note: The terms in brackets refer to the use of NG, coal or biomass for boiler fuel.
fertilizer which is needed for corn, cassava, and sweet sorghum production but also as the major fuel used for steam boilers and power supply during the processing stage of EtOH production.
The Coskata pathway has good performance in terms of lifecycle fossil-energy use and GHG emissions. Furthermore, different energy resources for boilers used in the factory affect the life cycle results; coal is the least favorable while biomass is the most favorable.
4.2. Break-Down Analysis
Break-down analysis of the Coskata process in the case that NG is used as boiler fuel shows that electricity dominates the life-cycle amount of fossil fuel used and GHG emissions, accounting for 58% of the total fossilfuel use and 32% of GHG emissions. The NG used as boiler fuel accounts for the second-highest amounts of fossil-fuel use and GHG emissions; fuel used in the transportation of feedstock accounts for the third greatest proportions; fuel used for EtOH distribution contributes approximately 10% of the total fossil-energy use.
We note that the quantity of natural gas needed for the Coskata pathway is based on the need to dry the incomeing wood biomass from a moisture content of ~50% to approximately 15% - 20%. For feedstock where no drying is needed (such as many types of agricultural residues), this natural gas requirement would be greatly reduced, and there would likely be excess recoverable energy suitable for use by a co-located steam user, or for electric power generation.
5. Concluding Remarks
The Coskata pathway has dual merits of energy savings and reduced GHG emissions compared with all other bio-EtOH pathways in China and gasoline. Shifting the fuel requirements for factory boilers from coal to biomass will strengthen the advantages of the Coskata pathway. The effects of feedstock transportation and EtOH distribution are important in determining the overall effect of the process on life-cycle energy use and GHG emissions.
6. Acknowledgements
The project is co-supported by the China National Natural Science Foundation (Grant No. 71041028, 71103109, 71203119 and 71073095), China National Social Science Foundation (09&ZD029), MOE Project of Key Research Institute of Humanities and Social Sciences at Universities in China (2009JJD790029) and the CAERC program (Tsinghua/GM/SAIC-China). The authors would like to thank Coskata, Inc. for their generous help.
REFERENCES
- Coskata Inc., “About Coskata,” 2012. http://www.coskata.com
- CAERC, “China Automotive Energy Outlook 2012,” Scientific Press, Beijing, 2012.
- Q. Chai, “Biofuel Industry Development in China,” Tsinghua University, Beijing, 2008.
- Coskata Inc., “Coskata Process Overview,” 2012. http://www.coskata.com/process/index.asp?source=7E352957-657F-44D4-8CEC-3FCA8BBB2D7C
- X. Ou, X. Zhang, S. Chang and Q. Fang, “Energy Consumption and GHG Emissions of Six Biofuel Pathways by LCA in (the) People’s Republic of China,” Applied Energy, Vol. 86, Supplement 1, 2009, pp. s197-s208. doi:10.1016/j.apenergy.2009.04.045
- X. Ou, S. Chang and X. Zhang, “Alternative Fuel Buses Currently in Use in China: Life-cycle Fossil Energy Use, GHG Emissions and Policy Recommendations,” Energy Policy, Vol. 38, No. 1, 2010, pp. 406-418. doi:10.1016/j.enpol.2009.09.031
- X. Ou and X. Zhang, “Life-Cycle Analysis of Automotive Energy Pathways in China,” Tsinghua University Press, Beijing, 2011.
NOTES
*Corresponding author.