International Journal of Geosciences
Vol.10 No.05(2019), Article ID:92653,23 pages
10.4236/ijg.2019.105034
A GIS-Based Geological Model for Assessing the Reserves of Phosphate in the Tozeur-Nefta Field, Southern Tunisia
Sarra Ouerghi1,2
1Department of Geography and GIS, Faculty of Arts & Humanities, King Abdulaziz University, Jeddah, Saudi Arabia
2Laboratoire 3E “Eau-Energie-Environnement” (LRAD-10-02), Ecole Nationale d’Ingénieurs de Sfax, Sfax, Tunisie
![]()
Copyright © 2019 by author(s) and Scientific Research Publishing Inc.
This work is licensed under the Creative Commons Attribution International License (CC BY 4.0).
http://creativecommons.org/licenses/by/4.0/


Received: February 26, 2019; Accepted: May 24, 2019; Published: May 27, 2019
ABSTRACT
The Gafsa phosphate basin is the most significant mining region in Tunisia with more than 8 million tons of natural phosphate extracted annually. Both the economic and industrial developments of Tunisia rely heavily on Phosphate deposit and this holds true as long as appropriate estimation of the reserves is undertaken. The aim of this study is to geostatistically explore the phosphate spatial distribution and geological reserve in the Tozeur-Nafta area (part of Gafsa phosphate basin) in Southwestern of Tunisia through sixty boreholes that had been randomly drilled. Optimal unbiased geostatistical tools of ArcGIS-Geostatistical analysts have been used to investigate the quantification of spatial arrangement through outlining the most optimum variogram model. The phosphate-thickness kriged map has shown a spatial distribution of phosphate in the southern of Tunisia. The variants of phosphate thickness in the kriged map reveal there is a rise of phosphate deposits towards the east. Two East-West and North-South correlations were applied using RockWorks16 software which provides visual correlation for phosphate thickness distribution throughout the Tozeur-Nafta region. The East-West correlation confirms that phosphate layer thickness increased towards the East direction, the North-South correlation shows that phosphate thickness in the northeastern limb of the Tozeur-Nafta anticline is more pronounced than in the southeastern limb. Phosphate reserves were estimated using the Ordinary Kriging Method (OKM) at 325.432661 Million tons. The results of this research indicate that the area under study shows much promise as a prospective target for investment in the local raw materials.
Keywords:
Gafsa Phosphate Basin, Draa Jerid, Rkxeserves of Phosphate, Ordinary Kriging Method

1. Introduction
Phosphorites appear in three principal zones of Tunisia: the Northern Basins, the Eastern Basins (NortheSouth Axis area), and the Gafsa-Metlaoui Basin. The Phosphorites are mainly present in the Paleocene-Eocene chouabine formation and its lateral equivalents within the Metlaoui group; they form part of the Middle Eastern to North African Late Cretaceous-Paleogene phosphogenic province [1] [2] [3] [4] [5].
The economic deposition of phosphorite is mainly in the Gafsa-Metlaoui basin in central Tunisia. Here, phosphorites are operated by the Compagnie des Phosphate de Gafsa (CPG) and are considerably utilized as raw materials for fertilizer production by the Groupe Chimique Tunisien (GCT). In other Tunisian basins, phosphorite layers are usually thinner and show inferior quality. Anterior studies have discussed stratigraphy, mineralogical composition, sedimentary facies, deposition environment and the diagenetic history of Tunisian phosphorites [6] - [30] , but reserve estimation of phosphate remain limited. Published data are predominantly by geochemical analysis of the Gafsa-Metlaoui deposits.
An accurate estimation of the ore reserves of a specific mineral is required in order to better manage and plan its extraction at mines. A thorough understanding of the distribution of the mineral content of the ore is also necessary. Nowadays, with the help of different types of computer software and through the use of geostatistical techniques, estimations can be as accurate as required. However, the implementation of these modern tools has to be done logically and with sufficient data.
Phosphate ore is known to be one of the chief minerals produced in Tunisia. The Tozeur-Nefta deposit is found in the southwestern part of the Gafsa mining basin which is approximately 12 km west of Tozeur. Phosphate rocks belong to the extensive Paleocene-Eocene phosphate series and are widely used in the chemical industry, as a source of phosphor in fertilizers and in manufacturing chemicals such as phosphoric acid [31]. The different grades of phosphate rocks can be distinguished according to the following: Poor-quality grade, P2O5% which ranges 15 to 22; medium grade, P2O5% ranging from 22 to 27; and rich grade, P2O5% greater than 27 [32]. Thus, identifying the geographical distribution of phosphate is important for engineers in this mining industry and would assist in choosing the most appropriate mining method for the extraction and for production control.
2. Geographical Setting
The main feature of Tunisia is that it has two varied geological regions: the north is characterized by the folded and faulted Atlas Mountains while the south, the stable Saharan platform [33] [34] [35] [36] [37]. The area explored in this study, known as Draa El Jerid (the Nafta-Tozeur phosphate deposit) is located in the Gafsa-Metlaoui Basin (Figure 1).
This basin is situated in the southern Atlas of central Tunisia, with an area of around 4500 km2 [38]. From the structural point of view, it is a transitional region separating an actively folded and faulted zone to the north, the central-northern Atlasic Domain, and the stable Saharan Platform to the south [39] [40] [41]. The Basin is limited in the north by the Metlaoui mountain chain, containing Jebels Ben Younes, Bouramli and Orbata, and in the south by the North Chotts Range.

Figure 1. (a) Location map of the study area; (b) Geological map of the Tozeur-Nefta deposit [42].
In this area, a noticeable subsidence has created two hypersaline depressions called El Gharsa Chott, El Jerid Chott parted by the northern uplands of the Chott and the Draa Jerid anticline also known as the Tozeur uplift or Tozeur Ridge [43] [44] [45] (Figure 2).
In the Gafsa-Metlaoui Basin, the anticline structures of Draa Jerid, located midway between El Gharsa Chott and El Jerid Chott (Figure 1), make up a portion of the western part of the Chotts fold belt [46] [47] , corresponding to structures in the most southerly part of the Atlassic domain [46] [48] [49] [50] [51].
Through the study of geoseismic cross section X Guellala et al. [52] [53] concluded that in the western edge of the Nafta area, there is a distinct discrepancy in the depth of the lithostratigraphic formations between the geological structures. Within the anticline of Draa Jerid, the Sidi Aich and Boudinar formations are respectively located at 2100 m and at 2430 m. These formations are respectively reached at a depth of 2850 m and at a depth of 3150 m within the Jerid basin.
In addition, this cross section reveals a blocked communication between Sidi Aich and Boudinar aquifers. This is explained by the presence of the East-West reverse fault in the North and in the South of the Draa Jerid anticline (Figure 3(a)).
The most noticeable difference between the piezometric values of the Continental Intercalaire aquifer detected at Hezoua and those measured in Nafta [53] (Figure 3(b)), reflect a blocked groundwater circulation between the two regions, expression of a normal fault which subsides the northeastern compartment and puts the Sidi Aich formation in the anticline of Hezoua at the front of Orbata and Zebbag formations in the western boundary of the Draa Jerid (Figure 3(b)).
At the east of the Draa Jerid area, based on MR borehole, TZ borehole and the geoseismic cross section V, the Sidi Aich aquifer formation, reached at a depth of 1735 m within the TZ borehole is laterally in front of the Zebbag formation of El Jerid Chott and in front of the Orbata and Zebbag formation of El Jerid basin

Figure 2. Cross-section of Tozeur uplift in the Jerid basin [44].

Figure 3. (a) Geoseismic cross section X western extremity of Draa Jerid [53] ; (b) Normal fault: western extremity of Draa Jerid; (c) Geoseismic cross section V eastern extremity of Draa Jerid [53].
[53]. In El Jerid bassin, the MR borehole reaches the Sidi Aich formation at a depth of more than 2500 m. This is explained by the presence of the east-west reverse fault in the north and in the south of the Draa Jerid anticline (Figure 3(c)).
The oriental extremity of Draa Jerid is marked by the NW-SE fault of Negrine-Tozeur, the western branch of the South atlasic accident in Tunisia [50] [54]. This fault extends from the Negrine to Kebili area via Tozeur [54] west of the Jebel Sidi Bouhlel megastructure [46].
Therefore, the Nefta-Tozeur area appears as an isolated structure, limited by two reverse E-W faults on the northern and southern sides and two normal NW-SE faults on the eastern and western sides (Figure 4).
The Gafsa-Metlaoui Basin is mainly range in age from Cretaceous to Quaternary. Deposition in the Gafsa-Metlaoui Basin developed in a partially confined environment, which oscillated from littoral to lagoonal atmosphere, conducing to regular or periodic deposition [24] [30]. As a result, there is notable diversity of facies inside the basin, containing porcelanites, phosphorites, shales, cherts, limestones, marls, gypsum and dolostones [38]. Marly intercalations inside the phosphorite series usually comprise from 1% to 2% until 7% of TOC (Total Organic Carbon). The organic matter is immature and is mainly of bacterial origin and marine planktonic [17] [18] [23].
The principal phosphorite sequence composes the Chouabine member [10] [55] of the Metlaoui Group of the Paleocene-Eocene [56]. The Group reposes
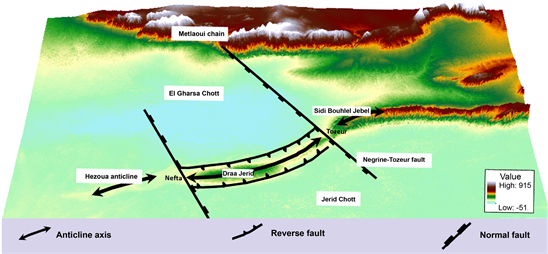
Figure 4. Simplified structural map of Draa Jerid structure.
over the Maastrichtian-Danian El Haria Formation, and is covered by Jebs Formation of the middle to upper Eocene [13] [22] [27].
The Metlaoui Group is divided into 3 members:
• A lower carbonate and evaporitic member, dated from the Palaeocene (Selja member);
• The main middle phosphatic Chouabine member, attributed to the Upper Palaeocene, is represented by ten phosphatic deposits interbedded with carbonates, clays and a cherty level;
• The upper carbonate member, named Kef Eddour, is comprised of bioclastic limestones, covered by a phosphatic recurrence named “the Upper Phosphate”, and is overlain by limestones and dolomites.
The Chouabine member regularly reaches 25 to 100 m thick [11] [13] [26] [57]. Ten essential phosphorite layers (from top to bottom: layers 0-IX) constitute this member, isolated by layer of marly limestone, marl, chert and diatom-bearing porcelanite [38]. In the eastern part of the basin the quantity of phosphorite diminishes and an important amount of carbonates and marl develops [13] , however to the west biosiliceous deposits (diatom-bearing porcelanite) become more significant [10] [11] [29] [58]. Diatom faunas mark a warm climate, coastal shallow-marine context within the central basin, with more salty eutrophic circumstances to the east [29]. Water depths augmented for east to west [22] , reaching a maximum water depth of 100 m [59]. The phosphorite-organic-rich marl-diatom-bearing porcelanite facies indicates the classic coastal upwelling trinity [60]. The oyster-rich limestones with phosphorite interbedding constitute the upper part of the Metlaoui Group, recognized by the miner as the “phosphate du toit”; these layers represent the Kef Eddour Formation [61].
The Phosphorites of the Gafsa-Metlaoui Basin were examined by Garnit [38] at five localities which are the Naguess deposit at the north of Jebel Alima, the central Kef Eddour deposit which is situated around 10 km NNW of Metlaoui, the Table Metlaoui deposit is situated on the southern side of the line of hills ranging between Jebel Stah and Jebel Alima (Figure 1). All these sites show the average total thickness of the phosphorite beds between 7.2 m and 12.4 m, with about average total thickness of the intercalated layers between 11.3 and 12.8 m.
Precise dating of the Chouabine and analogous phosphorites has confirmed challenging. Particular chemostratigraphic and biostratigraphic analyses have been studied just on Gafsa-Metlaoui Basin deposits. In the main, the begining of phosphorite sedimentation has been judged as a marker of base of Ypresian [62].
Ben Abdessalem [63] located the Paleocene-Eocene limit at the base of layer II in the Gafsa Metlaoui series, relying on the appearance of an organic walled dinoflagellate cyst aggregation predominating by Apectodinium spp. in layer 0-I.
Bolle et al. [64] fixed the base of the Eocene at the summit of the Chouabine Formation in the GafsaMetlaoui Basin, on the basis of an experimental assignment of layers 0-II to calcareous nannofossil zone NP9 with records of Discoaster multiradiatus Bramlette and Riedel, and a sequence stratigraphic correlation to the Elles section in northern Tunisia.
Ounis et al. [57] and Kocsis et al. [26] [27] locating the base of the Eocene at the summit of Chouabine Formation in layer III in the Gafsa-Metlaoui Basin.
Some time ago, El Ayachi et al. [30] inserted the Paleocene-Eocene limit in the inferior layers of the Chouabine Formation in the Oued Thelja section, relying on two samples that yielded planktonic foraminifera.
The Tozeur-Nafta phosphate deposit, found in Draa Jerid, is derived from the phosphatic Gafsa-Metlaoui basin and this deposit is alike other deposits in the Gafsa phosphate basin.
Within the Tozeur-Nafta deposit sixty two (62) boreholes have been sampled (Figure 5), with depths ranging between 30 and 1100 m, to investigate more thoroughly the phosphate deposit of the Metlaoui Formation and to attempt to estimate the reserves present in this location.
The E-W borehole correlation (Figure 6(a) and Figure 6(c)) indicates that,

Figure 5. Borehole distributions in Tozeur-Nefta deposit.


![]()
![]()
Figure 6. (a) E-W deep wells correlation in Tozeur-Nefta deposit; (b) 3D stratigraphic model of Tozeur-Nefta deposit; (c) Well location map; (d) E-W cross section of Tozeur-Nefta deposit; (e) N-S deep wells correlation in Tozeur-Nefta deposit.
within the Metlaoui Formation, only the middle phosphatic Chouabine and Kef Eddour members appear covered by the Beglia formation attributed to the Miocene.
This correlation also indicates that, in the Tozeur-Nafta deposit from base to top, CIII, CIV and CV do not appear. In this correlation, the phosphatic Chouabine member shows a marly layer at the bottom with 8.50 m of thickness surmounted by grey to a brownish phospharenite layer (CIX) which make non-productive layers because of the high content of MgO (1.79%). The centimetric to decimetric thick layers (CIII, CIV and CV), are considered sterile owing to their slight thickness and six main metric economic phosphorite beds are exploited (C0, CI, CII, CVI, CVII and CVIII) separated by marly, carbonated and chert levels. The total thickness of the phosphorite beds averages 9.8 m and the intercalated beds, 14.95 m (Table 1 and Table 2).
Regarding the thickness of the afore-mentioned, the three main phosphate layers are CI, CII and CVI, which contribute to 74.5% of the total thickness (7.30 m). In general, the phosphate layer thickness in the northeastern limb of the deposit S.49 (8.71) is more evident than in the southeastern limb S.70 (6 m) (Figure 6(e)).
The maximum thickness of the phosphate layers is situated on those in the eastern part of the deposit (Figure 6(b) and Figure 6(d)), in particular around S.9 (12.22 m) and S.30 (11.45 m) boreholes with the exception of the S.69 (8.16 m), S.68 (8.95 m) and S.28 (8.82 m) boreholes.
Concerning the Kef Eddour carbonates formation (Upper member of the Metlaoui group), the upper unit is marked by two thick carbonate bars comprised of colossal amounts of bioclastic dolomitic limestone with phosphorite intercalations, recognised in this mining industry as the “phosphate du toit” [61]. The Kef Eddour Formation show an average thickness of 40 m. The thickness is more noticeable towards the west (Figure 6(b) and Figure 6(c)).
The Beglia formation (Mio-Pliocene) mostly involves sandy fluvial deposits. The thickness of the afore-mentioned ranges from 0.00 m (P.2) and 3 m (S.25) to 105.00 m (S.51), showing an average of 21.00 m and is generally thicker to the west (Figure 6(b) and Figure 6(d)).
3. Methodology
To generate a continuous surface, it necessitates vectorial data (points, lines, surfaces) containing value information, which is interpolated in order to ensure a continuous surface. The precision of the model depends on the used methods of interpolation. Therefore, it is essential to examine, the performance of each technique.
The first stage of this was to compare the general techniques of interpolation of: Kriging, IDW and Spline, keeping in mind the knowledge that different interpolation methods show varying strengths and weaknesses depending on the

Table 1. Average thickness of exploitable phosphate layers.
Table 2. Average thickness of the interlayers.
dataset used. There can be no generalization made on whether one interpolation method would perform better than another without taking into cognition, the type and nature of the dataset and Implicated phenomenon.
The aim of this comparison was to experimentally assess the performance of Kriging, IDW and Spline methods of interpolation in approximating unidentified phosphate thickness values and modeling spatial distribution of phosphate deposit. Through this experimental evaluation, a comparative analysis was made based on the prediction mean error, prediction root mean square error (Figure 7) and validation outputs of these methods of interpolation. The investigative results for each method on both biased and normalized data show that the most accurate interpolation in this experiment was provided by the Kriging technique.
Kriging, described as “interpolation with geostatistics” [65] , is a technique used to analyze continuous data. Interpolation using this technique is widely approved by statisticians and scientists since the process is based on theory. There are various kriging techniques available through different software such as GSLIB, Geostat, ArcGIS, ArcInfo, Surfer, etc. The phosphate reserves at the 62 boreholes (Figure 5) have been spatially studied through the thorough characterization of the autocorrelation and semivariogram mechanisms via geostatistical implements.
In this research autocorrelations and correlograms were calculated and constructed using ArcGIS which explored the spatial distribution of phosphate on a point scale system by means of the ArcGIS-Geostatistical analyst.
![]()
Figure 7. Prediction errors of the phosphate thickness estimation to evaluate the performance of interpolation methods (a) Kriging, (b) IDW, (c) Spline interpolation methods.
In using Kriging, it was possible to complete the interpolation or appraisal of values for points in an area that had not yet been sampled (this is known as a nearest-neighbor technique). In this case, the values at locations close to the interpolation point are used to estimate the point value of the interpolation. In a data set of the 15 closest neighbours, Kriging uses the core spatial relationship that exists among them. Kriging was applied in this based on a regionalized variable theory and it appears more better than any other interpolation method since it provides the most favoured interpolation estimate for a specific coordinate location, in addition to a variance estimate for the interpolation value.
In utilizing this method, 2D maps of the phosphate content data were created to display the horizontal spatial distribution of phosphate in each depth interval.
Finally, these kriging maps were availed of to estimate the phosphate reserve using methods considered to be advanced statistically and geostatistically. Geostatistical Analyst (version 10.2) provides well-established geoprocessing tools and serves as an extension for advanced surface modeling by means of deterministic (non-geostatistical method) and geostatistical methods.
4. Results
In the current study, the reserves were estimated with consideration to the thickness of the phosphate layers in the boreholes. The reserve was valued using the geostatistical method as Ordinary Kriging Method (OKM).
At present, there are several computer programs that allow, through geostatistical analysis, the estimation of ore reserves to a high precision, in less time and at a lower cost than others. If the ArcGIS software is used, the interpolation is usually more precise as it relies on the geographical dispersal of the information (actual spatial coordination). In this study, before to using the interpolation techniques, the data was examined using the exploratory spatial data analysis tools alongside the ArcGIS software.
In this case study, sixty two borehole samples were gathered from different locations in the Tozeur-Nafta region so as to analyze and map the spatial distribution of the phosphate thickness. The phosphate thickness kriged maps as seen in (Figures 8-10) indicate that the eastern part of the area under study and the small region towards the west have a greater thickness than the other areas which have a relatively lower thickness. The lowest thickness is shown in yellow.
The phosphate reserve estimation was based on the Equation (1) (Formula source is the Compagnie des Phosphate de Gafsa (CPG)):
![]() (1)
(1)
where BTS is a raw phosphate, sorted and dried (in tons), VPP is a volume of phosphate set up (m3), VPE is a volume of loss on exploitation (m3), VS is a volume of fouling (m3), VH is a volume of humidity (m3).
VPP calculation was based on the Equation (2):
VPP = Kriging Mean value (m) × Area (m2) (2)
where the Kriging mean value is the mean thickness of phosphate layers between
![]()
Figure 8. (a) Predicted thickness map of phosphatic layer C0 in Tozeur-Nefta deposit; (b) Predicted thickness map of phosphatic layer CI in Tozeur-Nefta deposit.
two consecutive isopack curves (m) estimated from the geospatial analysis (Figures 8-10). The area was evaluated from the ArcGIS software. VPE calculation was based on the Equation (3):
VPE = Sr × Tr (3)
Tr is a recovery rate is considered at a loss of 5 cm from the wall and 5 cm from the roof of each layer.
VS calculation was based on the Equation (4):
VS = Area × Ts (4)
Ts is a fouling rate is dependent on the approximated thickness of limestone blocks or the existence of Marl within each layer.
![]()
Figure 9. (a) Predicted thickness map of phosphatic layer CII in Tozeur-Nefta deposit; (b) Predicted thickness map of phosphatic layer CVI in Tozeur-Nefta deposit.
VH calculation was based on the Equation (5):
VH = VPP × Th (5)
Th is the humidity equals 12%.
d is the density of the level of phosphate (Table 3).
Tables 4-10 summarize the calculations made for each phosphate layer in order to obtain the phosphate volume from each layer as well as the total phosphate volume in the whole deposit.
5. Discussion
The estimation of the reserve of a deposit, based on borehole surveys, leads to the calculation of the ore it contains. These values correspond to the maximum
![]()
Figure 10. (a) Predicted thickness map of phosphatic layer CVII in Tozeur-Nefta deposit; (b) Predicted thickness map of phosphatic layer CVIII in Tozeur-Nefta deposit.
Table 3. Phosphate density by layer.
Table 4. Phosphate ore reserve estimations using the Kriging method for phosphatic layer 0 in the Tozeur-Nefta phosphate ore deposit.
Table 5. Phosphate ore reserve estimations using the Kriging method for phosphatic layer I in the Tozeur-Nefta phosphate ore deposit.
Table 6. Phosphate ore reserve estimations using the Kriging method for phosphatic layer II in the Tozeur-Nefta phosphate ore deposit.
Table 7. Phosphate ore reserve estimations using the Kriging method for phosphatic layer VI in the Tozeur-Nefta phosphate ore deposit.
Table 8. Phosphate ore reserve estimations using the Kriging method for phosphatic layer VII in the Tozeur-Nefta phosphate ore deposit.
Table 9. Phosphate ore reserve estimations using the Kriging method for phosphatic layer VIII in the Tozeur-Nefta phosphate ore deposit.
Table 10. Phosphate ore reserve estimations using the Kriging method for all phosphatic layers in the Tozeur-Nefta phosphate ore deposit
potential of the deposit: which are the resources. It should be noted the result of such a calculation is called inferred reserves. After this initial calculation and based on the industrial applications and characteristics of the ore, there can then be a calculation of the recoverable reserves undertaken.
The creation of the different iso-thickness maps has allowed us to conduct an analysis in terms of thickness but also in terms of the financial viability of the different exploitable phosphatic layers. The present study has allowed us to deduce that layers I and II of the deposit are economically very profitable, given that, for example, layer I has a significant thickness can reach up to 7.5 m. The variation of the thickness could be due to the paleogeography of the basin, as well as to the variations of the eustatic sea level during the Paleocene-Eocene. The iso-thickness maps have allowed us to identify the significance of the amount of phosphate found in each analysed layer. Finally, the study of the reserve estimate shows that layers I and II have a reserve of 235 million tons of phosphate, which means that these layers are economically exploitable.
6. Conclusions
The Paleocene-Eocene phosphate series constitutes the continuity and the equivalent series in the Gafsa mining basin which is situated underground. The thicknesses of the upper layers average about 78 m and consist essentially of sands from the Beglia Formation and carbonates from the Metlaoui Formation. This phosphate series is characterized alternately by phosphate levels and marl levels [66].
It is known that with heavy investments and fluctuating markets, a mining group needs precision in order to make decisions. Geostatistics has forged a practical tool that enables one to go as rationally as possible from some numerical information to ore “benefited” by crossing the smoothing effect of the geometry of mining operations.
ArcGIS software provides mining companies with the geographic advantage to target mineral potential. Geoscientists of mineral exploration use various types of datasets to search for deposits; such information needs to be viewed and analysed quickly and easily. ArcGIS gathers this data using easy-to-use software applications and tools, making the spatial context of the information available to mining planners and enabling a more in-depth understanding of the geography of potential sites. Using ArcGIS geostatic tools, it is possible to locate profitable deposit regions and calculate the potential of mineral sites through borehole data.
Methodology integrating kriging and GIS has been introduced and implemented in the Tozeur-Nafta area to demonstrate its usefulness in mapping the spatial distribution of phosphate thickness in a specific mining area. In the present study, ordinary kriging was used to identify the different areas consisting of economical mining grades of phosphate and poorer quality ones. Furthermore, GIS was used to be illustrative of the results and to provide more details to the kriging results. From the prediction maps of phosphate thickness, the phosphate quantity in the Tozeur Nefta deposit can be calculated at an average of 325 MT.
From the prediction maps of phosphate thickness, it can also be concluded that, the thickness generally increases in the E-W direction, signifying that the mining engineer would probably start the extraction operations in this economical part.
Conflicts of Interest
The author declares no conflicts of interest regarding the publication of this paper.
Cite this paper
Ouerghi, S. (2019) A GIS-Based Geological Model for Assessing the Reserves of Phosphate in the Tozeur-Nefta Field, Southern Tunisia. International Journal of Geosciences, 10, 589-611. https://doi.org/10.4236/ijg.2019.105034
References
- 1. Notholt, A.J.G. (1980) Economic Phosphatic Sediments: Mode of Occurrence and Stratigraphical Distribution. Journal of the Geological Society. 137, 793-805.https://doi.org/10.1144/gsjgs.137.6.0793
- 2. Sheldon, R.P. (1987) Association of Phosphatic and Siliceous Marine Sedimentary Deposits. In: Hein, J.R., Ed., Siliceous Sedimentary Rock-Hosted Ores and Petroleum, Van Norstrand Reinhold Co., New York, 58-80.
- 3. Notholt, A.J.G., Sheldon, R.P. and Davidson, D.F. (1989) Phosphate Deposits of the World 2: Phosphate Rock Resources. Cambridge University Press, Cambridge.
- 4. Glenn, C.R., Feollmi, K.B., Riggs, S.R., Baturin, G.N., Grimm, K.A., Trappe, J., Abed, A.M., Galliolivier, C., Garrison, R.E., Ilyin, A.V., Jehl, C., Rohrlich, V., Sadaqah, R.M.Y., Schidlowski, M., Sheldon, R.E. and Siegmund, H. (1994) Phosphorus and Phosphorites: Sedimentology and Environments of Formation. Eclogae Geologicae Helvetiae, 87, 747-788.
- 5. Lucas, J. and Prévôt-Lucas, L. (1996) Tethyan Phosphates and Bioproductites. In: Nairn, A.E.M., Ricou, L.-E., Vrielynck, B. and Dercourt, J., Eds., The Tethys Ocean, Springer, Boston, MA, 367-391. https://doi.org/10.1007/978-1-4899-1558-0_12
- 6. Thomas, P. (1885) Sur la Découverte de Gisements de Phosphate du Chaux dans le Sud de la Tunisie. Comptes Rendus de l’Académie des Sciences, 101, 1184.
- 7. Cayeux, L. (1896) Note Preliminaire sur la Constitution des Phosphates de Chaux du Senonien du Sud de la Tunisie. Comptes Rendus de l’Académie des Sciences, 123, 273-276.
- 8. Pervinquiere, L. (1903) étude Géologique de la Tunisie Centrale. Direction Générale des Travaux Publics, Carte Géologique de la Tunisie, F.R. de Rudeval, Paris.
- 9. Castany, G. (1951) étude Géologique de l’Atlas Tunisien Oriental. Royaume de Tunis. Annales des Mines et de la Geologie, 8, 632.
- 10. Burollet, P.F. (1956) Contribution à l'étude Stratigraphique de la Tunisie Centrale. Annales des Mines et de la Geologie, 18, 352.
- 11. Sassi, S. (1974) La Sedimentation Phosphatee au Paléocène dans le Sud et le Centre Ouest de la Tunisie. Thèse de Doctorat es Sciences. Université de Paris Sud, Orsay, France.
- 12. Belayouni, H. and Trichet, J. (1983) Preliminary Data on the Origin and Diagenesis of the Organic Matter in the Phosphate Basin of Gafsa. In: Bjoroy, M., et al, Eds., Advances in Organic Geochemistry, John Wiley and Sons, New York, 328-335.
- 13. Chaabani, F. (1995) Dynamique de la Partie Orientale du Bassin de Gafsa au Crétace et au Paléogène: Etude Minéralogique et Géochimique de la Série Phosphatée Eocene, Tunisie Méridionale. Thèse Doctrat d’Etat. Université de Tunis II, Tunis.
- 14. Beji-Sassi, A. (1999) Les Phosphates dans les Basins Paléogènes de la Partie Méridionale de l’axe Nord-Sud (Tunisie). Thèse de Doctorat d’Etat, Department of Geology. Université de Tunis II, Tunis.
- 15. Beji-Sassi, A. and Sassi, S. (1999) Le Cadmium Associé aux Dépôts Phosphatés en Tunisie Méridionale. Journal of African Earth Sciences, 29, 501-513.https://doi.org/10.1016/S0899-5362(99)00112-8
- 16. Zaïer, A. (1999) Evolution Tectono-Sedimentaire du Bassin Phosphaté Méridionale du Centre-Ouest de la Tunisie Minéralogie, Pétrographie, Géochimie et Genèse des Phosphorites. Thèse de Doctorat es Sciences, Université de Tunis II, Tunis.
- 17. Felhi, M., Tlili, A. and Montacer, M. (2008) Geochemistry, Petrography and Spectroscopy of Organic Matter of Clay-Associated Kerogen of Ypresian Series: Gafsa-Metlaoui Phosphatic Basin, Tunisia. Resource Geology, 58, 428-436.https://doi.org/10.1111/j.1751-3928.2008.00075.x
- 18. Ben Hassen, A., Trichet, J., Disnar, J.-R. and Belayouni, H. (2009) Données Nouvelles sur le Contenu Organique des Dépôts Phosphatés du Gisement de Ras-Draa (Tunisie). Comptes Rendus Geoscience, 341, 319-326. https://doi.org/10.1016/j.crte.2009.02.001
- 19. Ben Hassen, A., Trichet, J., Disnar, J.-R. and Belayouni, H. (2010) Pétrographie et Géochimie Comparées des Pellets Phosphates et de leur Gangue dans le Gisement Phosphaté de Ras-Draa (Tunisie). Implications Sur la Genèse des Pellets Phosphatés. Swiss Journal of Geosciences, 103, 457-473. https://doi.org/10.1007/s00015-010-0029-x
- 20. Ferreira da Silva, E., Mlayah, A., Gomes, C., Noronha, F., Charef, A., Sequeira, C., Esteves, V. and Figueiredo Marques, A.R. (2010) Heavy Elements in the Phosphorite from Kalaat Khasba Mine (North-Western Tunisia): Potential Implications on the Environment and Human Health. Journal of Hazardous Materials, 182, 232-245. https://doi.org/10.1016/j.jhazmat.2010.06.020
- 21. Galfati, I., Sassi, A.B., Zaier, A., Bouchardon, J.L., Bilal, E., Joron, J.L. and Sassi, S. (2010) Geochemistry and Mineralogy of Paleocene-Eocene Oum El Khecheb Phosphorites (Gafsa-Metlaoui Basin) Tunisia. Geochemical Journal, 44, 189-210.https://doi.org/10.2343/geochemj.1.0062
- 22. Ounis, A. (2011) Apport de la Géochimie des Terres Rares et des Isotopes pour la Comprehension des Mécanismes de la Phosphatogènese: Exemple de la Partie Occidentale du Bassin de Gafsa-Metlaoui. Ph.D. Thesis, Faculté des Sciences de Tunis, Université de Tunis El Manar, Tunis.
- 23. Tlili, A., Felhi, M., Fattah, N. and Montacer, M. (2011) Mineralogical and Geochemical Studies of Ypresian Marly Clays and Silica Rocks of Phosphatic Series, Gafsa-Metlaoui Basin, Southwestern Tunisia: Implication for Depositional Environment. Geochemical Journal, 15, 53-64. https://doi.org/10.1007/s12303-011-0003-2
- 24. Garnit, H., Bouhlel, S., Barca, D. and Chtara, C. (2012) Application of LA-ICP-MS to Sedimentary Phosphatic Particles from Tunisian Phosphorite Deposits: Insights from Trace Elements and REE into Paleo-Depositional Environments. Geochemistry, 72, 127-139. https://doi.org/10.1016/j.chemer.2012.02.001
- 25. Garnit, H., Bouhlel, S., Barca, D., Johnson, C.A. and Chtara, C. (2012) Phosphorite-Hosted Zinc and Lead Mineralization in the Sekarna Deposit (Central Tunisia). Mineralium Deposita, 47, 545-562. https://doi.org/10.1007/s00126-011-0395-y
- 26. Kocsis, L., Ounis, A., Chaabani, F. and Salah, N.M. (2013) Paleoenvironmental Conditions and Strontium Isotope Stratigraphy in the Paleogene Gafsa Basin (Tunisia) Deduced from Geochemical Analyses of Phosphatic Fossils. International Journal of Earth Sciences, 102, 1111-1129. https://doi.org/10.1007/s00531-012-0845-5
- 27. Kocsis, L., Ounis, A., Baumgartner, C., Pirkenseer, C., Harding, I.C., Adatte, T., Chaabani, F. and Neili, S.M. (2014) Paleocene-Eocene Palaeoenvironmental Conditions of the Main Phosphorite Deposits (Chouabine Formation) in the Gafsa Basin, Tunisia. Journal of African Earth Sciences, 100, 586-597. https://doi.org/10.1016/j.jafrearsci.2014.07.024
- 28. Galai, H. and Sliman, F. (2014) Mineral Characterization of the Oum El Khacheb Phosphorites (Gafsa-Metlaoui Basin; S Tunisia). Arabian Journal of Chemistry, in press. https://doi.org/10.1016/j.arabjc.2014.10.007
- 29. Ahmed, A.H., Tlili, A., Zalat, A.A. and Jeddoui, Y. (2015) Fossil Diatoms from Endogangue of the Ypresian Phosphatic Pellets of the Gafsa-Metlaoui Basin: Implication on the Origin of Biogenic Silica and Depositional Environment. Arabian Journal of Geosciences, 8, 1077-1087. https://doi.org/10.1007/s12517-013-1253-2
- 30. El Ayachi, M.S., Zagrarni, M.F., Snoussi, A., Bahrouni, N., Gzam, M., Ben Assi, I., Hammami, K., Abdelli, H. and Ben Rhaiem, H. (2016) The Paleocene-Lower Eocene Series of the Gafsa Basin (South-Central Tunisia): Integrated Stratigraphy and Paleoenvironments. Arabian Journal of Geosciences, 9, 395. https://doi.org/10.1007/s12517-016-2403-0
- 31. Abbady, A., Uosif, M. and El-Taher, A. (2005) Natural Radioactivity and Dose Assessment for Phosphate Rocks from Wadi El-Mashash and El-Mahamid Mines, Egypt. Journal of Environmental Radioactivity, 84, 65-78. https://doi.org/10.1016/j.jenvrad.2005.04.003
- 32. Ouled Ghrib, A. (2005) Le Gisement Tozeur Nefta Géologie, Réserves et Qualité. Rapport Interne CPG.
- 33. Caire, A. (1971) Chaînes Alpines de la Méditerranée Centrale (Algérie et Tunisie Septentrionale, Sicile, Calabre et Apennin Méridional). Unesco, Tectonique de l’Afrique. Science de la Terre, 6, 61-90.
- 34. Addoum, B. (1995) L’Atlas Saharien Sud-Oriental: Cinématique des Plis-Chevauchements et Reconstruction du Bassin du Sud-Est Constantinois Confins Algéro-Tunsiens). Ph.D. Thesis, Université de Paris Sud, Orsay, France.
- 35. Bouaziz, S., Barrier, E., Soussi, M., Turki, M.M. and Zouari, H. (2002) Tectonic Evolution of the Northern African Margin in Tunisia from Paleostress Data and Sedimentary Record. Tectonophysics, 357, 227-253. https://doi.org/10.1016/S0040-1951(02)00370-0
- 36. Gabtni, H., Jallouli, C., Mickus, K. and Zouari, H. (2005) Geophysical Constraints on the Location and Nature of the North Saharan Flexure in Southern Tunisia. Pure and Applied Geophysics, 162, 2051-2069. https://doi.org/10.1007/s00024-005-2704-9
- 37. Frizon de Lamotte, D., Michard, A. and Saddiqi, O. (2006) Quelques Développements Récents sur la Géodynamique du Maghreb. Comptes Rendus Geoscience, 336, 1-10. https://doi.org/10.1016/j.crte.2005.11.006
- 38. Garnit, H., Bouhlel, S. and Javis, I. (2017) Geochemistry and Depositional Environments of Paleocene-Eocene Phosphorites: Metlaoui Group, Tunisia. Journal of African Earth Sciences, 134, 704-736. https://doi.org/10.1016/j.jafrearsci.2017.07.021
- 39. Zargouni, F. (1985) Tectonique de l’Atlas Méridional de Tunisie, Evolution Géométrique et Cinématique des Structures en zone de Cisaillement. Thèse (Science). Universite Louis Pasteur, France.
- 40. Hlaiem, A., Biju-Duval, B., Vially, R., Laatar, E. and M’Rabet, A. (1997) Burial and Thermal History Modelling of the Gafsa-Metlaoui Intracontinental Basin (Southern Tunisia): Implications for Petroleum Exploration. Journal of Petroleum Geology, 20, 403-425. https://doi.org/10.1111/j.1747-5457.1997.tb00924.x
- 41. Saïd, A., Baby, P., Chardon, D. and Ouali, J. (2011) Structure, Paleogeographic Inheritance, and Deformation History of the Southern Atlas Foreland Fold and Thrust Belt of Tunisia. Tectonics, 30, 1-15. https://doi.org/10.1029/2011TC002862
- 42. Mahjoub, K. (1995) Carte géologique de la Tunisie 1/100.000. Feuille de Tozeur. Service Géologique, Tunisie.
- 43. Mamou, A. (1990) Caractéristiques et Evaluation des Ressources en Eau du Sud Tunisien. Thèse (Doctoral), Université Paris-Sud, France.
- 44. Tarki, M., Dassi, L. and Jedoui, Y. (2012) Groundwater Composition and Recharge Origin in the Shallow Aquifer of the Djerid Oases, Southern Tunisia: Implications of Return Flow. Hydrological Sciences Journal, 57, 790-804. https://doi.org/10.1080/02626667.2012.681783
- 45. Hadj Ammar, F., Chkir, N., Zouari, K., Hamelin, B., Deschamps, P. and Aigoun, A. (2014) Hydro-Geochemical Processes in the Complexe Terminal Aquifer of Southern Tunisia: An Integrated Investigation Based on Geochemical and Multivariate Statistical Methods. Journal of African Earth Sciences, 100, 81-95. https://doi.org/10.1016/j.jafrearsci.2014.06.015
- 46. Fakraoui, M. (1990) Etude Stratigraphique et Structurale des Chaînes des Chotts (Atlas méridional): Evolution Géométrique et Cinématique Liée à l’Accident Sud Atlasique. Thèse de Doctorat, Université de Tunis II, Tunisie.
- 47. Zouaghi, T., Guellala, R., Lazzez, M., Bédir, M., Ben Youssef, M., Inoubli, MH. and Zargouni, F. (2011) The Chotts Fold Belt of Southern Tunisia, North African Margin: Structural Pattern, Evolution, and Regional Geodynamic Implications. In: Schattner, U., Ed., New Frontiers in Tectonic Research—At the Midst of Plate Convergence, IntechOpen, London, 49-72. https://doi.org/10.5772/20636
- 48. Abdeljaoued, S. (1985) Etude Sédimentologique et Structurale de la Partie Orientale de la Chaîne Nord des Chotts. Ph.D. Thesis, Université de Tunis II, Tunisie.
- 49. Rabia, M.C. (1985) Etude Géologique de la Région des Chotts (Sud Tunisien) par Télédetection Spatial, Détection de la Radioactivité Naturelle et Analyse Hydrogéochimique. Thèse de Doctorat, Université de Bordeaux I, Bordeaux.
- 50. Zargouni, F. (1986) Style Tectonique de l’Atlas Méridional de Tunisie. Evolution Géométrique et Cinématique des Structures en Zone de Cisaillement. Thèse es Sciences, Univ. Louis Pasteur Strasbourg. Revue Sciences Terre. Ed. Centre Sciences, Institut National Recherches Scientifiques Techniques, Tunisie.
- 51. Ben Ayed, N. (1986) Evolution Tectonique de l’Avant Pays de la Chaîne Alpine de la Tunisie du Début du Mésozoïque à l’Actuel. Thèse (Science), Université Tunis II, Tunisie.
- 52. Guellala, R. (2010) Etude Géologique et Hydrogéologique des Séries Crétacées Inférieures du Jérid (Sud-Ouest de la Tunisie). Apports des Méthodes Géophysiques. Thèse de Doctorat, Université de Tunis II, Tunisie.
- 53. Guellala, R., Ben Marzoug, H., Inoubli, M.H. and Moumni, L. (2011) Apports de la Sismique Réflexion à l'Etude de l’Aquifère du Continental Intercalaire du Jérid (Tunisie). Hydrological Sciences Journal, 56, 1040-1052. https://doi.org/10.1080/02626667.2011.590809
- 54. Ben Ayed, N. (1993) Evolution Tectonique de l’Avant Pays de la Chaîne Alpine de Tunisie du Début du Mésozoïque a l’Actuel. Ann. Mines Géol, Tunis.
- 55. Fournié, D. (1978) Nomenclature Stratigraphique des Séries de Crétacé Supérieur au Tertiaire de Tunisie. Bulletin des centres de recherches exploration-production Elf-Aquitaine, 2, 97-148.
- 56. Moody, R.T.J. (1987) The Ypresian Carbonates of Tunisia—A Model of Foraminiferal Facies Distribution. In: Hart, M.B., Ed., Micropaleontology of Carbonate Environments, Ellis Horwood for the British Micropalaeontological Society, Chichester, 82-92.
- 57. Ounis, A., Kocsis, L., Chaabani, F. and Pfeifer, H.R. (2008) Rare Earth Elements and Stable Isotope Geochemistry (δ13C and δ18O) of Phosphorite Deposits in the Gafsa Basin, Tunisia. Palaeogeography, Palaeoclimatology, Palaeoecology, 268, 1-18. https://doi.org/10.1016/j.palaeo.2008.07.005
- 58. Sassi, S. (1980) Contexte Paléogéographique des Dépôts Phosphatés de l’Eocène de Tunisie. In: Géologie Comparée des Gisements de Phosphates de Pétrole. Document BRGM, 24, Orléans, 167-183.
- 59. Adatte, T., Keller, G. and Stinnesbeck, W. (2002) Late Cretaceous to Early Paleocene Climate and Sea-Level Fluctuations: The Tunisian Record. Palaeogeography, Palaeoclimatology, Palaeoecology, 178, 165-196. https://doi.org/10.1016/S0031-0182(01)00395-9
- 60. McKelvey, V.E., Swanson, R.W. and Sheldon, R.P. (1953) The Permian Phosphorite Deposits of the Western United States. In: Saint Guilhem, M.R., Ed., Origine des Gisements de Phosphates de Chaux: 19th International Geological Congress, Algiers, 45-64. https://doi.org/10.3133/ofr53166
- 61. Ben Haj Ali, M., Kadri, A. and Zagrarni, M.F. (2002) Les Unités Lithostratigraphiques de l’Eocène en Tunisie: Evolution Latérale et Actualisation de la Nomenclature. Note de Service Geologique, Tunis.
- 62. Zaïer, A., Béji-Sassi, A., Sassi, S. and Moody, R.T.J. (1998) Basin Evolution and Deposition during the Early Paleocene in Tunisia. Geological Society, 132, 375-393. https://doi.org/10.1144/GSL.SP.1998.132.01.21
- 63. Ben Abdessalem, N. (1978) Etude Paléontologique et Micro-Paléontologique de la Série Phosphatée du Bassin de Gafsa-Metlaoui (Tunisie). Application à la Compréhension des Mécanismes de la Phosphatogenèse. Thèse de Doctorat, Université Paris VI, Paris.
- 64. Bolle, M.P., Adatte, T., Keller, G., Von Salis, K. and Burns, S. (1999) The Paleocene-Eocene Transition in the Southern Tethys (Tunisia): Climatic and Environmental Fluctuations. Bulletin de la Societe Geologique de France, 170, 661-680.
- 65. Burrough, P.A. and McDonnell, R.A. (1998) Principles of Geographical Information System. Oxford University Press, New York.
- 66. Gallala, W., Saïdi, M., El Hajii, S., Zayani, K., Essghaier, M.G. and Montacer, M. (2015) Characterization and Valorization of Tozeur-Nefta Phosphate Ore Deposit (Southwestern Tunisia). Procedia Engineering, 138, 8-18. https://doi.org/10.1016/j.proeng.2016.02.047