International Journal of Geosciences
Vol.10 No.01(2019), Article ID:90324,23 pages
10.4236/ijg.2019.101005
The Geothermal Regime in Sirt Basin, Libya: The Geological Role and Heat Flow Studies
Ahmed Al-Rashed1, Fouad Shaaban1, Ahmed Yousef2
1Department of Science, College of Basic Education, PAAET, Kuwait
2Department of Geology, Desert Research Center, Cairo, Egypt

Copyright © 2019 by author(s) and Scientific Research Publishing Inc.
This work is licensed under the Creative Commons Attribution International License (CC BY 4.0).
http://creativecommons.org/licenses/by/4.0/


Received: December 28, 2018; Accepted: January 28, 2019; Published: January 31, 2019
ABSTRACT
Bottom hole temperatures (BHTs) and static formation temperatures (DSTs) of 70 deep exploratory wells are used to evaluate the geothermal regime in the northeastern part of Sirt Basin. A linear regression was derived between the BHT’s and the DST’s, for correcting the bottom hole temperatures from the drilling factors that lower them from the true formation temperatures. The geothermal gradients were calculated using the corrected BHT’s and the heat flow has been estimated. Interpretation of the geothermal data, utilizing subsurface maps and isothermal geologic cross section, revealed a shallow, local semi-thermal reservoir of Oligo-Miocene age (at depths < 1000 m). The geothermal gradients and heat flow values of this reservoir are ranging from 40 - >60˚C/Km and from 80 up to >130 mW/m2, respectively. At deeper depths (>1000 m until the maximum depth of investigation), the area has more or less moderate to low geothermal gradients that range from 40 to <20˚C/Km and heat flow <80 to <20 mW/m2. The study indicates that the vertical and the lateral variations of the formation temperatures, geothermal gradients and the heat flow values are controlled by the structural, groundwater movements as well as lithological and thermal characteristics of the subsurface sequence.
Keywords:
Geothermal Reservoir, Bottom Hole Temperatures, Static Formation Temperatures, Heat Flow, Sirt Basin

1. Introduction
The Sirt rift complex covers an area of about 600,000 km2 of north-central Libya. It was developed as an epicratonic rifted embayment on the North African plate south of the Tethys Ocean. The rift complex was filled with a Mesozoic-Tertiary sedimentary megacycle up to 7.5 km thick, which reveals the aborted nature of the rift system [1]. The origin, tectonic history and stratigraphy of the Sirt Basin have been studied by several authors, among them: [2] - [8].
Tectonically, Sirt basin is a NE-elongated basin or embayment (Figure 1). Its origin is attributed to the collapse of the Sirt Arch (during Upper Late Jurassic to Early Cretaceous times). This is due to the result of plate movements along a group of faults trending in E-W, NW-SE and NE-SW directions [9]. The old (NW-SE) trend was established at the end of the Paleozoic with a series of fractures perpendicular to that trend, which create a series of horsts and grabens and erosion of the Late Paleozoic sediments. The youngest (NE-SW) tectonic trend occurred later during Paleocene time because of re-activation of the above-mentioned fractures during the Paleocene time [10].
During the Paleozoic the whole Sirt Basin area was in general a part of a slowly subsiding craton with a NW-SE trending horst-graben system, which was affected by the advance and the retreat of epicontinental seas. During the Hercynian event the area was uplifted restricting the shallow seas to the N of Libya and to the offshore. The Early Carboniferous collision between Gondwana and

Figure 1. Generalized structural map showing the tectonic framework of the Sirt rift complex [8].
Laurasia marks the onset of the Hercynian orogeny and the uplift of the Sirt-Tibesti Arch, which led to the erosion of the Paleozoic sediments.
The structural and stratigraphic evolution of the Sirt Basin was developed during four main tectonic phases corresponding to plate reorganization, which is tied to the evolution of the Atlantic and the Tethys. Rifting commenced in the Triassic-Early Cretaceous, peaked in the Late Cretaceous, and terminated in Early Tertiary time. These affected the three main arms forming the Sirt rift complex (Figure 1). The three arms of the Sirt rift complex are the Sirt arm (NW-SE trending), the Sarir-Hameimat arm (E-W trending) and the Abu Tumayam-Tibesti arm (NE-SW trending) [3]. These arms are roughly oriented at about 120˚ and show similarities of a triple junction system. However, each of the arms of the extensional rift system has its own structural style.
There is still a debate in literature about the timing of the rifting episodes in the Sirt Basin and, consequently, about the triple junction hypothesis. [5] concluded that the E-W-trending horsts and grabens of the Sarir-Hameimat arm were formed during the Triassic, Middle and Late Jurassic, and Early Cretaceous Neocomian time, prior to the main NW-SE oriented horsts and grabens of the Sirt arm, which evolved during Early Cretaceous Aptian time and continued to Late Cretaceous. This contradicts the paleontologic, stratigraphic, and sedimentological evidence, which suggests flooding of the main NNW-SSE troughs of the rift complex from the Tethys Ocean started during the Barremian-Berriasian time and continued to the Late Cretaceous [6] and [7], which suggest that the NNW-SSE arm of the Sirt rift complex was opened almost at the same time as the E-W trending Sarir arm.
Subsurface data however suggest that the Maragh Trough, which is located in eastern Sirt Basin, and the south-western margin of Cyrenaica platform were developed during the Permo-Triassic time as an incipient rift, a prelude to the main rifting of Sirt Basin. The basin is tectonically differentiated into two main regional parts; the northern part that comprises the Zallah, Maradah and Ajdabiya paleograbens and associated paleohorsts and the southeastern part, which represents the Al Sarir-Abu Attiffel basin [8]. Consequently, there are conspicuous differences in the stratigraphy and structures of the two regions. [9] distinguished four different tectonic stages or phases controlling the structural setting of the Sirt basin (Figure 2), each are characterized by a homogeneity or heterogeneity of the resulting tectonic features and sediment types.
The first tectonic phase includes the geohistory of the area from the Precambrian to the end of the Early Cretaceous (96 Ma). The second tectonic phase extends from about the beginning of Cenomanian to the Maastrichtian (97 Ma - 74 Ma). It is more precisely genetically influenced by the particular tectonic character of the Late Cretaceous and

Figure 2. Lithostratigraphy of the north Sirt basin [9]. The stratigraphic nomenclature is basin-wide although terminology may differ in other areas of the basin. The tectonic intervals used in the text as shown in the second column from the right.
continue to have a characteristic homogeneity and clear genetic relationship with the development of the Sirt Basin complex. The fourth tectonic phase occupies the closing period of geohistory significant to the sedimentary and structural characteristics of the entire
The generalized stratigraphic section of the studied area (Figure 2) shows sedimentary rock units ranging in age from Middle Jurassic to Miocene. This section is divided into pre-rift, syn-rift and post-rift mega-sequences [10]. The pre-rift mega-sequence includes igneous, metamorphic, Paleozoic (sedimentary and volcanic) and Triassic rocks. Uncomfortably, the pre-rift sequence is overlaid by the syn-rift siliciclastic sediments of the Middle Jurassic-Early Cretaceous, which overlies by regional unconformity representing a phase of tectonic uplift and erosion in the Early Cenomanian. The overlying post-rift mega-sequence is dominated by transgressive marine sediments.
Volcanism and Heat flow
Volcanic activities in the Sirt Basin show a strong relation to the different rifting phases of the basin. The oldest dated magmatic event in the area dates from Late Permian to Late Triassic during the incipient rifting in the eastern part of the basin in the Amal High and the NW trending Maragh Trough. The second rifting event occurred during the Middle Jurassic to late Early Cretaceous [11]. The last significant volcanic activity, occurred in the western Sirt Basin, began during the Paleocene and extended from the Miocene to Late Pliocene and even to the Quaternary.
A large area was inundated by lava of alkali basaltic affinities sourced from the upper mantle [12]. Volcanic fields are forming a NNW-SSE trending chain throughout Libya (Gharyan volcanic province, Jabal As Sawda, Jabal Al Haruj, Tibesti, etc.) and are controlled by the intersection of NW-SE and NE-SW fault systems in attenuated and thermally uplifted lithosphere [13] and [14]. Each of these three rifting events continued for a period of 50 Ma and was followed by a period of quiescence of about 50 Ma [11]. However the progressively younger ages of the onset of the volcanic activities of the Tertiary and Quaternary may also support a different explanation.
[15] stated that, from west to east, the pattern of heat flow across northern Africa is characterized by high (80 - 110 mW/m2) heat flow throughout most of northwestern Africa, normal to perhaps slightly elevated heat flow in the Sirt Basin, low to normal (35 - 55 mW/m2) heat flow in Egypt inboard of the Red Sea, and high heat (75 - 100 mW/m2) flow along the Red Sea. They added that the heat flow is fairly uniform throughout the basin, with a mean of 72 ± 9 (s. d.) mW/m2. It is not clear if heat flow from the Sirt Basin is elevated as a consequence of its origin as a late Mesozoic rift. Heat flow values in the Sirt rift complex may range from 51.0 to 83.0 mW/m2 and average above 63 mW/m2 with the higher values characterized in the younger and tectonically active areas in the W of the basin [16]. The basin exhibits a general northward increase of geothermal gradients from 20˚C/km on land to 40˚C/km in the offshore area. Based on the thermal map of Africa, the Sirt Basin exhibits a notable crustal thinning [17]. The Bouger gravity data modeling confirm the block faulting nature of the basin and crustal thinning beneath rifted areas.
The study area lies in the northeastern part of Sirt basin, between latitudes 28˚40'N and 29˚00'N and longitudes 19˚41'E and 19˚56'E (Figure 3). It covers an area of about 375 km2 and comprises the the Nasser, Ain Gharbi and Meghil oil fields.
2. Objectives
With the recent shortage of energy resources, the possible use of geothermal energy as an alternative source has received much attention. In the past, geothermal studies attract the attention of a few research workers in different countries, because of scarcity of the subsurface thermal data. Lately, active drilling operations in exploring for oil and gas in Sirt basin, Libya, yield a lot of bottom hole temperatures at different depths, that helps to study the subsurface distribution of the geothermal gradients, estimation of the heat flow values and relating their variations to the subsurface geology, and the geothermal identification of the study area.
3. Materials and Methodology
The present study is based mainly on the following materials:

Figure 3. The geographic location and enlarged map of the study area showing the well locations, numbers and oil fields.
1) A total number of 176 bottom hole temperatures (BHT’s) gathered from the logs of 70 deep exploratory wells. Locations of these wells are shown in Figure 4. The bottom hole temperatures do not necessarily represent the static (true) formation temperatures, but are usually lower by values ranging between 3.9˚C to 21˚C [18]. This is because these temperatures are mostly affected by the drilling and borehole disturbances, such as, the cooling effect of drilling fluid circulating at the bottom of the boreholes, which reduces the measured BHT values than true formation temperatures. Therefore, corrections for drilling disturbances must be applied to the bottom hole temperatures [19].
2) A total number of 22 static formation temperatures gathered from the Drill Stem Test (DST). These values represent the true formation temperatures. These temperatures are based on high flow volumes of oil or water from the producing formation and considered the most reliable (true) temperature data for calibration.
3) Lithological and litho-stratigraphic data of the subsurface rock units gathered from the composite logs of the available wells.
The process of reconstructing basin temperature from an analysis of the BHT data can be generalized into three steps. First, raw data are extracted from well log and screened. Inconsistent or implausible data are excluded at this stage. Second, raw BHT's data are corrected for drilling disturbances. Third, the corrected temperature data are averaged through some interpretative model that reduces the random error in individual measurements.

Figure 4. Linear regression of the bottom hole temperature (BHT's) and their corresponding static formation (DST) temperatures.
In the present study, an attempt was made to correct the bottom hole temperatures for the drilling and disturbances. Twenty two pairs of BHT and their depth-equivalent DST values were statically fitted to derive algorithm for correcting the BHT’s values from the extraneous factors that reduce them from the true (static) formation temperatures. This algorithm was based on a linear regression (No.1) between the BHT’s and their depth-equivalent DST temperatures (Figure 4).
(1)
where, Y is the corrected (static) formation temperature and X is the Bottom Hole Temperature (BHT).
The least square fit of these temperatures is reported by the solid line denoted “A” (Figure 4). A sort of correlation has been made between the fitting of this equation and those established for similar purpose by other authors; among them, [18] [20] and [21]. The correlation shows that, the slope of the linear equation “A” that derived in the present work, is identical to that arrived by [18], while different from that of the equations arrived by [20] and [21].
Consequently, a number of temperature, geothermal gradient and sub-crop slices at different depths as well as isotherm geologic cross sections have been constructed. These slices and cross sections are used for verifying the lateral as well as the vertical variations of the subsurface temperature and geothermal gradient in the study area.
4. Results and Discussions
1) Estimation of the heat flow
Traditionally, geothermal studies have concerned with estimating heat flow, although temperature is the actual quantity of interest. However, heat flow is generally a more useful measure of the thermal state of sedimentary basins than temperature gradient alone because the geothermal gradient may change markedly with depth due to changes in thermal conductivity.
The distribution of heat flow beneath the ground surface is mostly controlled by the structure setting, rate of sedimentation and types of sediments (thermal conductivity) of the studied area. Heat flow is inversely correlated to tectonic age [22] and is depressed by sedimentation.
It can be as high as 90 - 120 mW/m2 or higher in young rift basins (<25 Ma), but it decreases with increasing age. Foreland basins are typically associated with post-Precambrian orogenic belts and therefore tend to have heat flows in the range of 50 - 70 m W/m2. Intracratonic basins generally have moderate heat flows in the range of 30 - 50 m W/m2, reflecting their location on old, stable cratons. Heat flow in basins subject to sedimentation rates higher than 10 m/m.y. can be extremely depressed.
Sedimentary basins are never in complete thermal equilibrium, and groundwater flow may drastically change the distribution of thermal energy within a basin [19]. Heat flow is significantly depressed by sedimentation about 100 m/m.y. or greater, and the depression persists long after sedimentation ceases (assuming no erosion). The magnitude of depression depends on the thermal conductivity of the sediments deposited and the rate and duration of sedimentation. The lower the thermal conductivity of the sediments, the greater the reduction in heat flow.
The thermal conductivity of rocks and sediments is an intrinsic physical property depends on their mineralogy, grain size, grain shape, and grain arrangement as well as porosity. Mineralogy is the most important factors. However, the major influence on conductivity is the proportion of high conductivity components (Quartz, halite, anhydrite, and dolomite), intermediate?conductivity calcite and low conductivity clay minerals, and other layer silicates [23]. The bulk thermal conductivity depends on both the solid rock component and the pore fluid, as follow:
(2) [19]
where Kpr is the bulk thermal conductivity of a rock, km is the thermal conductivity of the solid particles of a rock, kw is the water thermal conductivity and F is the porosity.
The thermal conductivity of most clastic sedimentary rocks is inversely correlated to their clay content. The in-situ thermal conductivity of most sedimentary rocks is in the range of about 1.0 - 4.5 W/mK (Deming, 1994). Most shales are probably less than 1.5 W/mK, while carbonates tend to fall in the range of 2 - 3 W/mK (Blackwell and Steel, 1989). Pure sandstones are of values between 7.1 and 2.8 W/mk, while the very clayey sandstones range from 2.1 and 1.9 W/mK [23]. Comprehensive compendia of thermal conductivity data are given by [24] [25] and [26].
However, any relatively thick stratigraphic section composed of a variety of different lithologies tends to have conductivities that are relatively high and some relatively low. A useful rule of thumb is that the average thermal conductivity of a section containing diverse lithologies is about 2.5 W/m K [19]. It is unusual to find a lithological diverse section of sedimentary rocks with an average thermal conductivity lower than 1.5 W/m K or higher than 3.0 W/m K.
Heat flow is never measured but instead estimated from equation of the Fourier’s law of heat conduction (Equation (3)), by making measurements of temperature and thermal conductivity.
(3) [19]
where q is heat flow, k is thermal conductivity and g is the thermal gradient.
The heat flow, thermal conductivity and overburden thickness are of equal importance in determining subsurface temperature as follow:
(4) [19]
where T is the subsurface temperature at specific depth, To is the mean annual surface temperature and DZ is the thickness of overburden.
A number of cross-plots have been constructed between the calculated geothermal gradients, corrected formation temperatures, and the heat flow values versus the depth (Figures 5(A)-(C)).
These crossplots indicate the following:
・ The study area has relatively wide range of the geothermal gradient (<20 up to >60˚C/Km) at the depth < 1000 m below the ground surface. At deeper depths (down to 2000m) this range diminishes, recording gradient values ranging from <20 - 40˚C/Km (Figure 5(A)).
・ The (static) formation temperature values show a general increasing trend with depth (Figure 5(B)) with a logarithmic least square fitting Y= −1909.67 × Log(X) + 6594.88, where X is the corrected temperature and Y is the depth of interest.
・ The crossplot of the estimated heat flow values versus depth (Figure 5(C)) show distribution behavior identical to that detected with the geothermal gradients (Figure 5(A)). This reflects the direct relation of both the geothermal gradient and the heat flow values as well as the secondary role of the rock thermal conductivity in controlling the heat flow distribution in the studied area.
2) Interpretation of the thermal data
A number of iso-temperatures, iso-geothermal gradient, sub-rop maps at successive depths and isotherm geological cross sections (Figures 6-20) have been constructed for the upper two kilometers of the study area. These are for verifying the subsurface geothermal picture of the study area, and its relation to the overall subsurface geologic setting of the
a) Three local areas of relatively high geothermal gradients (40 -> 60˚C/Km) and formation temperatures (40˚C - 76˚C) have been detected east and west of the Nasser and SW of the Ain Gharbi oil fields (Figure 6, Figure 8 and Figure 10). These abnormal thermal conditions are restricted to the shallow depth of the investigated interval (300 - <1000 m below the ground surface). These localities are considered as semi-thermal areas according to the classification of geothermal areas of [27] and [28].
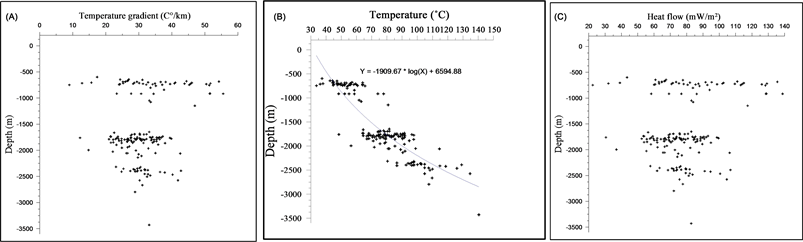
Figure 5. Cross plot relationships of (A) Geothermal gradient versus depth, (B) Temperature versus depth and (C) Heat flow versus depth.
The rest of the area is dominating by relatively low geothermal gradients and down to the maximum depth of investigation (40 - <20˚C/Km, Figure 6(B), Figure 8(B), Figure 10(B), Figure 12(B) and Figure 14(B)). Therefore, it is considered as non-thermal area.
b) The heat flow slice maps at depths <1000 m below the ground surface (Figure 7(B), Figure 9(B) and Figure 11(B)) show values ranging from 20 to >130 mW/m2 all over the study area. The higher values of this range (>100 mW/m2) are restricted to the areas of relatively higher geothermal gradient (see Figure 6(B), Figure 8(B) and Figure 10(B)). These areas are located east and west of the Nasser and SW of the Ain Gharbi oil fields, which may contain low-grade aquifer capable of producing hot water of low grade.
c) Downward to the depth 2000 m below the ground surface, these heat flow values obviously decrease recording values ranging from 80 to <20 mW/m2. According to [29], the detected local areas of abnormal high geothermal gradient (40 - >60˚C/Km) and heat flow values (100 - >130 mW/m2) are distinguished as tectonically subsided areas.
d) By contrast, the rest of the area that has relatively low geothermal gradients (40 - <20˚C/Km) and heat flow values (80 - <20 mW/m2) is considered to be of stable tectonic setting.
e) The sub-crop maps show that the Miocene (sandstones and shales) dominates in the subsurface of the studied area to a depth 300 m (Figure 7(A)). Downward the Oligocene (sandstones, shales and carbonates) predominates until depth 500 m with some M-U Eocene and Miocene occurrences (Figure 9(A)).
At deeper depths (1000 - 1500 m below the ground surface) the subsurface of the area is dominating totally by the Eocene (carbonates) with some local Paleocene occurrences (Figure 11(A) and Figure 13(A)). At depth 2000 m below the ground surface, different rock associations of Eocene, Paleocene and Cretaceous ages are present with different areal extensions and lithologies (Figure 15(A)). Comparison of these sub-crop slices with those of the geothermal gradient, temperature and heat flow reveals that the recognized localities of the abnormal geothermal (semi-thermal areas), are confined mainly to the Miocene and Oligocene rock units in the studied area.
3) Relations of the geothermal behavior and the geological context
Roughly, 40% of surface heat flow on the continents comes from a superficial layer of radioactively enriched crystalline rocks. The remaining 60% come from a combination of radioactive sources in the lower crust and upper mantle, as well as a connective flux into the base of the thermal lithosphere [30]. Temperature of sedimentary basin fill is more likely to be sensitive to intrabasin factors, which are listed in Table 1. Among these factors are structure, groundwater flow and thermal conductivity of rock, which play the utmost role in the geothermal behavior of sedimentary basin fill.
The subsurface structural sections of the study area have been portrayed by the isotherms (Figures 16-19). Inspection of these sections reveals the followings:

Figure 6. (A) Iso Temperature and (B) Geothermal gradient maps at 300 m.

Figure 7. (A) Subcrop and (B) Heat flow distribution maps at depth 300 m.

Figure 8. (A) Iso Temperature and (B) Geothermal gradient maps at 500 m.

Figure 9. (A) Subcrop and (B) Heat flow distribution maps at depth 500 m.

Figure 10. (A) Iso Temperature and (B) Geothermal gradient maps at 1000 m.
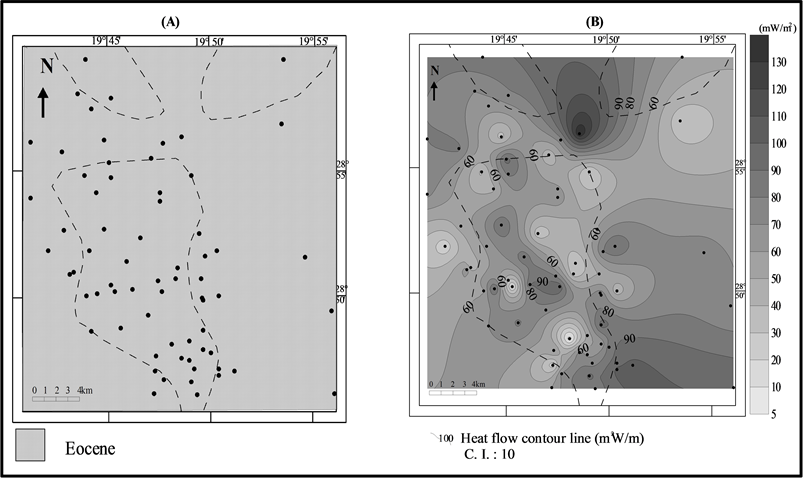
Figure 11. (A) Subcrop and (B) Heat flow distribution maps at depth 1000 m.

Figure 12. (A) Iso Temperature and (B) Geothermal gradient maps at 1500 m.

Figure 13. (A) Subcrop and (B) Heat flow distribution maps at depth 1500 m.

Figure 14. (A) Iso Temperature and (B) Geothermal gradient maps at 2000 m.

Figure 15. (A) Subcrop and (B) Heat flow distribution maps at depth 2000 m.

Table 1. Factors controlling temperature in sedimentary basin fill [19].
a) The first and the second tectonic phases of [31] highly affected the studied sequence and gave rise to erosion of some Paleozoic and Mesozoic rock units. The third tectonic phase highly affected the studied area and gave rise to strong variations in the Paleocene and Eocene thickness all over the studied area and./or their absence in some localities.
b) This erratic distribution of the thickness reflects different cycles of subsidence not excluding rejuvenation of the faults pre- or syn-deposition of these rock units.
c) The fourth tectonic phase of the Sirt Basin highly affected the studied area and caused lateral as well as vertical variations in the thickness of the Oligocene and Miocene sequences. The thickness of these rock units are decreased at some localities (Figure 16) and occasionally absent (Figures 16-18) giving rise to the Miocene unconformably overlying the older sediments. This erratic distribution of the thickness reflects also different cycles of subsidence intervening with uplifting and erosion processes with rejuvenation of the faults before and during the deposition of these rock units.
Therefore, from the above mentioned results, it can be noted that the subsurface structural setting of the studied area plays a considerable role in the heat redistribution and transfer from the deeper origins to the shallower depths.
The heat capacity of water (~4200 J/kg K) is more than four times as high as the average matrix component of sedimentary rocks [19]. The extent to which heat flow (or the geothermal gradient) is enhanced or reduced by upward or downward movement of groundwater depends on the Darcy (volumetric) velocity and depth of fluid circulation. For downward percolation through 1000 m at a Darcy velocity of 1 cm/yr, the conductive surface heat flow (and geothermal gradient) is reduced by 41%.
Interpretation of the isothermal-geologic cross sections (Figures 16-19) suggested that the heat is mainly transported by the upward movement of the groundwater (along the faults). However, little or no heat transfer is caused by the horizontal movement of groundwater, particularly at depths < 1000 m in the studied area. This can be demonstrated from the isotherms, which are almost parallel to the ground surface. By contrast, at deeper depths (>1000 m below the ground surface), the upward and/or downward movements of the groundwater appear to have a considerable role in modifying the geothermal behavior and redistributing the heat within the sedimentary sequence at these depths.
The isothermal-geologic cross sections (Figures 16-19) present the lateral and the vertical distribution of the lithostratigraphic rock units encountered in the subsurface of the area as follows:
1) The sediments of the first tectonic phase are represented by the Cambrian-Ordovician rocks, which are partially penetrated by some of the studied wells (Figure 16 and Figure 19). These are composed mainly of coarse grained, cross-bedded sandstones with intervening shales and siltstones of variable

Figure 16. Isothermal geologic cross section along the profile A-A’.

Figure 17. Isothermal geologic cross section along the profile B-B’.

Figure 18. Isothermal geologic cross section along the profile C-C’.

Figure 19. Isothermal geologic cross section along the profile D-D’.

Figure 20. The geothermal classification of the study area.
thickness.
2) The sediments of the second phase are represented by the Upper Cretaceous sequence that is encountered in most of the studied wells (Figures 16-19). These sediments are mainly sandstones with carbonate.
3) The sediments of the third phase are represented by Paleocene and Eocene carbonates sequences (Figures 16-19).
4) The sediments of the fourth tectonic phase are mixed assemblage of Oligocene marine and non-marine sediments. They are composed mainly of sandstones with shale layers (Figures 16-19). With the sea regression, the continental Miocene sediments are deposited, which are mainly sandstones with clay intercalations.
Therefore, the sandstones and carbonates with clay and shale intercalations are the common rock types in the studied area. The heat generation of sandstone and limestone is very low, while the heat generation of shale is relatively high due to its richness of radioactive minerals. By contrast, the thermal conductivity of sandstones and carbonates is relatively high compared to that of the shales. Thus, the effect of the lithology radioactivity in the heat generation in the studied area is very low, while it has a considerable role in the heat transfer.
5. Conclusion
The geothermal behavior of the Sirt basin was studied using corrected BHT’s with the aid of the static formation temperatures (DST). A linear regression equation was derived from the fitting of the BHTs and the DST. The corrected BHTs based on this equation were used for calculating the geothermal gradients and heat flow values at different depths. The results were presented laterally in the form of iso-parametric slices and isothermal-geologic cross sections. Interpretation of these geothermal data in the light of the subsurface geology of the study area revealed that the study area is generally identified as Non-thermal. However, a shallow, local subsurface Semi-thermal reservoir of Oligo-Miocene age has been delineated (at depths < 1000 m). This reservoir has relatively high geothermal gradient (40 - >60˚C/Km), temperatures ranging from 40˚C to 76˚C and heat flow values ranging from 80 to >130 mW/m2. This reservoir is located to the east and west of the Nasser and SW of the Ain Gharbi oil fields, which may contain low-grade aquifer capable of producing hot water. At deeper depths (>1000 m until the maximum depth of investigation), the area has more or less moderate to low geothermal gradients that range from 40 to <20˚C/Km and heat flow < 80 to <20 mW/m2. The study indicates that the vertical and the lateral variations of the formation temperatures, geothermal gradients and the heat flow values are controlled by the structural, groundwater movements as well as lithological and thermal characteristics of the subsurface sequence.
Acknowledgements
The authors express their indebtedness to the management of the Exploration Department of the Sirt Oil Company, Breqa, Libya, for providing the raw data of this study.
Conflicts of Interest
The authors declare no conflicts of interest regarding the publication of this paper.
Cite this paper
Al-Rashed, A., Shaaban, F. and Yousef, A. (2019) The Geothermal Regime in Sirt Basin, Libya: The Geological Role and Heat Flow Studies. International Journal of Geosciences, 10, 57-79. https://doi.org/10.4236/ijg.2019.101005
References
- 1. Thomas, P. (2007) A Field Guidebook to the Geology of Sirt Basin, Libya. RWE Dea North Africa/Middle East GmbH.
- 2. Van Houten, B.F. (1983) Sirt Basin, North-Central Libya. Cretaceous Rifting above a Fixed Hotspot. Geology, 11, 115-118.
https://doi.org/10.1130/0091-7613(1983)11<115:SBNLCR>2.0.CO;2 - 3. Harding, T.P. (1984) Graben Hydrocarbon Occurrences and Structural Styles. Bulletin American Association Petroleum Geologists, 68, 333-362.
- 4. Van Der Meer, F. and Cloetingh, S. (1993) Late Cretaceous and Tertiary Subsidence History of the Sirt Basin (Libya); an Example of the Use of Back Stripping Analysis. Journal of International Institute for Aerospace Survey and Earth Sciences (ITC), 93, 68-76.
- 5. Anketell, J.M. (1996) Structural History of Sirt Basin and Its Relationship to the Sabratah Basin and Cyrenaica Platform, Northern Libya. In: Salem, M.J., Busrewil, M.T., Misallati, A.A. and Sola, M.A., Eds., The Geology of Sirt Basin, III, Elsevier, Amsterdam, 57-89.
- 6. Wennekers, J.H.N., Wallace, F.K. and AbuGares, Y.I. (1996) The Geology and Hydrocarbons of the Sirt Basin. In: The Geology of Sirt Basin, Proceedings of the First Symposium on the Sedimentary Basins of Libya, Tripoli, 10-13 October 1993, Vol. III, Elsevier publishers, Amsterdam, 1-56.
- 7. Hallett, D. (2002) Petroleum Geology of Libya. Elsevier, Amsterdam, 503 p.
- 8. Abadi, A.M. (2002) Tectonics of the Sirt Basin: Inferences from Tectonic Subsidence Analysis, Stress Inversion and Gravity Modelling. PhD thesis, Univ. Vrije, Holland, 187 p.
- 9. Mansour, A.T. and Magairhy, I.A. (1996) Petroleum Geology and Stratigraphy of the Southeastern Part of the Sirt Basin, Libya. In: The Geology of Sirt Basin, Proceedings of the First Symposium on the Sedimentary Basins of Libya, Tripoli, 10-13 October 1993, Vol. II, Elsevier publishers, Amsterdam, 485-528.
- 10. Goudarzi, G.H. (1980) Structure-Libya. In: Salem, M.J. and Busrewil, M.T., Eds., The Geology of Libya, Academic Press, London, 879-892.
- 11. El Makhrouf, A.A. (1996) The Tibesti-Sirt Orogenic Belt, Libya. In: Salem, M.J., Busrewil, M.T., Misallati, A.A. and Sola, M.A., Eds., The Geology of Sirt Basin, III, Elsevier, Amsterdam, 107-121.
- 12. Busrewil, M.T., Mriheel, I.Y. and Al Fasatwi, Y.A. (1996) Volcanism, Tectonism, and Hydrocarbon Potential of Parts of Al Haruj Area, SW Sirt Basin, Libya. In: Salem, M.J., Busrewil, M.T., Misallati, A.A. and Sola, M.A., Eds., The Geology of Sirt Basin, III, Elsevier, Amsterdam, 317-329.
- 13. Klitzsch, E. and Ziegert, H. (2000) Short Notes and Guidebook on the Geology of the Dor el Gussa-Jabal Bin Ghanimah Area. Sedimentary Basins of Libya, 2nd Symp., Geology of Northwest Libya. ESSL, Tripoli, 52 p.
- 14. Peregi, Z.S., Less, G.Y., Konrad, G.Y., Fodor, L., Gulacsi, Z., Gyalog, L., Turki, S.M., Suwesi, S.K., Sherif, K. and Dalub, H. (2003) Geological Map of Libya, 1:250.000, Al Haruj Al Abyad Sheet NG 33-8 with Explanatory Booklet. IRC, Tripoli, 250 p.
- 15. Andrew, A.N., Suleiman, I.S., Roy, R.F., Pursell, B., Suleiman, A.S., Doser, D.I. and Keller, G.R. (1996) Terrestrial Heat Flow in the Sirt Basin, Libya, and the Pattern of Heat Flow across Northern Africa. Journal of Geophysical Research: Solid Earth, 101, 17737-17746.
https://doi.org/10.1029/96JB01177 - 16. Suleiman, I.S., Keller, G.R. and Suleiman, A.S. (1993) Gravity Study of the Sirt Basin, Libya. In: Salem, M.J., Sbeta, A.M. and Bakbak, M.R., Eds., The Geology of Libya, Vol. 6, Academic Press, London, 2461-2468.
- 17. Gras, R. (1996) Structural Style of the Southern Margin of the Messla High. In: Salem, M.J., et al., Eds., The Geology of the Sirt Basin, Vol. 3, Elsevier, Amsterdam, 201-210.
- 18. Fertl, W.H. and Wichman, P.A. (1977) How to Determine Static BHT from Well Log Data. World Oil, 105-106.
- 19. Deming, D. (1994) Overburden Rock, Temperature and Heat Flow. In: Magoon, L.B. and Dow, W.G., Eds., The Petroleum System from Source to Trap, AAPG Memoir 60, 1243-1254.
- 20. Khidr, I.H. (1987) Geothermal Studies on Subsurface Formations in the Nile Delta & Its Fringes, Egypt. M.Sc. Thesis, Fac. of Science, Al-Azhar University, Nasr City, 176 p.
- 21. Zaghloul, Z.M., Shaaban, F.F. and Yousef, A.F. (1995) Subsurface Quaternary Geothermal Reservoir in the Nile Delta Area. Journal of Environmental Sciences, 9, 187-204.
- 22. Morgan, P. (1984) Constraints on Rift Thermal Processes from Heat Flow and Uplift. Tectonophysics, 94, 277-298.
https://doi.org/10.1016/0040-1951(83)90021-5 - 23. Brigaud, F., David, S., Chapman, S. and Douaran, S.L. (1990) Estimating Thermal Conductivity in Sedimentary Basins Using Lithologic Data and Geophysical Well Logs. The American Association of Petroleum Geologists, 74, 1459-1477.
- 24. Clark, S.P. (1966) Thermal Conductivity. In: Clark, S.P., Ed., Handbook of Physical Constants, GSA Memoir 97, 459-482.
https://doi.org/10.1130/MEM97-p459 - 25. Kappelmeyer, O. and Haenel, R. (1974) Geothermics with Special Reference to Application. Gebruder Borntraeger, Berlin, 238 p.
- 26. Roy, R.F., Beck, A.E. and Touloukian, Y.S. (1981) Thermo-Physical Properties of Rocks. In: Touloukian, Y.S., Judd, W.R. and Roy, R.F., Eds., Physical Properties of Rocks and Minerals, McGraw-Hill CINDAS Data Series on Material Properties, Vol. 11-12, 409-502.
- 27. Armstead, H.C. (1983) Geothermal Energy, Its Past, Present and Future Contributions to Energy Needs of Man. 2nd Edition, London, New York, 289 p.
- 28. Twidel, J.W. and Weir, A.D. (1986) Renewable Energy Resources. Cambridge University Press, Cambridge, 365 p.
- 29. Lee, T.C. (1982) Estimation of Formation Temperature and Thermal Property from Dissipation of Heat Generated by Drilling. Geophysics, 47, 1577-1584.
https://doi.org/10.1190/1.1441308 - 30. Pollack, H.N. and Chapman, D.S. (1977) On the Regional Variation of Heat Flow, Geotherms, and the Thickness of the Lithosphere. Tectonophysics, 38, 279-296.
https://doi.org/10.1016/0040-1951(77)90215-3 - 31. Baird, D.W., Abu Rawi, R.M. and Bailey, N.J.L. (1996) Geohistory and Petroleum in the Central Sirt Basin. The Geology of Sirt Basin, Proceeding of the 1st Symposium on the Sedimentary Basins of Libya, Tripoli, 10-13 October 1993, Vol. 3, 3-56.