International Journal of Geosciences
Vol.4 No.10(2013), Article ID:41170,9 pages DOI:10.4236/ijg.2013.410131
Estimation of Snowmelt Infiltration into Frozen Ground and Snowmelt Runoff in the Mogot Experimental Watershed in East Siberia
Research Institute for Global Change JAMSTEC, Yokohama Institute for Earth Science, Yokohama, Japan
Email: skazu@jamstec.go.jp
Copyright © 2013 Kazuyoshi Suzuki. This is an open access article distributed under the Creative Commons Attribution License, which permits unrestricted use, distribution, and reproduction in any medium, provided the original work is properly cited. In accordance of the Creative Commons Attribution License all Copyrights © 2013 are reserved for SCIRP and the owner of the intellectual property Kazuyoshi Suzuki. All Copyright © 2013 are guarded by law and by SCIRP as a guardian.
Received July 18, 2013; revised August 19, 2013; accepted September 16, 2013
Keywords: Permafrost; Active Layer; Watershed; Sublimation
ABSTRACT
Understanding how spring runoff is generated in East Siberia during the spring thaw is important to predicting river flows. To evaluate the snowmelt runoff generated, a simple runoff model was developed. The model involves processes of water and energy balance within the snowpack and energy balance within soil, snowmelt infiltration into the frozen ground, and surface runoff. The model reproduced inter-seasonal and seasonal variations of snow depth, active layer depth within soil, and snowmelt runoff. Snowmelt infiltration into frozen ground within the upper 20 cm of soil was also reproduced by the model. Thus, we believe the model can simulate snowmelt infiltration and surface runoff in the Mogot experiment watershed. The model suggested that the inter-annual variation in infiltration determined the amount of spring runoff. The amount of infiltration during thaws exceeded the discharge; the range was from 20 to 60 mm and the percentage of infiltration to melt water was 44% to 60%. Therefore, infiltration into the frozen ground strongly determined snowmelt runoff. In addition, ongoing climatic change can increase snowmelt runoff, because of less sublimation loss and snowmelt infiltration into the frozen ground.
1. Introduction
Snowmelt is one of the most significant river runoff events in permafrost-dominated watersheds. Recently, Iijima et al. [1] showed an abrupt increase in the depth of the active layer because of changes in snow cover and precipitation. This indicates changes in the active and snow layers in the permafrost watersheds. To predict the river flow in these permafrost watersheds, it is important to understand the physical mechanisms which underlie hydrological processes.
There have been many hydrological studies in permafrost and seasonal frost regions [2-8]. Will et al. [2] showed that spring runoff depended on the soil moisture level in the preceding fall. Woo and White [9] showed that permafrost and seasonal permafrost were important for hydrological processes. Roulet and Woo [4] showed that frozen ground affected runoff processes. Nyberg et al. [7] observed that when frozen soil absorbed a large amount of precipitation, the runoff was insignificant. Thus, to estimate the snowmelt runoff, it is important to evaluate the infiltration of water into frozen ground.
Frozen soil can absorb snowmelt water during a thaw, making it difficult to estimate the snowmelt runoff. Consequently, many studies have examined the effects of infiltration into frozen ground [5,10-16]. Experimental studies have examined infiltration into various soils in Russia [10]. Granger et al. [12] showed that most melt water reached a depth of about 17 ± 10 cm (mean ± SD) in frozen soil. Therefore, most of the melt water in frozen soils infiltrated to a maximum depth of about 27 cm. Gray et al. [13] showed that snowmelt infiltration strongly depended on snow water equivalent and fall soil moisture, and presented a simple empirical model to estimate snowmelt runoff.
Numerical approaches to snowmelt infiltration have been developed for Russia [10,11], Sweden [5,14], and Canada [15]. These models include many parameters to estimate infiltration into frozen ground. However, it is often difficult to apply numerical models in the field because of difficulties in quantifying some of the parameters required.
In a parametric approach to snowmelt infiltration, Gray et al. [13] produced a simple model to estimate infiltration. Recently, Zhao and Gray [16] presented a parametric model to estimate snowmelt infiltration, based on theoretical and experimental results. Parametric models that evaluate infiltration using field data should prove useful for estimating snowmelt runoff at a watershed scale.
Many studies have investigated snowmelt infiltration into frozen soil. However, it is not clear how snowmelt infiltration affects snowmelt discharge in permafrostdominated watersheds. Suzuki et al. [17] implied that the amount of snowmelt infiltration could affect snowmelt runoff generation. To identify how snowmelt infiltration could affect snowmelt runoff, it is necessary to develop models that include the process of snowmelt infiltration into frozen ground. In the present study, we develop an empirical and physically based surface runoff model to evaluate the relationships between snowmelt infiltration and runoff.
The State Hydrological Institute of Russia carried out long-term observations of the water and energy balances in the Mogot experimental watershed, in the mountains of southeastern Siberia, Russia, for the ten years from 1976 to 1985 [18]. The watershed was completely covered by deep permafrost. These data are used in this study to determine model parameters and verify its simulated results.
The objective is to establish an empirical and physically based model to evaluate snowmelt runoff after accounting for the effect of snowmelt infiltration into the permafrost, and to test the model with existing data sets.
2. Methodology
2.1. Site Description
The Mogot experimental watershed is located in the southern mountainous taiga of eastern Siberia (55.5˚N, 124.7˚E) approximately 60 km north of Tynda, in the Amur region of Russia. The site is the catchment of the Nelka River. The basin is 12 km long and 2.5 km wide, and has a total area of approximately 30.8 km2. Slopes within the basin are exposed to the northeast and southwest and altitudes range from 580 to 1130 masl. Hydrometeorological observations were carried out in this region from 1976 to 1985.
Figure 1 shows the location of the study site. Forest covers nearly 90% of the watershed and is dominated by larch (Larix gunmeria), although ridges are partially covered by birch and pine forests. The remaining area of the
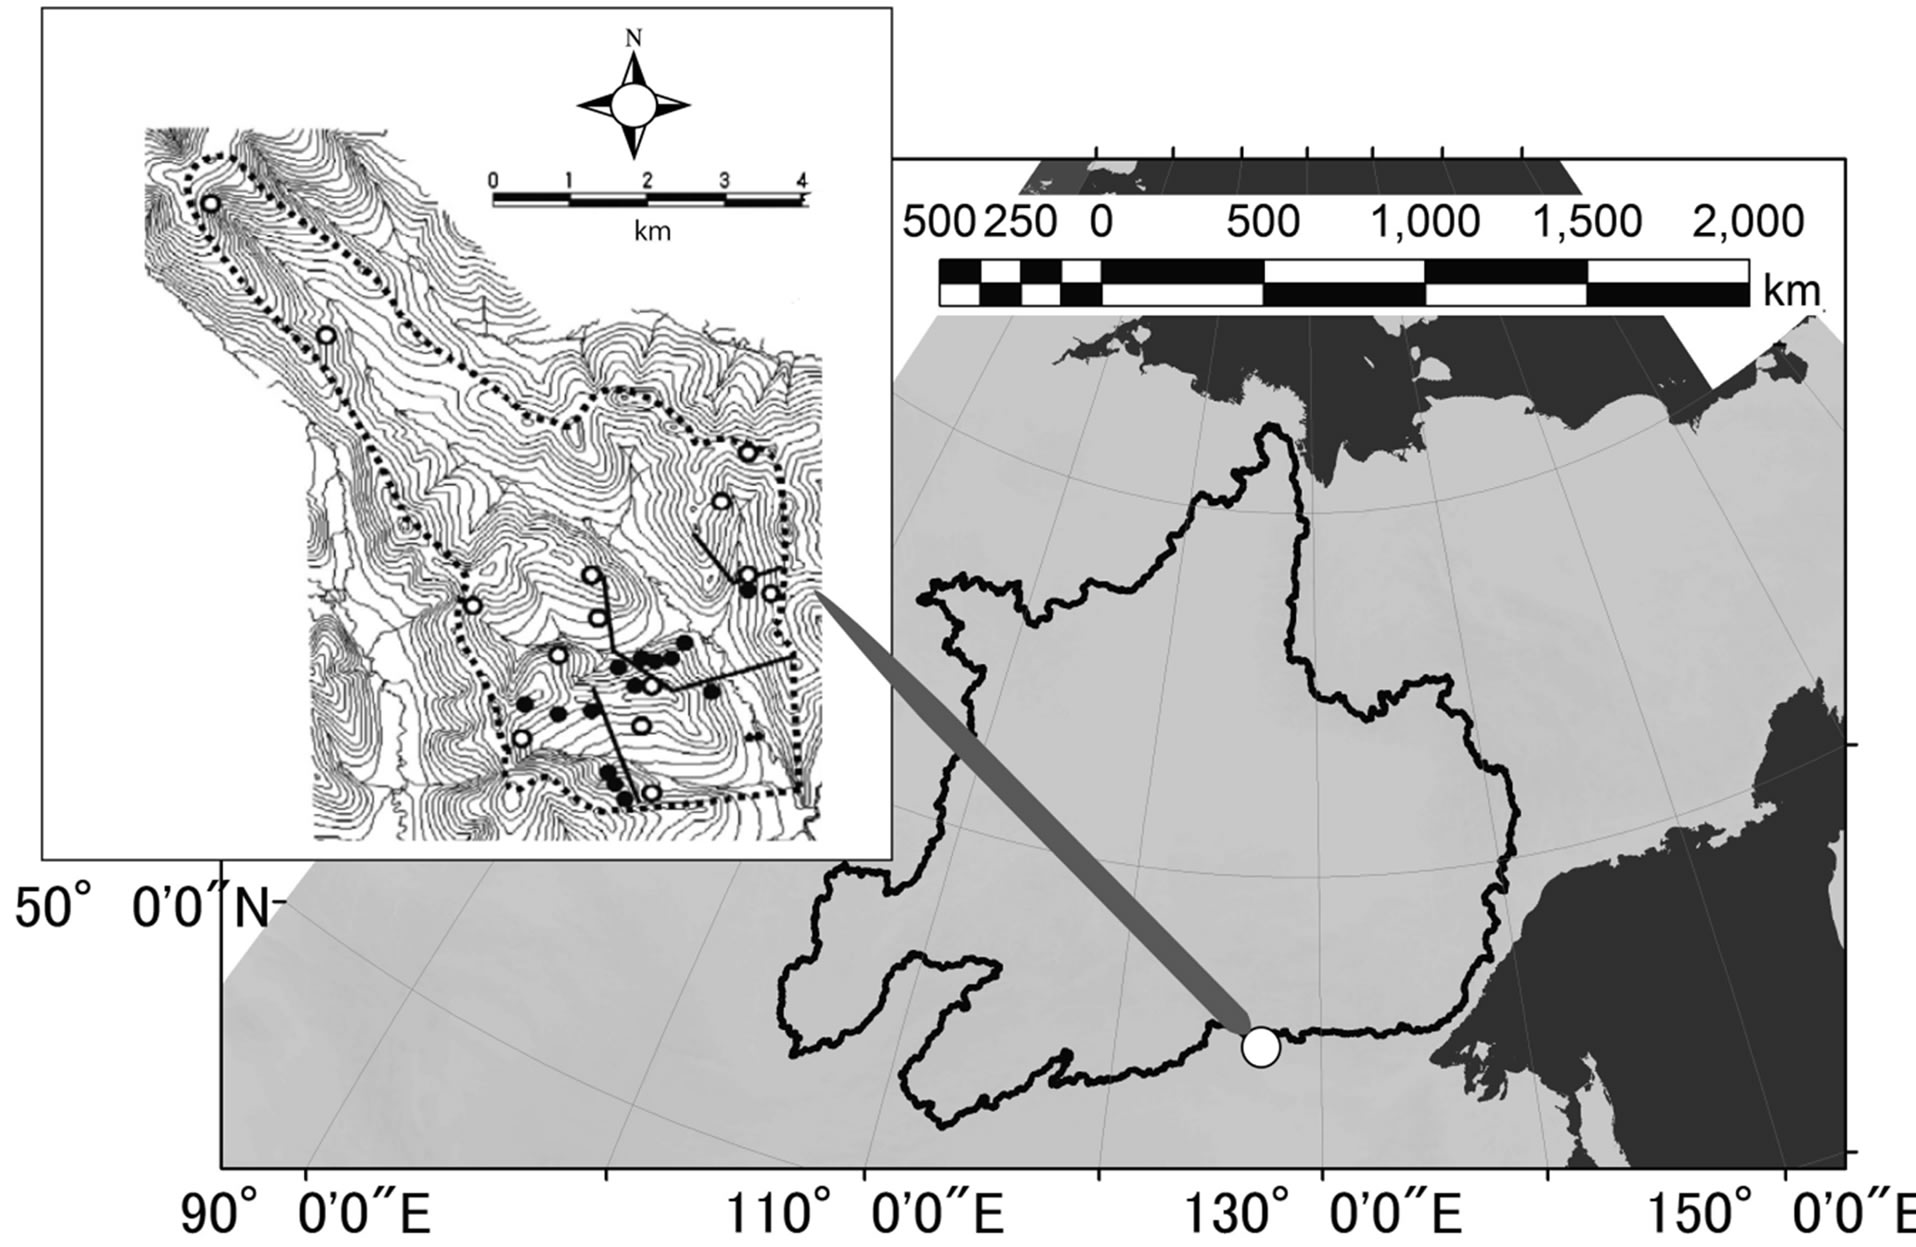
Figure 1. Location of the Mogot experimental watershed. An inset denotes topography and observations of the Mogot experimental watershed. Open circles indicate locations of precipitation gauges, closed circles indicate locations of active layer measurement, and solid lines indicate courses for the snow survey.
watershed is covered by grassland. Meteorological observations were carried out at an open site in the watershed at an altitude of about 610 m. The snow water equivalent was measured in a snow survey along the snow course and thaw depth was observed at more than 18 points within the watershed (Figure 1). Here, we use the area average data for the snow water equivalent and thaw depth around the watershed.
2.2. Data
Daily data for hydrometeorological elements (air temperature, relative humidity, wind speed, cloud amount, surface temperature, air pressure, river discharge, soil moisture, thaw depth within the soil, and snow water equivalent) were recorded from 1978 to 1983. The site of each observation is shown in Figure 1. Dryand wetbulb temperatures, and wind speed were measured at a height of 2 m above the soil surface. The details of each observation method can be found elsewhere [17,19-21]. In this watershed, the annual maximum air temperature exceeded 30˚C; the annual minimum air temperature was below −45˚C; and the mean annual air temperature was about −7.7˚C. Most of the runoff occurred from July to September.
Yang and Ohata [22] considered wind loss of winter precipitation to be important. Therefore, the bias-correction method for the Trecyakov precipitation gauge described by Yang and Ohata was adopted as:
 (1)
(1)
 (2)
(2)
 (3)
(3)
Where, CR is the catchment ratio of a Trecyakov precipitation gauge (%) for each type of precipitation, WS is the daily mean wind speed (m∙s−1), and Tmax and Tmin are the daily maximum and minimum air temperature (˚C). The boundary air temperature between snow and rain was assumed to be 1.5˚C. Figure 2 shows the mean seasonal variation in the discharge and precipitation for the watershed from 1979 to 1983.
A water year was considered to run from 1 October the previous year to 30 September in the current year. From November to April, the river was completely frozen. Runoff began in May and the maximum discharge occurred from July to September.
2.3. Estimation of the Energy and Water Balance for the Watershed
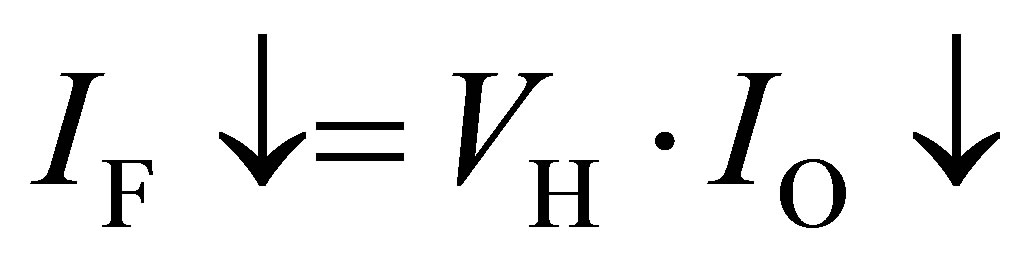
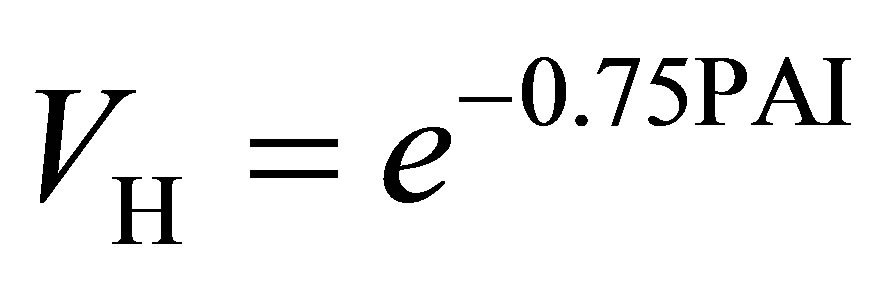
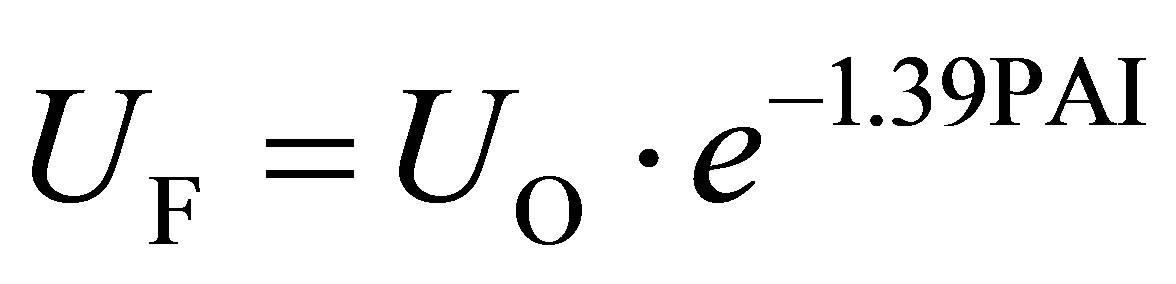
SNTHERM [23] was used to evaluate the water and energy balances for snow-covered frozen ground. Accordingly, the input meteorological elements were air temperature, relative humidity, wind speed, air pressure, and cloud amount. All of the meteorological elements were reported using daily values. The model of Suzuki and Ohta [24], which was developed to predict snowmelt in a larch forest, was used to evaluate the meteorological elements for the forested sites. The fundamental equations of the model are:
 (4)
(4)
 (5)
(5)
 (6)
(6)
 (7)
(7)
 (8)
(8)
Where, I↓ and L↓ are the incident short-wave and long-wave radiation (Wm−2), respectively, VH is the hemispherical sky view factor, σ is the Stefan-Boltzmann
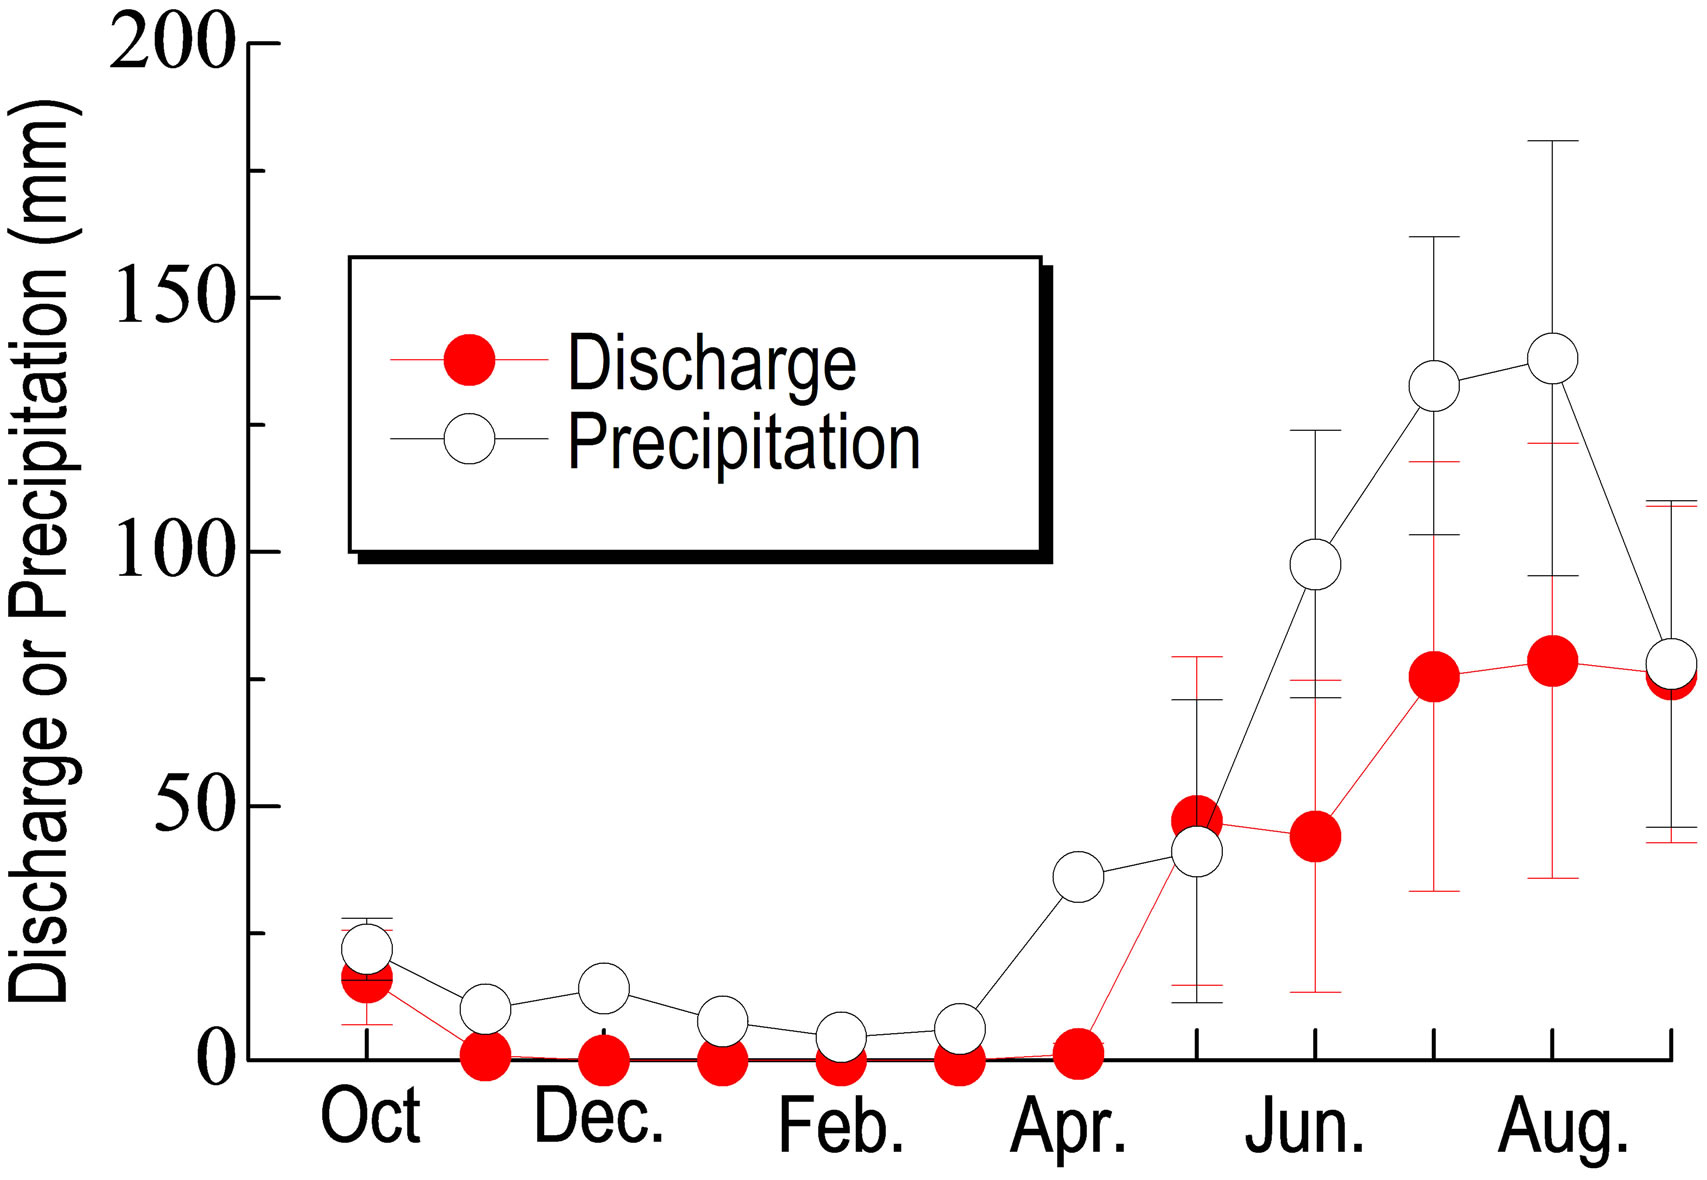
Figure 2. Seasonal variations in 5 years of averaged discharge and precipitation with standard deviations. The vertical bars indicate the standard deviation of discharge and precipitation.
constant (5.67 × 10⁻⁸ J∙kg−1∙K−4), Ta is air temperature (˚C), U is the wind speed (ms−1), a is the snow albedo, and PAI is the plant area index (m2∙m−2). The subscripts “O” and “F” denote open and forested sites, respectively. A value of PAI = 0.4 measured on April 2001 at a representative site was used. Equation (8) was used only during the snowmelt period.
The water and energy balance above the snow and soil were estimated from 1 September to the end of the next August, using the snow model. The initial condition of permafrost on 1 September was given by the observational values.
2.4. Estimation of the Snowmelt Infiltration and Runoff
To estimate snowmelt runoff, a simple bucket model was used to estimate the discharge during the thaw. If the melt water volume exceeds the capacity of the water to infiltrate the frozen ground, then runoff occurs. Using a simple bucket model, the discharge and the amount of infiltration into frozen ground were estimated.
First, to estimate the spring runoff, a lumped hydrological model was used. The water balance is described by
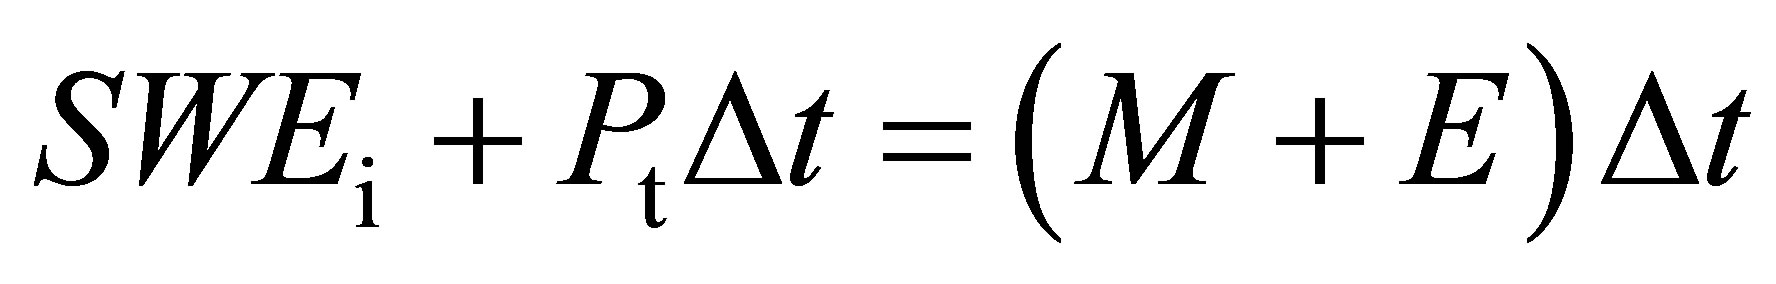 (9)
(9)
 (10)
(10)
fore snowmelt (mm), Pt is the precipitation during a thaw (mm∙h−1), M is melt water at the bottom of the snowpack (mm∙h−1), E is evaporation from the snow surface (mm∙h−1), INF is infiltration into frozen soil (mm∙h−1), D is discharge (mm∙h−1), S is stored water in the moss (mm), and  is the duration of a thaw (h). The snow model was used to estimate the melt water at the bottom of the snowpack (M) and sublimation from the snow surface (E). Discharge (D) was estimated using the storage water function for surface flow from [25]:
 (11)
(11)
Where S is the surface water storage of moss or the bottom of the snowpack, and K is a constant (= 10 mm2/5∙h3/5). It was assumed that K might change with the spatial distribution of the snow water equivalent within the forest, because if the snow water equivalent has a large spatial distribution, the snow will disappear in some places and more melt water will be retained in other places. Giesbrecht and Woo [26] showed large spatial variation in the snow water equivalent in a sparse boreal forest site. The spatial distribution of the snow water equivalent was observed within a typical forest. An observation grid (30 × 40 m) was made to examine the spatial snow water equivalent from mid-March 2002 to early April 2002. The snow water equivalent in each sub-grid (10 × 10 m) was determined, using 19 snow gauges to measure snow depth. The snow depth at each snow gauge and the total snow density were measured every day. To evaluate the spatial distribution of the snow water equivalent within the forest site, the coefficient of deviation of the snow water equivalent within a forest site normalized to a mean snow water equivalent of 100 mm was used. The normalized coefficient of deviation is given by:
 (12)
(12)
Where SDx is the standard deviation when the mean snow water equivalent is x at the forest site (mm), SD100 is the standard deviation when the snow water equivalent is 100 mm in the forest site (mm), and x is the mean snow water equivalent at the forest site (mm). Figure 3 shows the normalized coefficient of deviation for the snow water equivalent at the 19 points (NCD) and the averaged snow water equivalent for the 19 points. When the mean snow water equivalent exceeded 90 mm, the spatial distribution of the snow water equivalent was insignificant and hence NCD is nearly unity. Conversely, when the mean snow water equivalent was less than 40 mm, then the spatial distribution of the snow water equivalent was more than 3 times larger. Because of the spatial snow distribution, it was decided to include this effect on K. The relationship in Figure 3 was used to evaluate the modified K value. Consequently, K is described by:
 (13)
(13)
Where SWE is the mean snow water equivalent at a forest site (mm). SWE was estimated using SNTHERM.
To evaluate the infiltration into permafrost, the model of Zhao and Gray [16] was used:
Figure 3. Relationship between the normalized coefficient of deviation in snow water equivalent (NCD) and the mean snow water equivalent for a typical forest site in the Mogot experimental watershed from mid-March 2002 to early April 2002.
 (14)
(14)
Where, C is a constant (mm∙h−1), S0 is the surface soil moisture saturation, SI is the initial soil moisture saturation within the upper 40 cm, TI is the initial soil temperature within the upper 40 cm (K), and t is the time snowmelt has to infiltrate (h).
To evaluate the infiltration into frozen ground using Equation (14), one needs only to determine the surface soil saturation (S0) and the value of C, because the other variables were observed. Johnsson and Lundin [5] showed that the infiltration rate into frozen ground decreased with soil temperature. Here, it is assumed that the surface soil saturation was influenced by the surface soil temperature at the bottom of the snowpack (TS). Figure 4 shows the relationship between the surface soil temperature (TS) and the observed soil surface moisture within the upper 5 cm of soil (S0) in 1981 and 1983, during the thaw period. There is a good correlation. Using the least squares method, the following relationship can be obtained:
 (15)
(15)
Where TS is the surface soil temperature at the bottom of the snowpack (K). The temporal variation in the surface soil saturation (S0), can now be estimated using the SNTHERM snow model. The second unknown (C) was estimated from the 1981 discharge data. Using the observed soil moisture within the upper 20 cm, it was assumed that SI was 0.48. A fit of the daily discharge in 1981 was performed, using Equations (9)-(11) and (13)- (15), and obtained C = 6.0 mm∙h−1. This value of C was larger than that for a boreal forest obtained in [16] for a boreal forest, perhaps because of the large porosity at this experimental site, which exceeded 0.85.
Figure 4. Relationship between the observed surface soil saturation within the upper 5 cm of soil and the estimated boundary surface soil temperature in 1981 and 1983 during thaw periods.
In Equation (14), four parameters can be used to estimate the infiltration into frozen ground. Table 1 shows the average values of these parameters during the study period. The largest changes in the parameters in Equation (14) were in the surface soil saturation (S0) and the time for infiltration (t). The duration of the opportunity time for infiltration should increase as snow water equivalent increases. The opportunity time for infiltration affected the total amount of infiltration.
3. Verification
3.1. Snow and Active Layer Depth
Figure 5 shows the seasonal variation in snow water equivalents from 1979 to 1983. The estimated snow water equivalents agreed well with the observed values. The estimated snow disappearance dates also agreed with the observed dates.
Figure 6 shows the observed and simulated active layer depth. The active layer depth was averaged within the Mogot experimental watershed as shown in [21]. The estimated active layer depth agreed well with the observed active layer depth. The root mean square errors of active layer depth from 1979 to 1983 are 0.24 m in 1979, 0.11 m in 1980, 0.12 m in 1981, 0.09 m in 1982 and 0.08 m in 1983, respectively. Except for 1979, the root mean square errors are small. Therefore, it can be concluded that the estimated active layer depth was reasonably reproduced in the simulation.
Overall, the model estimates were verified using the observed snow water equivalent and active layer depth, and the estimates agreed with the observed values. Therefore, this model satisfactorily estimates the winter energy and water balance above the snow and soil surface. In addition, the one-dimensional estimated snow water equivalents agreed with the mean snow water equivalents within the watershed. Hence, the estimated values are representative for the watershed.
3.2. Snowmelt Infiltration and Runoff
To verify this water balance model, a comparison of the observed and estimated infiltration into frozen ground in 1981 (Figure 7) was performed, because continuous infiltration data were only obtained in that year. The maximum error was about 4 mm and the trend of estimated infiltration mostly agreed with the observed trend. This range of error agreed with the original estimate of [16]. These values were used to estimate the discharge and infiltration in other years.
Table 1. Mean parameters for Equation (14) during the thaws from 1979 to 1983.
Figure 5. Seasonal changes in snow water equivalents in the Mogot experimental watershed from 1979 to 1983. The circles are observed values and the lines are estimated values.
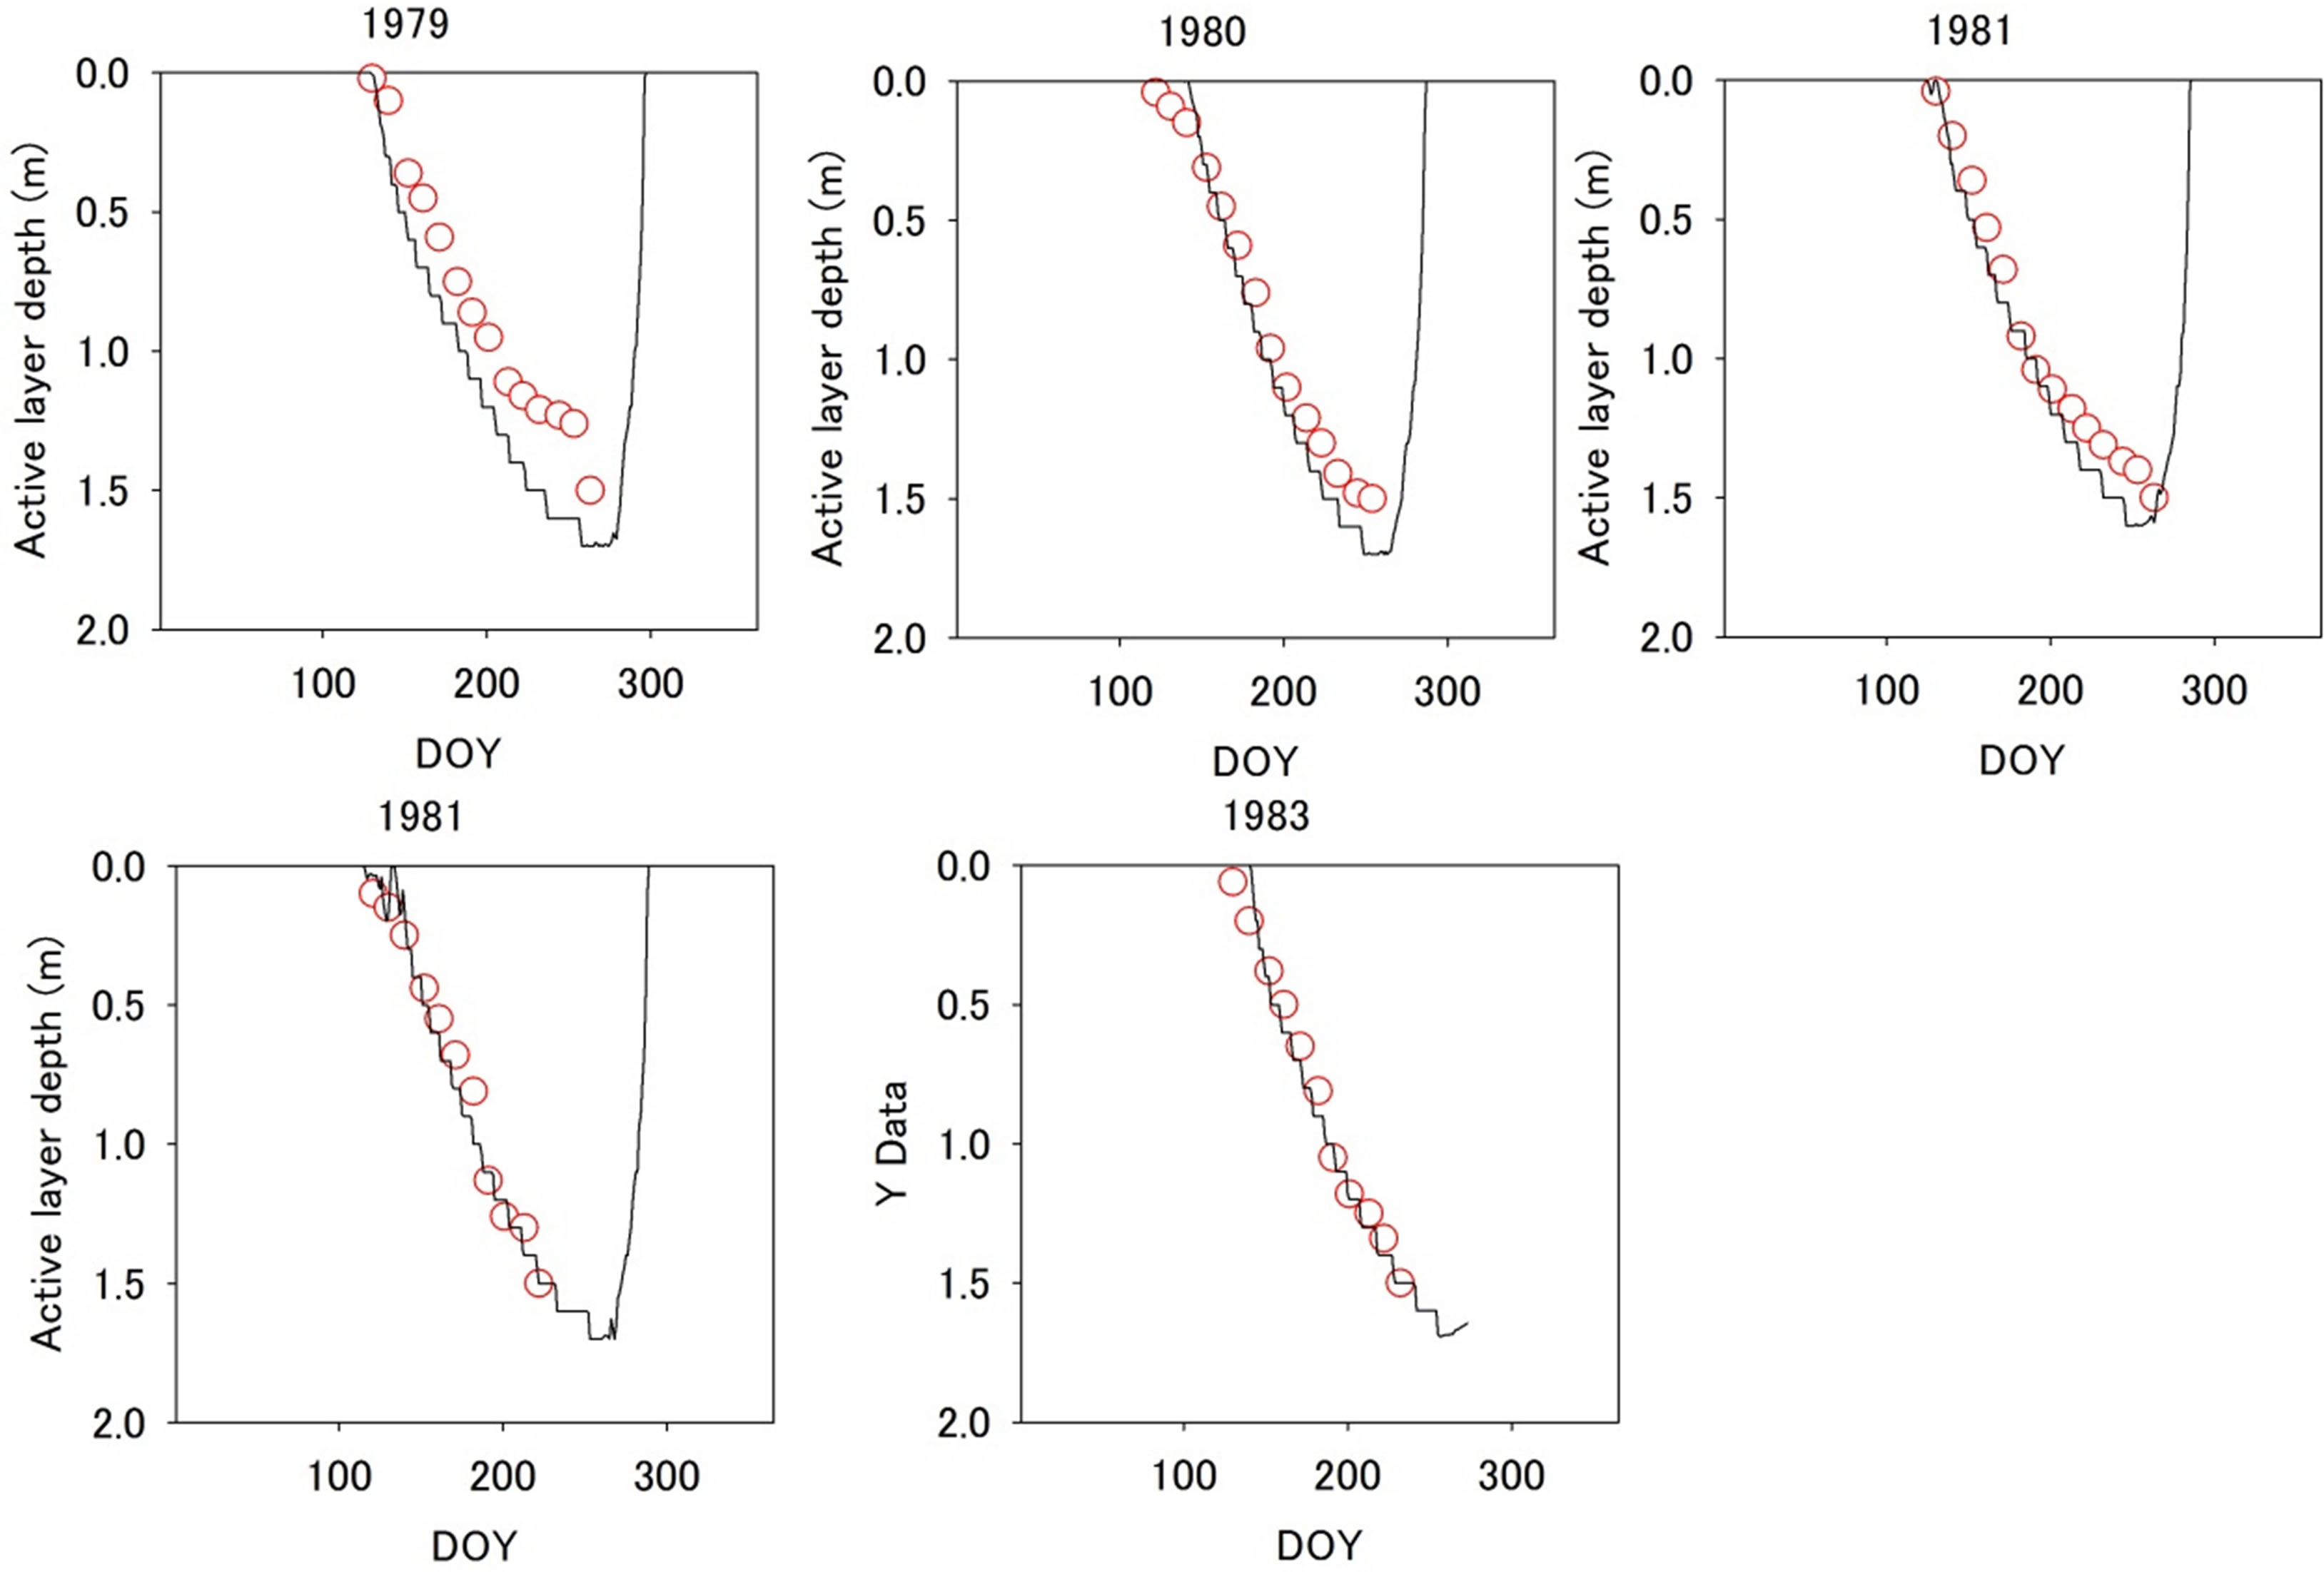
Figure 6. Temporal variations in active layer depth in the Mogot experimental watershed from 1979 to 1983. The circles are observed values and the lines are estimated values.
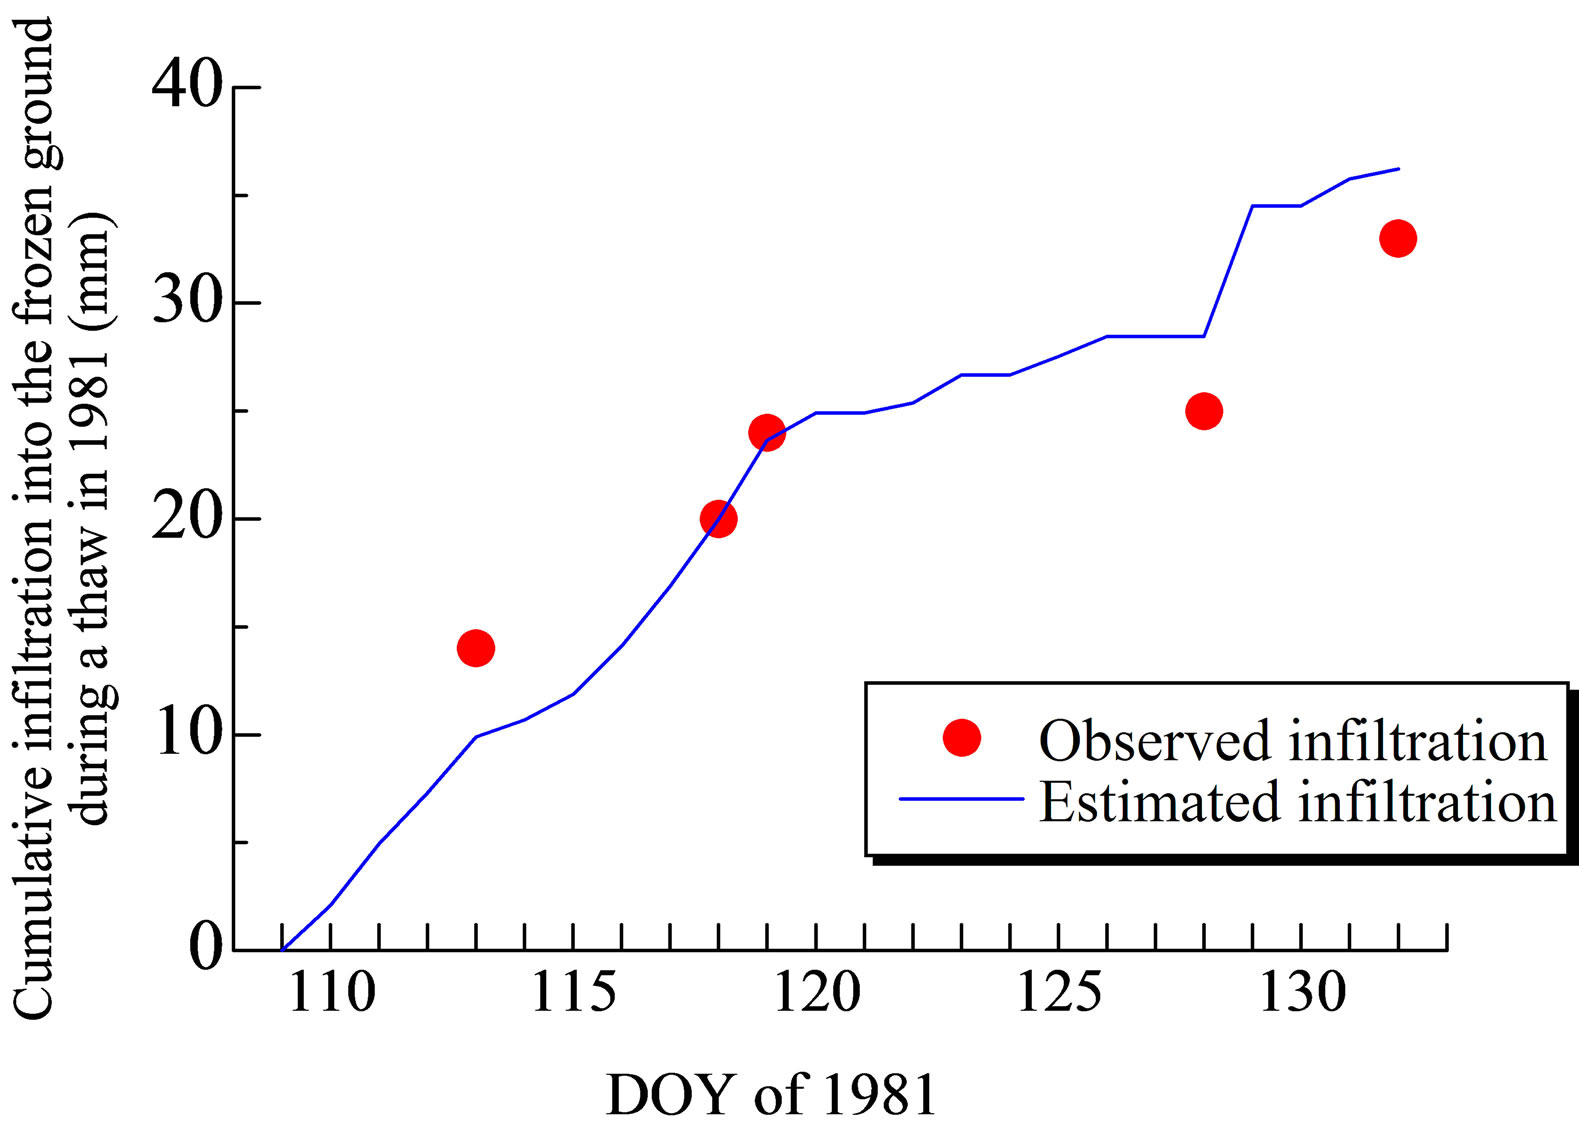
Figure 7. Temporal variation of observed and estimated infiltration into the frozen ground during a thaw in 1981. Circles and lines denote observed and estimated infiltration into frozen ground, respectively.
Figure 8 shows the estimated and observed discharge during thaws from 1979 to 1983. The absolute error of the estimated discharge during thaw was 8.1 mm and the relative error of the estimation was 0.34. When the discharge was large, these errors increased. The model satisfactorily duplicated most of the discharge.
4. Results
4.1. Snow Ablation during a Thaw
Table 2 shows the inter-annual variation in input water into the watershed (initial snow water equivalent plus precipitation during thaw periods), snowmelt, sublime-

Figure 8. Comparison between estimated and observed discharge from the watershed during the thaws from 1979 to 1983.
tion, and mean air temperature during thaw periods. During thaws, the type of precipitation mainly occurred as snowfall because the air temperature was less than 1.5˚C when precipitation occurred. The ratio of snowmelt to input precipitation increased with the mean air temperature. An increase in the snowmelt coincided with the low sublimation that occurred with high air temperatures when the snow disappearance date was delayed, and when the input water equivalent was large.
The contribution of sublimation to snow ablation was higher in 1981 than 1983 although the relative humidity was similar in the 2 years. Therefore, the lower air temperature in 1981 resulted in a large amount of sublimation from the snowpack because the absolute humidity in 1981 was the lowest among the 5 thaws. Overall, when the air temperature was low during the thaw, the contribution of sublimation was nearly 16%. However, when the air temperature was high, the effect of sublimation to snow ablation during the thaw was insignificant. These findings support the results of [20,27].
4.2. Snowmelt Infiltration into Frozen Ground
Here, the inter-annual variation in the infiltration into frozen ground and the limitations of this model is discussed. From Table 3, surface storage water did not vary widely. Therefore, the factor that best determines the snowmelt runoff should be the infiltration into the frozen ground. The amount of infiltration into the permafrost increased with the amount of melt water. Although the melt water in 1980 exceeded that in 1979, the amounts of infiltration did not differ by much and the contribution of infiltration to melt water increased as the amount of melt water decreased. This implies that another factor affected the contribution of the infiltration to melt water.
Regarding the higher surface soil saturation in 1983, the increased surface soil saturation caused the highest runoff during the 5 years. Using a numerical model, Zhao et al. [15] showed that an increase in the surface soil saturation caused higher snowmelt infiltration during a thaw because an increase in the surface saturation increases the capillary pressure gradient acting at the surface and hence the ability of water to infiltrate the soil. It was found that the decrease in the surface temperature was strongly related to an increase in the surface saturation. The soil surface temperature during a thaw is related to the snow water equivalent and the fall soil moisture because large amounts of snow and soil water keep the soil warmer during the winter. In practice, soil saturation in the previous fall was highest at 0.99 in 1983.
The effective depth of frozen soil differed in 1981 and 1983 because the estimated infiltration in 1981 agreed with the change in soil moisture in the upper 20 cm, whereas the estimated infiltration in 1983 was nearly twice the change in the upper 20 cm of soil.
This implies that in 1983 deeper soil layers absorbed melt water. In 1983, the observed infiltration into the upper 20 cm of frozen ground was about 30 mm, versus an estimated infiltration of 60.3 mm during a thaw. This difference resulted from the effective depth of the soil layer because infiltration was estimated to occur to a depth of 40 cm, while observations were made only to 20 cm. This additional 20 cm of soil available for water infiltration could account for the rest of the water. Granger et al. [12] showed that melt water could reach a depth of 40 cm. The inter-annual variation in the surface storage water was small and the amount of storage was 18 - 28 mm during a thaw. The amount of infiltration during thaws exceeded the discharge; the range was from 20 to 60 mm and the percentage of infiltration to melt water was 44 to 60%. Therefore, infiltration strongly determined snowmelt runoff.
5. Discussion
5.1. Implication of Climatic Change Impact in Mogot Experimental Watershed
Here, we discuss the implication of current climate change on snowmelt infiltration and snowmelt runoff in the region, according to the result of the present study. Iijima
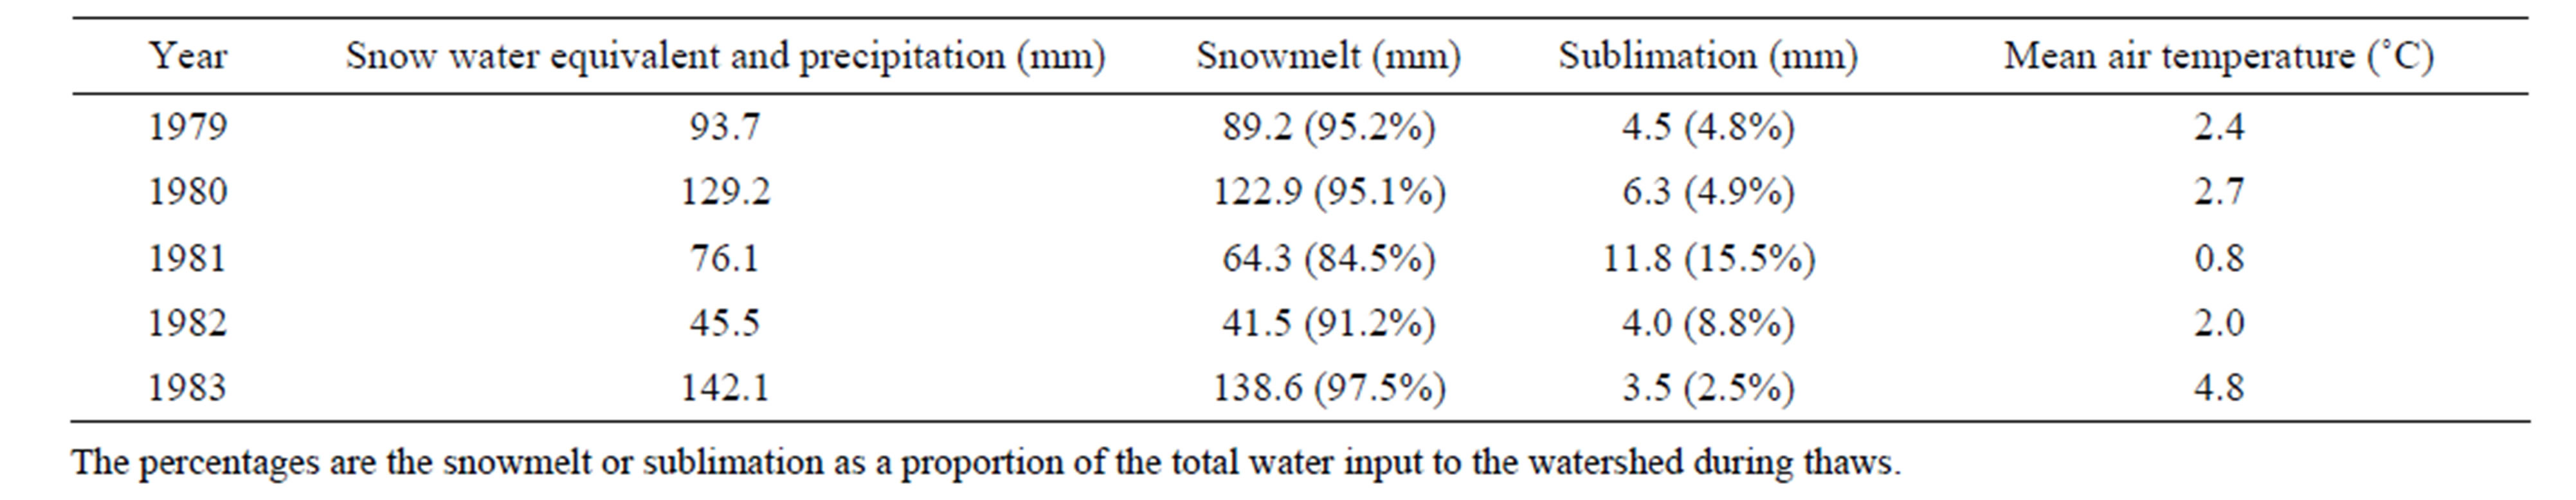
Table 2. Snow ablation components during 5 thaws from 1979 to 1983.
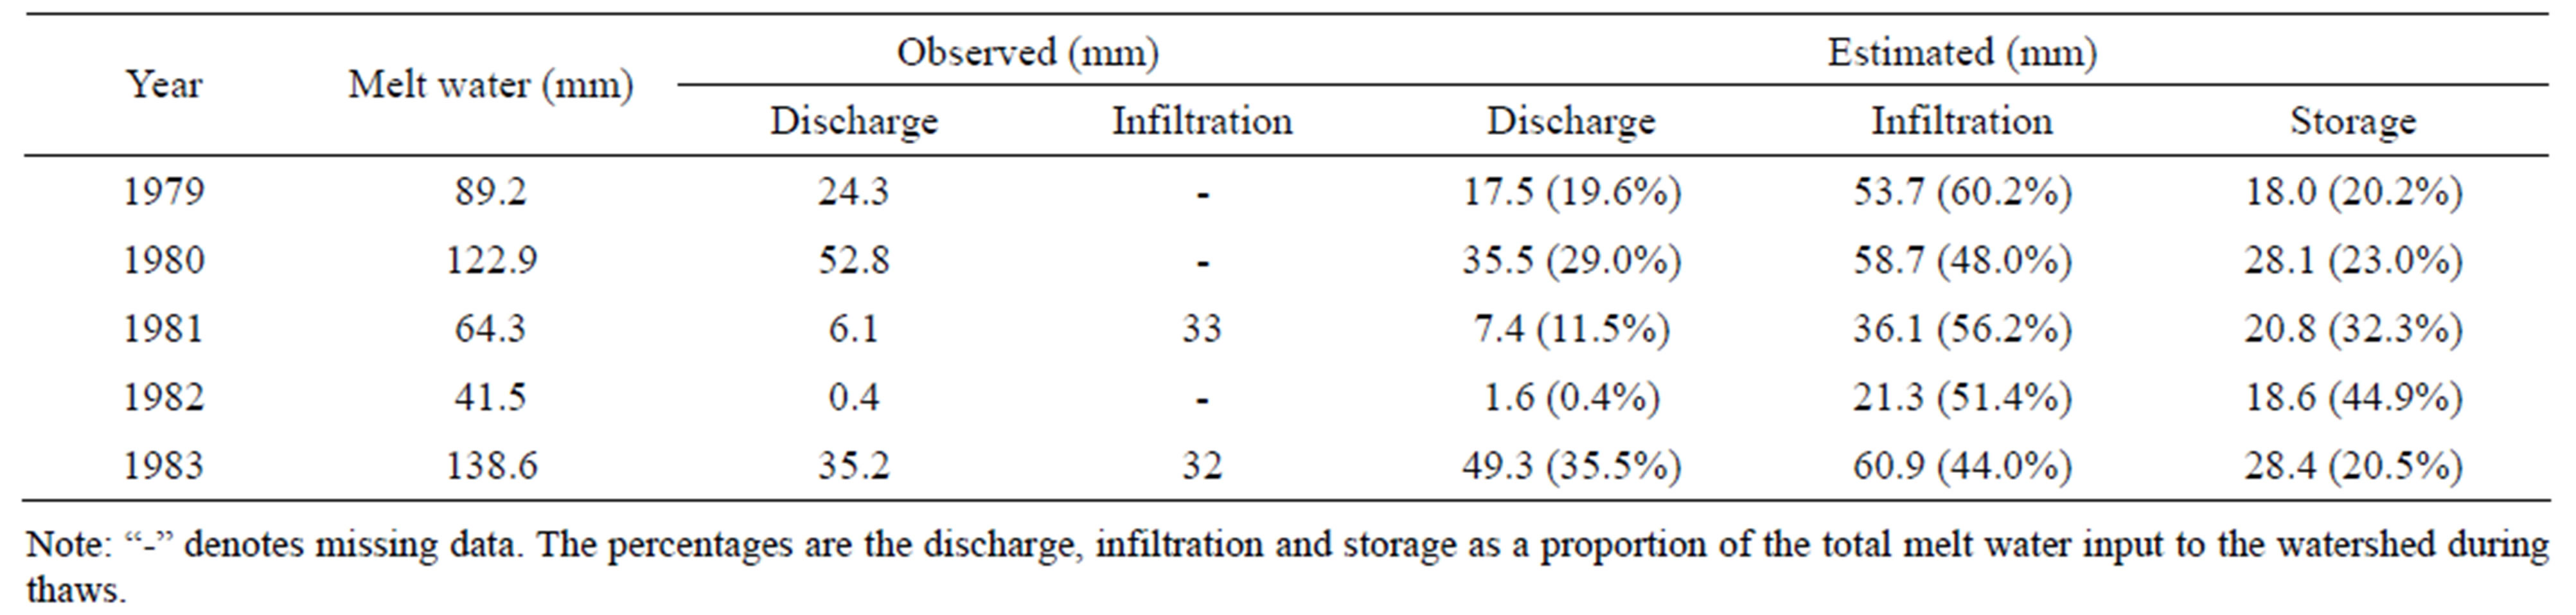
Table 3. Snowmelt runoff components during 5 thaws from 1979 to 1983.
et al. [1] showed an abrupt increase of active layer depth during summer in East Siberia, owing to increasing snow depth and summer rainfall. Serreze et al. [28] showed that winter and autumn surface air temperature dramatically increased in East Siberia from 1966 to 1996. Given these climatic changes in the region, we implicate snowmelt infiltration and surface runoff. As we described in section 4.2, sublimation loss during winter strongly depends on air temperature and humidity. Thus, the increase of air temperature reduces sublimation loss from the snowpack. The increase of snow depth shown in [1] also implies an increase of snow water equivalent in the region. Thus, snow water equivalent should increase because of the warm winter air temperature and deeper snow depth. Iijima et al. also showed an increase of summer precipitation; this contributes to greater saturation under the snowpack. Overall, current regional climatic change can increase snowmelt runoff because of less sublimation loss and greater snowmelt and runoff.
5.2. Limitations of the Results
Finally, the limitations of the current model need to be considered. First, the model presented was developed in the Mogot experimental watershed, and some model parameters were extrapolated by empirical relationships from the watershed data. Therefore, the model may only be applicable to the Mogot watershed. Upon its application to other locations, we must check the applicability of its current empirical parameters. To determine model applicability, we must test it under several climatic conditions with snow-covered frozen ground.
Second, the snow model does not include water movement within the soil layer or any effects of infiltration into the soil layer. Using a numerical model, Zhao et al. [15] showed that infiltration into frozen ground and soil water movement affects the soil temperature because the melt water releases a large amount of energy within the frozen soil layer. This would affect the accuracy of predicted boundary soil temperatures.
6. Conclusions
Meteorological and hydrological data from 1978 to 1983 were analyzed, using the snow and runoff model, which described the seasonal variation in snow water equivalents, active layer, and snowmelt runoff for a representative basin. The data analyses and output of the present model gave the following interesting results:
1) The infiltration was parameterized using the parametric model of Zhao and Gray [16] and changes in infiltration and discharge were estimated. The estimation of simple runoff described the snowmelt runoff generated during a thaw and duplicated the trend in the inter-annual snowmelt runoff.
2) The amount of infiltration during thaws exceeded the discharge; the range was from 20 to 60 mm and the percentage of infiltration to melt water was 44% to 60%. Therefore, infiltration strongly determined snowmelt runoff.
7. Acknowledgements
This study was partly supported by a Grant-in-Aid for Scientific Research (C) of the JSPS (Research Project Number: 20510031) and the Joint Research Program of the Institute of Low Temperature Science, Hokkaido University.
REFERENCES
- Y. Iijima, et al., “Abrupt Increases in Soil Temperatures Following Increased Precipitation in a Permafrost Region, Central Lena River Basin, Russia,” Permafrost and Periglacial Processes, Vol. 21, No. 1, 2010, pp. 30-41. http://dx.doi.org/10.1002/ppp.662
- W. O. Will, C. W. Carlson, J. Alessi and H. J. Haas, “Depth of Freezing and Spring Run-Off as Related to Fall Soil-Moisture Level,” Canadian Journal of Soil Science, Vol. 41, No. 1, 1961, pp. 115-123. http://dx.doi.org/10.4141/cjss61-014
- I. S. Shpak, “Relationship between the Runoff Coefficient and the Moisture Content and Depth of Freezing of the Soil,” Soviet Soil Science, Vol. 1, 1969, pp. 702-706.
- N. T. Roulet and M-K. Woo, “Hydrology of a Wetland in the Continuous Permafrost Region,” Journal of Hydrology, Vol. 89, No. 1-2, 1986, pp. 73-91. http://dx.doi.org/10.1016/0022-1694(86)90144-7
- H. Johnsson and L.-C. Lundin, “Surface Runoff and Soil Water Percolation as Affected by Snow and Soil Frost,” Journal of Hydrology, Vol. 122, No. 1-4, 1991, pp. 141- 159. http://dx.doi.org/10.1016/0022-1694(91)90177-J
- J. B. Shanley and A. Chalmers, “The Effect of Frozen Soil on Snowmelt Runoff at Sleeper Rivers, Vermont,” Hydrological Processes, Vol. 13, No. 12-13, 1999, pp. 1843-1857. http://dx.doi.org/10.1002/(SICI)1099-1085(199909)13:12/13<1843::AID-HYP879>3.0.CO;2-G
- L. Nyberg, M. Stahli, P.-E. Mellander and K. H. Bishop, “Soil Frost Effects on Soil Water and Runoff Dynamics along a Boreal Forest Transect: 1. Field Investigations,” Hydrological Processes, Vol. 15, No. 6, 2001, pp. 909- 926. http://dx.doi.org/10.1002/hyp.256
- M. Stahli, L. Nyberg, P.-E. Mellander, P.-E. Jansson and K. H. Bishop, “Soil Frost Effects on Soil Water and Runoff Dynamics along a Boreal Transect: 2. Simulations,” Hydrological Processes, Vol. 15, No. 6, 2001, pp. 927- 941. http://dx.doi.org/10.1002/hyp.232
- M. Woo and T. White, “The Role of Permafrost and Seasonal Frost in the Hydrology of Northern Wetlands in North America,” Journal of Hydrology, Vol. 141, No. 1-4, 1993, pp. 5-31. http://dx.doi.org/10.1016/0022-1694(93)90043-9
- G. A. Alexeev, I. L. Kaljuzhny, V. Y. Kulik, K. K. Pavlova and V. V. Romanov, “Infiltration of Snowmelt Water into Frozen Soil. The Role of Snow and Ice in Hydrology,” Proceedings of the Banff Symposia, Vol. 1, Geneva, WMO, IAHS, UNESCO, Banff, 1972, pp. 313-325.
- Y. G. Motovilov, “Simulation of Meltwater Losses through Infiltration into Soil,” Soviet Hydrology, Vol. 18, 1979, pp. 217-221.
- R. J. Granger, D. M. Gray and G. E. Dyck, “Snowmelt Infiltration to Frozen Prairie Soils,” Canadian Journal of Earth Sciences, Vol. 21, No. 6, 1984, pp. 669-667. http://dx.doi.org/10.1139/e84-073
- D. M. Gray, P. G. Landine and R. J. Granger, “Simulating Infiltration into Frozen Prairie Soils in Streamflow Models,” Canadian Journal of Earth Sciences, Vol. 22, No. 3, 1985, pp. 464-472.
- L.-C. Lundin, “Hydraulic Properties in an Operational Model of Frozen Soil.” Journal of Hydrology, Vol. 118, No. 1-4, 1990, pp. 289-310. http://dx.doi.org/10.1016/0022-1694(90)90264-X
- L. Zhao, D. M. Gray and D. H. Male, “Numerical Analysis of Simultaneous Heat and Mass Transfer during Infiltration into Frozen Ground,” Journal of Hydrology, Vol. 200, No. 1-4, 1997, pp. 345-363. http://dx.doi.org/10.1016/S0022-1694(97)00028-0
- L. Zhao and D. M Gray, “Estimating Snowmelt Infiltration into Frozen Ground,” Hydrological Processes, Vol. 13, No. 12-13, 1999, pp. 1827-1842. http://dx.doi.org/10.1002/(SICI)1099-1085(199909)13:12/13<1827::AID-HYP896>3.0.CO;2-D
- K. Suzuki, J. Kubota, T. Ohata and V. Vuglinsky, “Influence of Snow Ablation and Frozen Ground on Spring Runoff Generation in the Mogot Experimental Watershed, Southern Mountainous Taiga of Eastern Siberia,” Nordic Hydrology, Vol. 37, 2006, pp. 21-29.
- B. L. Sokolov and V. S. Vuglinsky, “Energy and Water Exchange in Mountain Taiga in the South of East Siberia,” State Hydrological Institute, St. Petersburg, 1997.
- K. Suzuki, et al., “Transport of Organic Carbon from the Mogot Experimental Watershed in the Southern Mountainous Taiga of Eastern Siberia,” Nordic Hydrology, Vol. 37, No. 3, 2006, pp. 303-312. http://dx.doi.org/10.2166/nh.2006.015
- K. Suzuki, et al., “Snow Ablation in an Open Field and Larch Forest of the Southern Mountainous Region of Eastern Siberia,” Hydrological Sciences Journal, Vol. 51, No. 3, 2006, pp. 465-480. http://dx.doi.org/10.1623/hysj.51.3.465
- Y. Yamazaki, J. Kubota, T. Ohata, V. Vuglinsky and T. Mizuyama, “Seasonal Changes in Runoff Characteristics on a Permafrost Watershed in the Southern Mountainous Region of Eastern Siberia,” Hydrological Processes, Vol. 20, No. 3, 2006, pp. 453-467. http://dx.doi.org/10.1002/hyp.5914
- D. Yang and T. Ohata, “A Bias-Corrected Siberian Regional Precipitation Climatology,” Journal of Hydrometeorology, Vol. 2, No. 2, 2001, pp. 122-139. http://dx.doi.org/10.1175/1525-7541(2001)002<0122:ABCSRP>2.0.CO;2
- R. Jordan, “A One-Dimensional Temperature Model for Snow Cover,” Technical Documentation for SNTHERM, Vol. 89, Special Report 91-16, US Army Corps of Engineers, 1991.
- K. Suzuki and T. Ohta, “Effect of Larch Forest Density on Snow Surface Energy Balance,” Journal of Hydrometeorology, Vol. 4, No. 6, 2003, pp. 1181-1193. http://dx.doi.org/10.1175/1525-7541(2003)004<1181:EOLFDO>2.0.CO;2
- X. Ma and Y. Fukushima, “Chapter 11 Numerical Model of River Flow Formation from Small to Large Scale River Basins,” In: V. P. Shigh and D. K. Frevert, Eds., Mathematical Models of Large Watershed Hydrology, Water Resources Publications, LLC, Highlands Ranch, Colorado, 2002, pp. 433-470.
- M. A. Giesbrecht and M.-K. Woo, “Simulation of Snowmelt in a Subarctic Spruce Woodland: 2. Open Woodland Model,” Water Resources Research, Vol. 36, No. 8, 2000, pp. 2287-2295. http://dx.doi.org/10.1029/2000WR900093
- Y. Zhang, K. Suzuki, T. Kadota and T. Ohata, “Sublimation from Snow Surface in Southern Mountain Taiga of Eastern Siberia,” Journal of Geophysical Research, Vol. 109, 2004, Article ID: D21103. http://dx.doi.org/10.1029/2003JD003779
- M. Serreze, et al., “Observational Evidence of Recent Change in the Northern High-latitude Environment,” Climatic Change, Vol. 46, No. 1-2, 2000, pp. 159-207. http://dx.doi.org/10.1023/A:1005504031923