International Journal of Geosciences
Vol.3 No.5(2012), Article ID:24949,17 pages DOI:10.4236/ijg.2012.35106
Gravity and Aeromagnetic Studies of the Filabusi Greenstone Belt, Zimbabwe Craton: Regional and Geotectonic Implications
Physics Department, University of Botswana, Gaborone, Botswana
Email: ranganai@mopipi.ub.bw
Received July 10, 2012; revised August 15, 2012; accepted September 12, 2012
Keywords: Granite-Greenstone Terrain; Gravity Anomalies; Depth Extent; Magnetic Structural Interpretation; Greenstone Belt Evolution; Autochthonous Origin
ABSTRACT
The Filabusi greenstone belt (FGB), Zimbabwe craton, has been geologically remapped relatively recently but its regional tectonic setting and subsurface structure have, until now, remained unresolved. This paper presents gravity and aeromagnetic studies that have been undertaken to provide this important information, and also extend mapping to areas of poor exposure. Several new NNW-trending dykes and structures cutting across the greenstone belt have been revealed, as well as a major extension of one of the metakomatiitic-BIF units, the Shamba Range. ESE-trending dykes identified in the southeast appear on a regional scale to be part of the giant Okavango dyke swarm in northern Botswana. An ~3 km wide NNE-striking magnetic low occurs over the Irisvale-Lancaster shear zone (ILSZ) on the extreme west of the FGB where it roughly marks the boundary with the Bulawayo greenstone belt. Magnetic anomaly trends over ultramafic schists are consistent with strike-slip movement along the ILSZ, and together with the gravity anomalies, support northeasterly directed detachment of the adjacent Fort Rixon belt from the Bulawayo-Filabusi belt. The Bouguer gravity anomaly map shows that the FGB is characterised by a well defined positive anomaly up to 37 mGal, whose symmetry and extent confirm the postulated synclinal structure of the belt. Isolated oval shaped small gravity lows generally correlate with sub-/out-cropping K-rich post-volcanic granite plutons. 2.5 D gravity models along three profiles across the greenstone belt show a simple “basin shape” with a possible maximum depth extent of only 4.5 km, compared to an estimated stratigraphic thickness of about 9.0 km. This suggests a truncation at shallow depth of the structurally repeated lithologies. Gravity data and models support the proposed FGB model; deposition of volcanics in an extensional, structurally determined, evolving basin. This autochthonous setting is consistent with other greenstone belts in the Zimbabwe craton and other parts of the world.
1. Introduction
The south-central Archaean Zimbabwe craton provides important constraints on models for the evolution of the craton as a whole, and the Archaean crust in general [1-7]. This is because parts are reasonably exposed, geologically well mapped and sampled (e.g. [1,7]), and the area contains various mineral deposits [8,9]. The Filabusi greenstone belt (FGB) is one of the greenstone belts in the area that have been remapped relatively recently [10], in keeping with the Zimbabwe Geological Survey (ZGS) efforts of improving the delimitation and description of lithologies as a basis for mineral exploration incentives. Campbell et al. [11] and Campbell and Pitfield [9] have presented a reappraisal of the geology and regional structure of the area, with particular reference to gold exploration. The former also propose a model for the tectonic evolution of the greenstone belt that involves ensialic deposition of volcanics in a small restricted and possibly isolated fault-bounded basin [2,12]. The stratigraphic implications of this “Filabusi model” are that greenstone belts of the Zimbabwe craton perhaps developed within essentially discrete, structurally determined, evolving basins, albeit linked by common, deepseated volcanic processes [13]. This is the autochthonous model preferred for many greenstone belts in the Zimbabwe craton [1,2,6,12-17]. However, Jelsma and Dirks [5] propose another alternative model for the late Archaean evolution of the Zimbabwe craton involving westward stacking of thrust sheets, accommodated by layerparallel shear zones common in several greenstone belts [3,9,13,18]. Other workers argue that the greenstone belts represent fragments of oceanic crust, oceanic plateaus, or island arcs laterally amalgamated with continental fragments during some form of subduction-accretion [5,18- 20].
The regional and structural interpretation used for the Filabusi belt model [11], and the other models, lacks subsurface information that helps discriminate geotectonic models. One of the key factors to understanding the genesis of greenstone belts is a detailed knowledge of their 3D geometry, now commonly provided by geophysics [16,17,21-26]. Because potential field data respond to density and susceptibility changes on surface and at depth, they can be effective in providing clues about the gross structure at depth. However it should be clearly understood that physical models based on potential field data are inherently ambiguous (i.e. more than one model can fit the same data set) and only become definitive if well constrained by other geophysical techniques or geological information and physical property data [26].
The objectives of this paper are to present gravity and aeromagnetic studies undertaken in the Filabusi granitegreenstone terrain to 1) determine greenstone belt subsurface configuration and tectonic setting, 2) extend geological and structural mapping to the near subsurface and areas of poor rock exposure, and hence 3) provide constraints on the proposed Filabusi model. Regional aeromagnetic data are processed and enhanced to provide both lithological and structural information while 2.5 D gravity modelling yields a possible subsurface configuration of the belt constrained by density measurements. The depth extent of the greenstone belt is an important boundary condition for reconstructing the tectonic history that created its present structure. The information derived is important in the geophysical characterisation of greenstone belts of the Zimbabwe craton, and similar terrains elsewhere. It is also hoped that the study will contribute to the ongoing debate on Archaean tectonics in general [1, 25,27-30].
2. Geological Setting
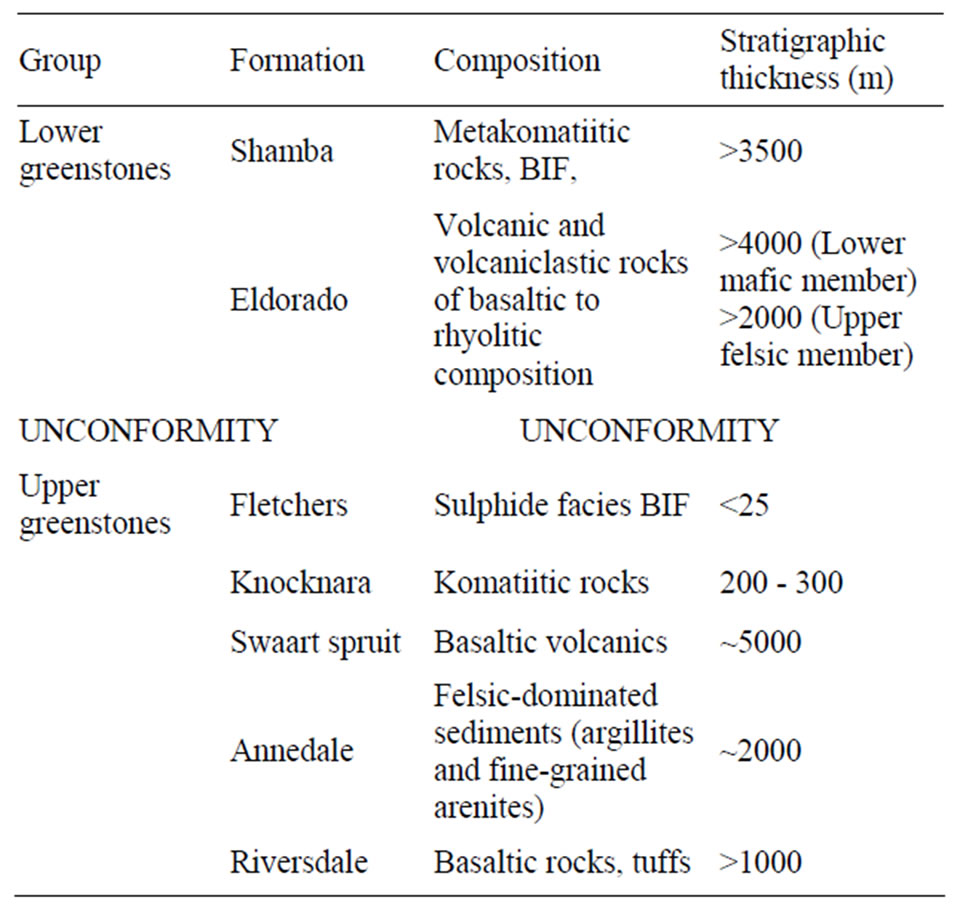
The Filabusi greenstone belt is one of the smaller greenstone belts of the Zimbabwe craton, with a maximum length of 55 km and a maximum width of 20 km, thinning to less than 2 km at its eastern end near the Great Dyke (Figure 1, [10,11]). It has been remapped recently in an effort to update basic geological information required for exploration purposes [9,10]. Like many other greenstone belts in the Zimbabwe craton [2,3,5,31], geological formations are grouped into the ~2.9 Ga Lower and 2.7 Ga Upper Greenstones that are separated by an unconformity (Table 1) [9,10]. Similarly, the structure of the belt is considered to be synclinal in form; a tight, NWto WNW-plunging, asymmetric syncline [11]. The dominant Upper Greenstone formations can be traced in virtual continuity along both limbs of the syn-
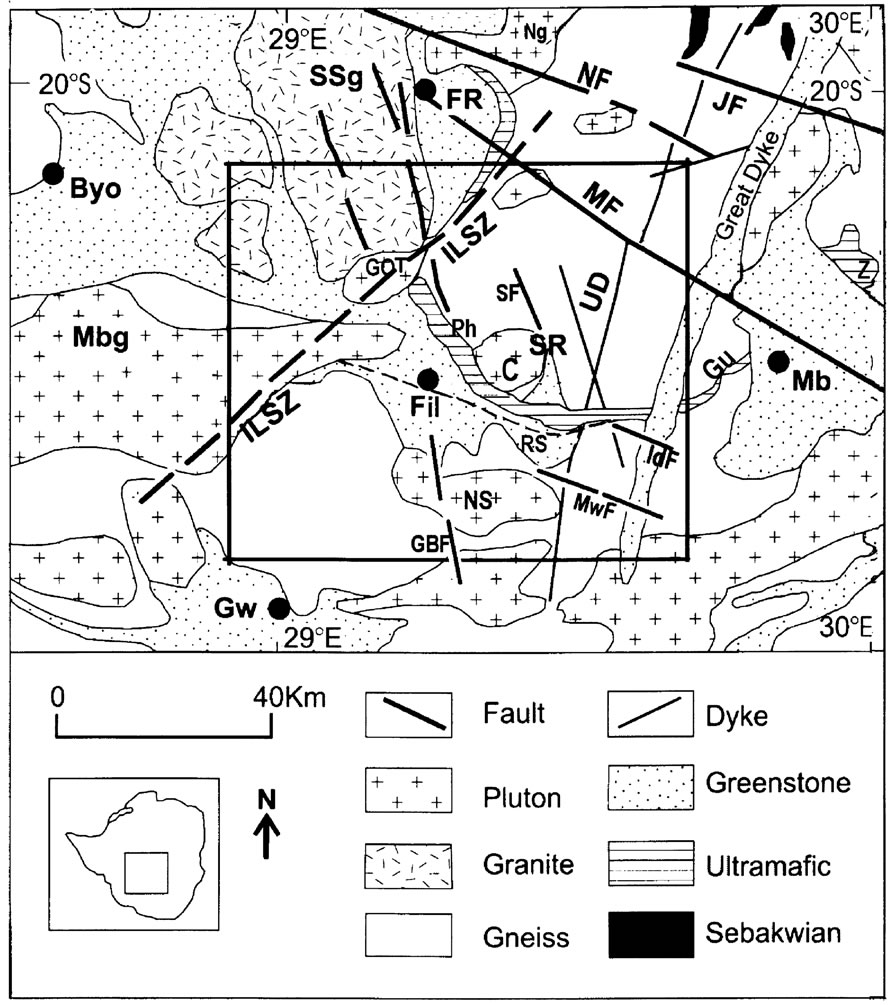
Figure 1. Simplified regional geological map of the Filabusi greenstone belt and surrounding areas. Settlements and greenstone belts labelled are: Byo = Bulawayo, Fil = Filabusi, FR = Fort Rixon, Gw = Gwanda, Mb = Mberengwa; Other units and structures discussed in text are: C= Congese pluton, GBF = Glass Block fracture, GOT = Golden Oriel tonalite, Gu = Gurumba Tumba serpentinite, IdF =Iddo fault, ILSZ = Irisvale-Lancaster shear zone, JF = Jenya fault, Mbg = Mbalabala granite, MF = Mchingwe fault, MwF = Mwenezi fault, NF = Ngomi fault, Ng = Nalatale granite, NS = Ndwangu-Somukamba pluton, Ph = Phurombuzi ultramafic, RS = Redwing shear zone, SF = Shamba fracture, SR = Shamba Range, UD = Umvimeela dyke. Box shows study area covered by geophysical maps.
cline [10,11]. The basement on which the older Lower Greenstones were deposited is not known; most granitic rocks in contact being intrusive [10]. The evolution of the basal formations of the Lower Greenstones is thought to have involved deposition in small restricted and possibly isolated basins during the earliest extensional development of the greenstone belt [10]. The association and trend of the outcrops (e.g., Shamba formation of metakomatiitic lavas with interbedded banded iron formation (BIF) units) suggest that the initial extension was related to NNW-trending fractures; the Glassblock and Shamba Range fractures (GBF, SF; Figure 1). Significantly, similar units occur on the eastern margin of the Fort Rixon belt to the north [9-11] suggesting similar stratigraphic development of the two greenstone belts, and probably across the Zimbabwe craton [11,13,31].
Granitoids of various ages (3.5 - 2.6 Ga) both surround the greenstone belt and intrude it, the oldest of these being the variable tonalites and gneisses that tend to underlie rather flat featureless country around the often more rugged greenstone belt [10]. The youngest include the distinctively undeformed Mbalabala porphyritic granite which transects the western end of the belt and effecttively separates it from the Bulawayo greenstone belt (Mbg, Figure 1; [10,11]). Younger granites produce a less regular terrain than the older granites and gneisses, with the development of exfoliated bornhardts as well as rectangularly-jointed castle kopjes [10]. The Mbalabala granite is considered, together with some other medium to coarse-grained homogeneous granites, to be part of the craton-wide Chiliminazi Suite which is distributed widely across the craton and mark the final stage in the cratonisation/stabilisation of the Zimbabwe block [4,9,10,31]. The Golden Oriole tonalite in the northwest (GO, Figure 1) is the sole representative of the 2.7 Ga Sesombi Suite but it is of relatively minor areal extent [10]; being essentially the southern tip of a much larger block separateing the Bubi-Bulawayo and Shangani-Fort Rixon greenstone belts (SSg, Figure 1; [31,32]).
Ultramafic intrusives of the ~2.7 Ga Mashava Ultramafic Suite [7,31] are widespread, notably the Phurombuzi (Ph) and Pangani serpentinite sills which host several Ni, Cu and asbestos mines (e.g., [8, 33]), the Shamba range (SR) and the Gurumba Tumba serpentinite (GT) which merges with the Belingwe (Mberengwa) belt in the east (Figure 1; [10,11]). The ~2.5 Ga mafic-ultramafic Great Dyke and satellite Umvimeela (mafic) dyke transect the easternmost extremity of the greenstone belt, and some discontinuous outcrops of NNW-trending dykes of Proterozoic age (1.8 - 2.0 Ga; [34]), are shown on the geology map [10]. Other minor mafic intrusions vary in age (mainly post-Upper Greenstones), distribution and trends. The greenstone belt is transected by major shear zones and fractures; most of which control the gold mineralization [9,11]. The dominant structural feature on the published maps is the Redwing Shear zone (RS, Figure 1), a dextral strike-slip fault which constitutes the synclinal axis of the belt [10,11], and along which approximately 9 km of displacement possibly took place. The dextral movement can be related to the extensional or transtensional development of the Filabusi basin, which is reconstructable by restoring the dextral strikeslip component of the shear zone [11]. It seems that the Redwing shear zone had at least three phases of late Archaean to early Proterozoic movement: sinistral transpression, dextral shearing, and brittle dextral faulting [9]. Another important structure is the NE-SW trending Irisvale-Lancaster Shear Zone (ILSZ) marking the junction between the Bulawayo and Filabusi greenstone belts (Figure 1). It extends northwards on the eastern margin of the Fort Rixon belt where it is considered to represent strike-slip movement along which the belt was detached from the main Bulawayo/Filabusi belt [31,32]. Restoring some dextral strike-slip would align the axes of the Bulawayo and Filabusi greenstone belts [11,13]. Major faults in the area, the Iddo and Mwenezi (IdF, MwF, Figure 1), parallel the WNW-trending dextral Mchingwe fault in the northeast (MF, Figure 1), a major brittle-ductile to brittle fault zone of regional extent. For part of its strike, the Mwenezi fault trends along the outcrop of the Ndwangu-Somukamba granite pluton south of the greenstone belt (NS, Figure 1) and also forms the greenstonegneiss contact. It seems likely that the emplacement of the Chilimanzi plutons was broadly coeval with the development of these WNW-trending faults [9]. The ILSZ appears to predate intrusion of the younger granites [11], but the sigmoidal outcrop of the Mbalabala granite pluton suggests syn-emplacement sinistral movement [10].
3. Aeromagnetic Data and Interpretation
3.1. Data Processing
The aeromagnetic data used in this study were obtained from the Zimbabwe Geological Survey (ZGS) and are based on 1 km spaced flight lines with 305 m constant mean terrain clearance. The survey was flown in 1983 and Geometrics proton precession magnetometers with a resolution of 0.1 nT were used. Flight directions were E-W, approximately perpendicular to the dominant regional geological trends (the greenstone belts), with a sampling interval of ~80 m. Navigation was mainly visual, aided by a Doppler System, with flight path recovered from 35 mm film. N-S tie-lines were flown 14 km apart and the data were diurnally corrected and flight line-levelled using a combined computer-manual method. The levelled flight line data were first gridded in the UTM co-ordinate system at 250 m cell size using a bidirectional algorithm, and then reduced to the pole to correct for the effect of the magnetic inclination (–60˚ in the study area) (Figure 2). For purely induced magnetisation, or minimal remanent magnetisation, reduction to the pole (RTP) shifts the anomalies to lie directly over the sources, thus producing anomaly maps that can be more readily correlated to the surface geology [35,36].
Several potential field processing techniques were applied on the RTP grid to enhance both short and medium wavelength features. These include apparent susceptibility calculations (Figure 3), artificial illumination (Figure 4) and derivatives [35-37]. In apparent susceptibility, the sources of the continuous potential field are modelled as an approximation to the distribution of susceptibility in the ground, thereby giving an indication of geology [36,37]. However, the contribution of remanent magnetisation is ignored in this calculation. Shaded relief maps (Figure 4) treat magnetic anomalies as topography illuminated from different directions, thus highlighting some of the finer details perpendicular to the illumination direction [38]. Combined colour-shadow maps are also effective as they display both short wavelength (shaded relief) and long wavelength (colour raster)
features.
3.2. Interpretation
The RTP magnetic data (Figure 2) display a considerable range of wavelengths and amplitude variations dominated by medium wavelengths, but both short and longer wavelength anomalies occur. In Figures 2 and 3 red to purple represents the higher magnetic signatures/ amplitudes. A rapid change in colour or a close contour spacing represents a steeper magnetic gradient, which suggests that the magnetic source is shallow and subvertical [36]. The greenstones, particularly the basaltic lavas, are characterised by generally lower magnetic signatures (flat relief) than the granites and the Great Dyke (Figure 2). Within the greenstone belt, however, intense aeromagnetic anomalies with amplitudes up to thousands of nanoTesla are observed over komatiite, banded iron formation (BIF), and ultramafic horizons. In particular there is a striking correspondence between high magnetic values and serpentinites, as illustrated by the GurumbaTumba (Gu), Phurombuzi (Ph) and Shamba Range (SR)
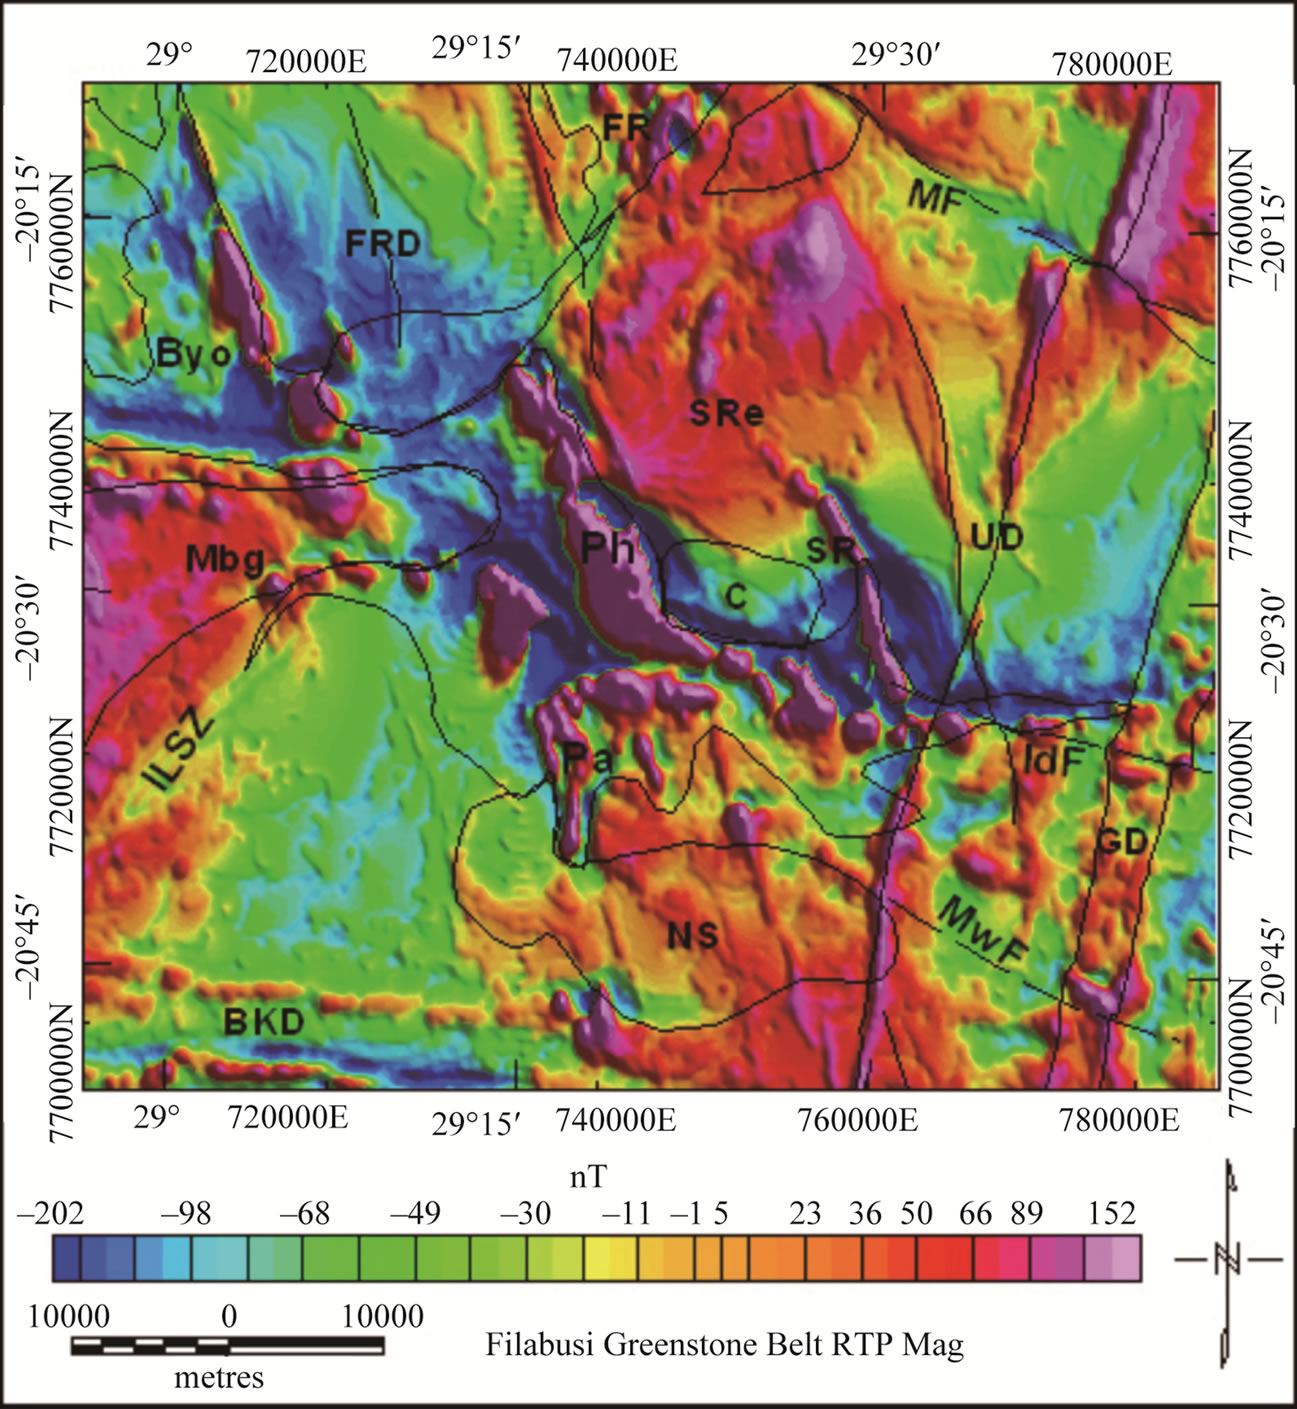
Figure 2. Reduced to pole residual aeromagnetic map of the Filabusi greenstone belt. Geological features and units referred in text as in Figure 1; others are: GD = Great Dyke, Pa = Pangani serpeninite, FRD = Fort Rixon dykes, Sre = Shamba Range extension, BKD = Botswana Karoo dykes.
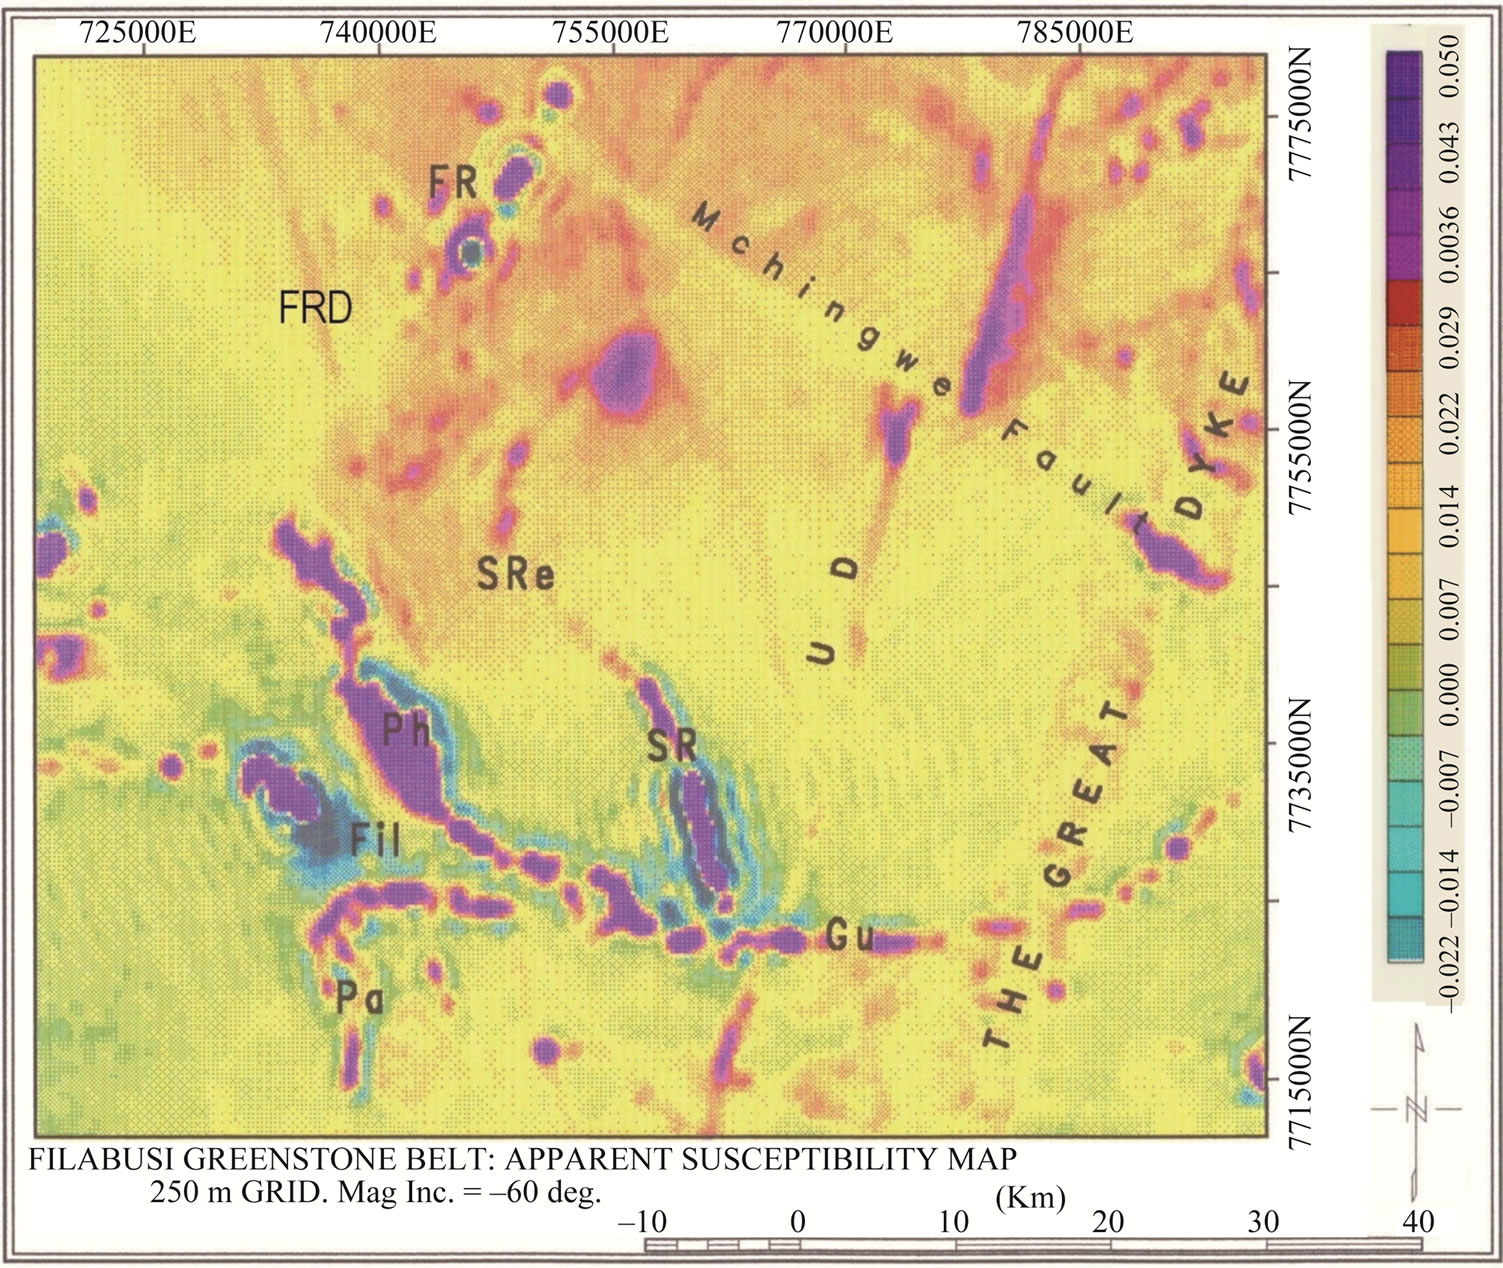
Figure 3. Apparent susceptibility map (SI units) of the Filabusi greenstone belt and surrounding areas highlighting mafic (dykes) and ultramafic (serpentinite) bodies and their extensions. FRD = Fort Rixon dykes, Gu = Gurumba Tumba serpentinite, Pa = Panganai serpentinite, Ph = Phurombuzi ultramafic, Fil = Filabusi, UD = Umvimeela dyke, SR = Shamba range, SRe = Shamba Range extension.
outcrops (Figures 2 and 3). This is due to the fact that the process of serpentinisation, which is common in the ultramafics in the area [39], increases the magnetite content of the rocks [40]. On the other hand, the granites have medium to high positive anomalies, suggesting variable composition and/or metamorphic grade [41]. A characteristic association of high magnetic values with ultramafic intrusions is considered of economic importance as these units host asbestos, Ni and Ni-Cu deposits in the region [8,33].
The RTP magnetic and derived maps (e.g., Figures 2-4) are all marked by conspicuous NNE, NNW and ESE anomaly trends, lineaments, and breaks in the anomaly pattern, most of which are parallel to geological trends (e.g., UD, GD). On the shaded relief map of the horizontal derivative in the E-W (i.e. X) direction (Figure 4), several features that were not clear on the RTP and apparent susceptibility maps are now more obvious and the presence of several dykes and faults is confirmed. In particular, a few dykes of Proterozoic age outcropping northwest of the belt now have clear signatures and appear more continuous than mapped on the surface, extending across and south of the greenstone belt (D2 to D4, FRD, cf Figures 1, 2 and 4). Dykes that have a magnetic expression but are not mapped in the field may be olivine-bearing and tend to weather easily, forming linear depressions filled with overburden [42], making them invisible during field mapping. The dykes appear to fill extensional fractures that also control the drainage pattern in the area [42]. On a regional scale, the one mapped east of the belt (D1, Figure 4) can be seen extending continuously northwards east of, and beyond, the Fort Rixon (FR) belt. Here, it is cut by the Mchingwe fault but without any obvious displacement and this provides a relative age constraint for the associated NNW-trending dykes [42,43]. They constitute part of a dyke swarm related to the widespread 1.8 - 2.0 Ga Mashonaland Igneous Dykes event, most recognisable member is the Sebanga dyke (Sd, Figure 1) known to outcrop discontinuously for over 50 km [34]. South-west of Filabusi (Fil), a new set of dykes can be seen across the area in an approximately E-W direction (BKD, Figures 2 and 4). Further south, this set takes an ESE-WNW direction and cuts across the Great Dyke into the Limpopo Belt [42]. Ranganai [43] interpreted them as part of the giant Botswana Karoo dyke swarm commonly associated with crustal extension during the break-up of Gondwana [44, 45].
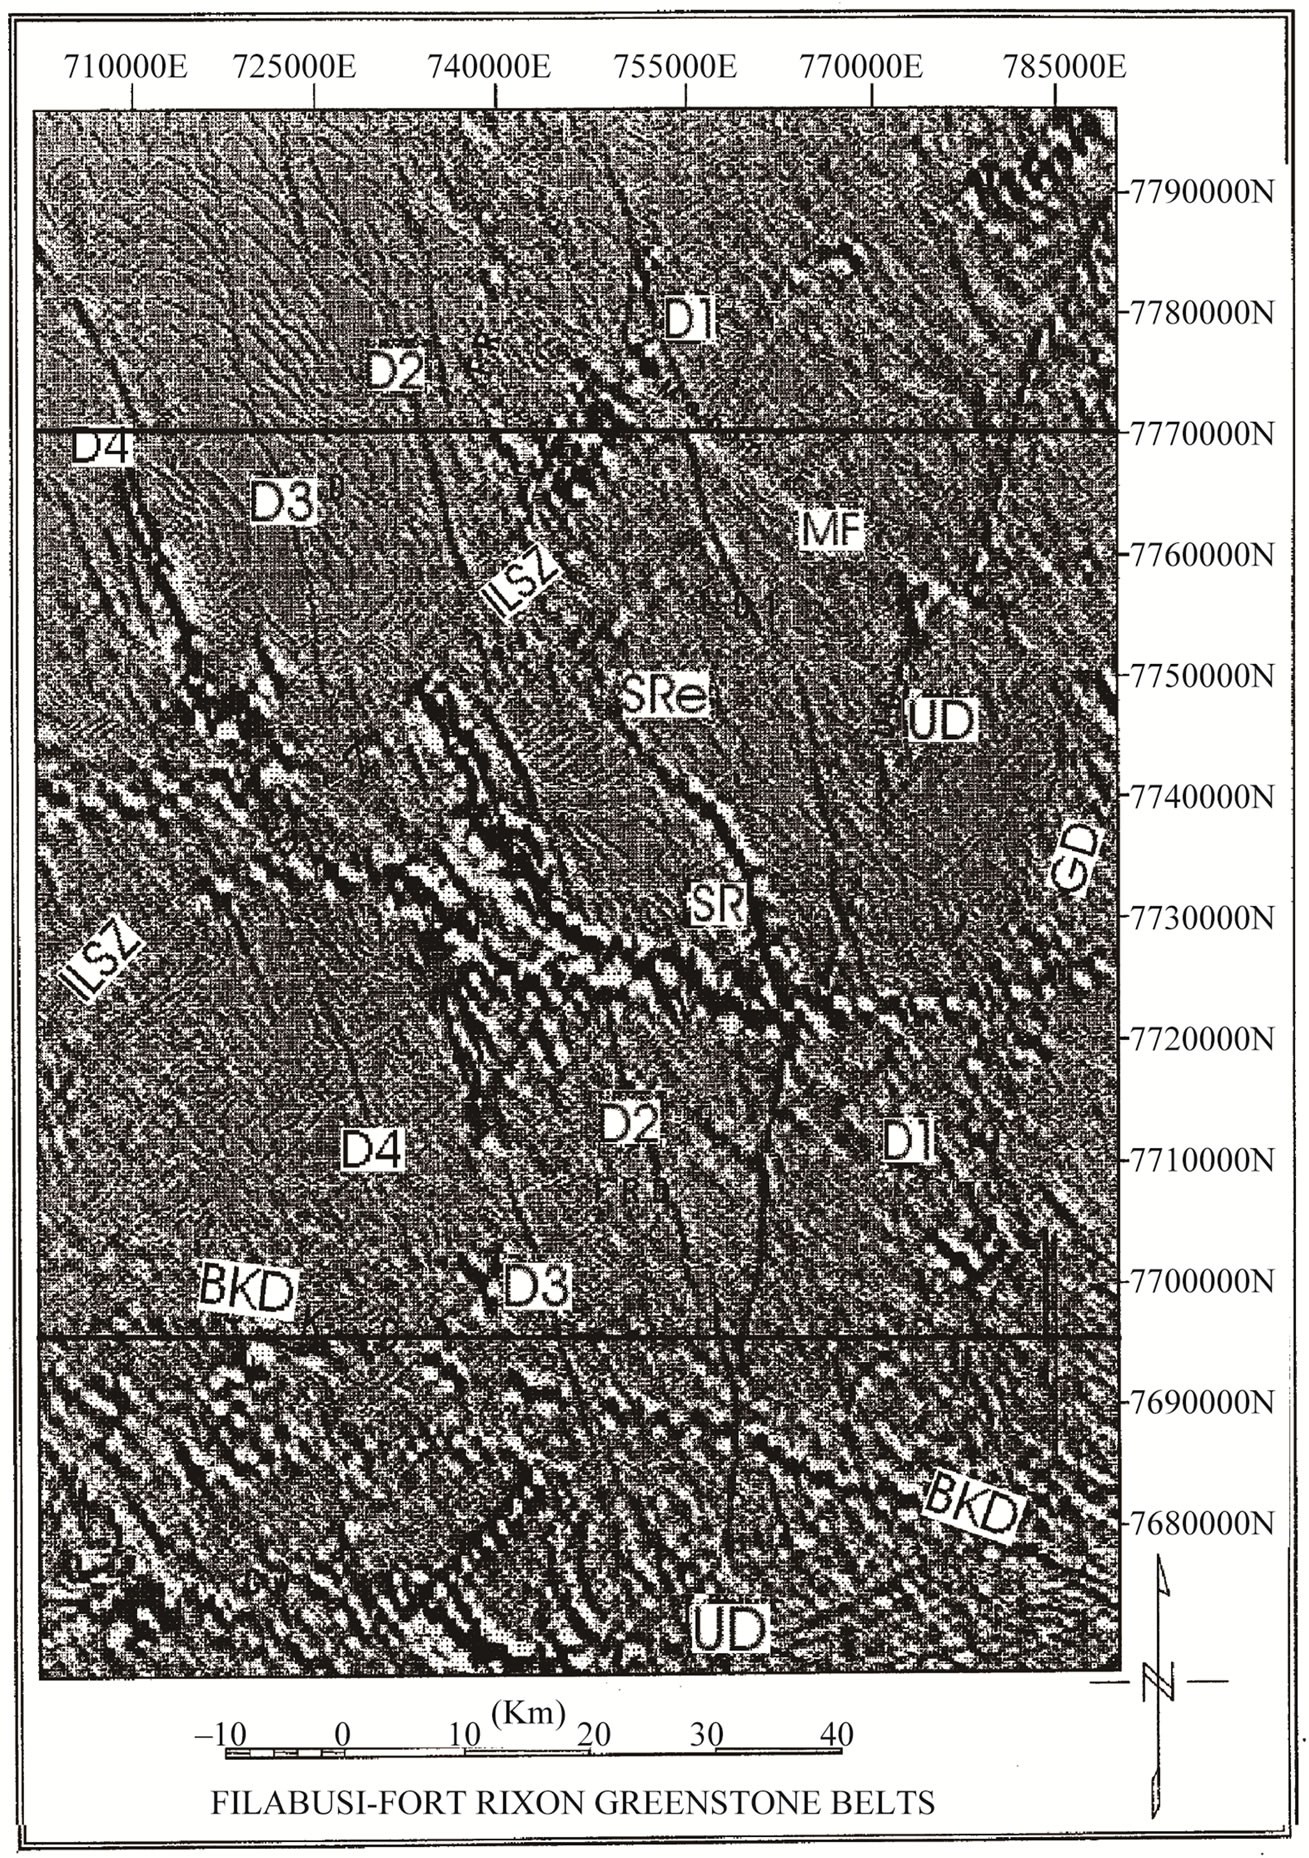
Figure 4. RTP shadow map of the FGB and surrounding areas showing regional structures identified in the study. Labelled units and structures discussed in text: BKD = Botswana Karoo dykes, GD = Great Dyke; ILSZ = Irisvale-Lancaster shear zone, MF = Mchingwe fault, UD = Umvimeela dyke. Note the continuity of the NNW-trending dykes (D1 to D4) across the FGB. SR, SRe = Shamba range extension. Box shows area of Figure 2; the main study area.
An ~3 km wide NE-trending linear magnetic zone (ILSZ, Figures 2-4) west of Filabusi and east of Fort Rixon correlates with the Irisvale-Lancaster shear zone (cf. Figure 1). This was previously inferred from geological interpretation, air photos and Landsat MSS data, and has been linked to the separation of the two belts [11, 31,32]. It is mapped as a magnetic low and it also coincides with the “break” in vertical gravity gradient between the Bulawayo and Filabusi greenstone belts ([43], see below). Another new feature observed is an extension of the Shamba Range (SR) in a northwesterly direction, before it swings due N to NNE at or near the interpreted shear zone (SRe, Figures 2-4). This change in direction of the anomaly trend lends support to the NE-directed strike-slip movement along the ILSZ. The extension is only identified as a fracture on the geological map of the area, the Shamba fracture (SF, Figure 1; [10,11]); which is now clearly intruded by the ultramafic body. The circular anomaly high at the northern end of this body could either be an ultramafic remnant or a mafic dolerite sill as small outcrops of the latter can be identified in the area on the geology map [10]. Both lithologies are associated with high magnetic and gravity values, so no conclusive interpretation can be made.
4. Gravity Data and Interpretation
4.1. Data Collection and Processing
Existing gravity data collected by various institutions like the ZGS, University of Zimbabwe (UZ) and exploration/ mining companies [46,47] were considered sparse and a fieldwork programme was undertaken in 1993 and 1997 to establish detailed gravity traverses at 1 - 3 km spacing across several greenstone belts in the area, including Filabusi [16,43]. A regional network (3 - 6 km spacing) of stations over the belts and surrounding granitoids was also acquired in order to improve the data distribution (Figure 5). A LaCoste & Romberg geodetic gravimeter was used along roads and motorable tracks in the area. It was possible to fix the lateral station position to ±50 m from 1: 50,000 topographic maps, sometimes aided by vehicle odometer readings. In exceptional cases, it was necessary to employ autonomous satellite positioning techniques (GPS, ±50 m). Station elevations were determined by barometric leap-frogging, controlled by trigonometric beacons, bench marks and differential GPS (DGPS) points at approximately 10 km intervals. The traverses from barometric levelling were joined to make a network of closed loops whose misclosures were adjusted by a least squares program [46], with the DGPS stations, bench marks and trigonometric beacons as control points. The terrain in the survey area is not very rugged and there were no severe weather variations, which permits confidence in the accuracy of the barometer survey. The standard error of an adjusted height difference of unit weight was found to be 1.30 m for the network as a whole [43]. The adjusted node heights and the adjustments were used to calculate individual heights along traverses; the estimated standard error of the station heights is ±1.5 m. Terrain corrections were not applied as these had been found to be <2 mGal in previous surveys [43,46], compared to the ~40 mGal anomalies.
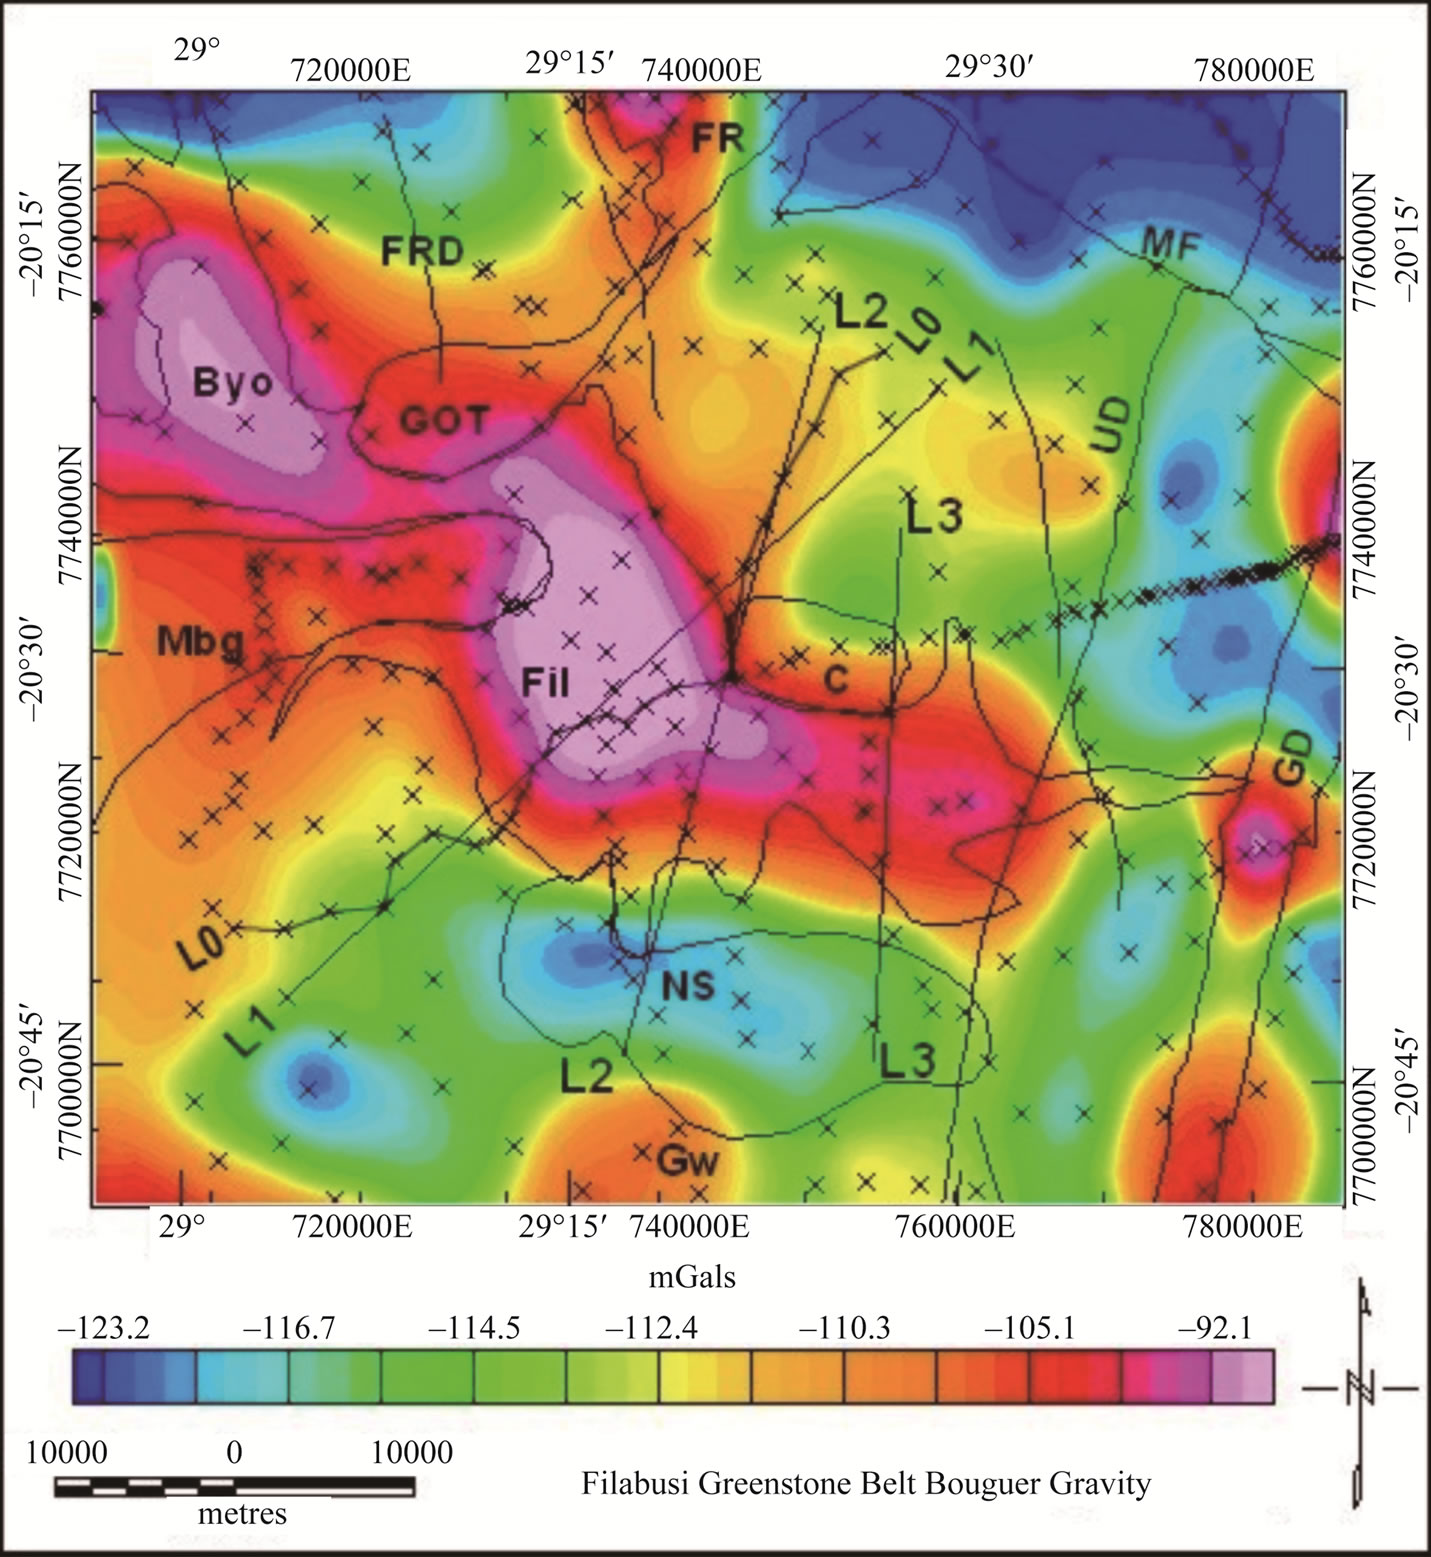
Figure 5. Bouguer gravity and station distribution map of the FGB. Traverses and/or profiles L0, L1, L2 and L3 used for 2.5D gravity modelling are shown. C, Mbg and NS represent plutons discussed in text (cf Figure 1; other abbreviations as in Figure 2). Gw = Gwanda greenstone belt.
Tidal and instrument drift, latitude, and elevation corrections were applied to the observed gravity readings. In order to conform with existing data, the observed gravity values were reduced to Bouguer gravity anomalies using the GRS80 formula [48] and a crustal density of 2670 kg/m3, and are considered accurate to ±2.0 mGal [16,43]. The 300 new measurements and the 48 existing data points were used to compute a simple Bouguer anomaly map of the area. The “randomly” distributed data were gridded at 3 km cell size in the UTM co-ordinate system using a program based on the minimum curvature technique [49]. During the gravity survey, several representative rock samples were collected for density measurements (Table 2) by the traditional wet and dry method [16,43,46].
4.2. Interpretation
The Bouguer gravity anomaly map (Figure 5) comprises a background around −113 mGal over gneisses/tonalites and a well-defined residual anomaly (peak ~40 mGal) for the greenstone belt. The latter outlines the shape and extent of the volcanic rocks very well, with a NWto NNW-trending axis linking with the gravity high over the Bulawayo belt to the west albeit broken by “lows” over syn-/post-volcanic intrusive granite plutons. Steep gravity gradients approximately coincide with granitegreenstone contacts with little or no anomaly overlap beyond mapped exposures, except at the western end over the Mbalabala granite contact (Mbg, Figure 5). Other isolated highs occur over the Fort Rixon belt (FR) in the north, the Great Dyke (GD) in the east, and a remnant of the Gwanda belt (Gw) in the south outside the study area, which also appears larger than mapped on the surface [43]. Apparent anomaly closures and kinks along the linear, relatively narrow Great Dyke and elsewhere are due to under sampling along strike and the gridding process on unevenly spaced data, as evidenced by a comparison of the mapped geology and station locations (Figures 1 and 5). This cautions the interpreter that narrow linear features such geological contacts and structures

Table 2. Summary of densities of the various rock types from the Filabusi greenstone belt and surrounding granitoids (r = density, in kg/m3; N = number of samples).
may be rather poorly defined in some parts of the Bouguer anomaly map, but generally the greenstone belt is not affected.
Most of the porphyritic granites in the region have conspicuous gravity lows [16,17,50], including some in the study area like the Ndwangu-Somukamba granites (NS, Figure 5) and possibly one concealed to its southwest. The most surprising thing is that there is no Bouguer gravity anomaly low associated with the large Mbalabala porphyritic pluton (Mbg, Figure 5) intruding west of the greenstone belt. In fact the positive anomaly due to the volcanics continue over the pluton, suggesting that it is thin with possible underlying volcanics. Density determinations further away from the volcanics, indicate that no density contrast exists with the surrounding tonalites and gneisses, both at the surface and subsurface (Table 2). Therefore, the pluton is probably of the synvolcanic, tonalitic Sesombi type (e.g., Golden Oriole tonalite GOT, Figures 1 and 5) rather than the postvolcanic Chilimanzi type which invariably have lower densities than the gneisses and tonalites. On Landsat images, the Mbalabala pluton appears to be of different “character” from other Chilimanzi suite plutons (e.g., Chivi granite; [39,51]), and looks more massive further west outside the study area [43]. It is essentially reflected as two separate and different plutons; this is also displayed on the aeromagnetic map (Figure 2), suggesting at least two phases of intrusions.
In order to improve the definition of granite-greenstone boundaries, first and second vertical derivative maps of the gravity field were prepared (e.g. Figure 6). The improvement is possible because the rate of change of gravity with elevation is much more sensitive to changes in rock densities occurring near the ground surface than to changes occurring at depth [35]. However, noise accentuated, particularly for isolated, single station anomalies. Though data somewhat sparse in places, the increased resolution is apparent on the maps, which are “sharp” as there appears to be no anomaly overlapping effects. These features are particularly evident on the western part of the greenstone belt where the “break” with the Bulawayo greenstone belt to the west is now evident (ILSZ, cf Figures 4 and 6). The Mbalabala (Mb) pluton and its margin/contact with the Filabusi belt is now reasonably well mapped, although it would still be difficult to map the contact only from the gravity data. The Congese pluton on the northern edge of the greenstone belt is also now clearly outlined (C, Figures 5 and 6).
5. 2.5 D Gravity Modelling
Three traverses were surveyed across the greenstone belt at 1.0 - 2.0 km station spacing for reliable gravity modelling (Figure 5); two through the wide central part of the belt and one across the narrow eastern section.

Figure 6. First vertical gravity gradient anomaly map of the FGB area. Abbreviations of units/features as in Figures 1 and 2. Isolated (single point anomalies) in some places are due to poor station coverage as discussed in text.
Although to some extent dictated by availability of roads and/or motorable tracks (e.g., L0), the guiding principle in selecting the traverses and the station spacing were: 1) they intersect most of the mapped geological contacts at right angles (see 2.5 D description below), 2) the need for closely spaced points over the greenstones and contact areas based on mapped width of units, and 3) long enough to define a realistic regional (e.g., three times the anomaly width), and positioned in such a way as to minimise influence from neighbouring units (at least in the strike direction).
Initially, the data points used for modelling the first two lines (L1 and L2) were extracted from the main data set (rather than the generated grid) by projecting points within a 3 km swath width onto a line defined by two given endpoints (cf L0 and L1). However, due to noise/ scatter especially from stations distant from the line, and the resulting small number of data points, profiles were also extracted from the gridded data. The profile to the extreme east (L3, Figure 5) had insufficient field points and the data points were therefore extracted from the gravity grid only. The modelled profiles (L1 to L3, Figure 5) represent the best straight lines along the field traverses; the profiles have more points, regular spacing and are smoother. A PC based interactive program (GMSYS) was used to calculate the gravity model responses along the profiles. The program is based on the polygon method for 2.5 D bodies and makes use of algorithms described by Won and Bevis [52]. A 2.5 D designation comes from the ability to uniquely define the strike length into and out of the cross-sectional plane of each polygon in the model, as long as the profile is reasonably perpendicular to strike. However, profiles need not be orthogonal to the geologic strike as the program allows for skewed profiles with the user defining the relative model strike and the profile azimuth relative to a reference point on the body. A constant linear regional was fixed for each profile by matching the observed and calculated curves at a selected point defining the regional.
Geological information used in constraining the modelling include mapped dips, width, and length, and only small variations (±5˚, ±1 km, ±1 km, respectively) of these were allowed since they have been seen to coincide well with the gravity anomaly edges (Figures 5 and 6). As granites completely surround this greenstone belt, a simplifying assumption that the belt is everywhere floored by granite has been made. Another factor considered is that the dominant Upper Greenstone basalts are quite homogeneous and therefore the greenstone belt has initially been modelled with a uniform density of 2960 ± 50 kg/m3 (see Table 2). The possible influence of varying this within certain limits (e.g. the standard deviation) is considered; equivalent to minor sensitivity analysis, a process of varying model parameters over a reasonable range and observing relative changes in model responses [26]. Here, the main task of the sensitivity analysis is to define sensitivities of the depth extent to density (contrast) changes. Further, stratigraphically the volcanics constitute >90% of lithologies followed by ultramafics (with similar density) with low density sedimentary rocks making up <1% (cf Tables 1 and 2). A mean density of 2670 ± 50 kg/m3 was used for granites, and 2550 ± 30 kg/m3 for the low density plutons, typical of the porphyritic granites in the region [16,17,43,50].
6. Filabusi Greenstone Belt Models
The three profiles modelled (L1, L2, L3; Figure 5) were considered sufficient to give good estimates of the thickness and shape of the greenstone belt and test the Filabusi model. At least two models are presented for each of the first two lines; for original field gravity points and for the extracted grid points. The geological crosssections, the Bouguer gravity and the derived density models are shown in Figures 7-9 for the western (L1),

Figure 7. (a) Bouguer gravity anomaly and  D density model along traverse L0 (field points). Density r in kg/m3. VE = Vertical Exaggeration (3.5). The surface of the model relates to the topography and the model cross-section is at sea-level (0 m); (b) Bouguer gravity anomaly and
  D density model along profile L1 (grid points). Density r in kg/m3. VE = Vertical Exaggeration (4). The surface of the model relates to the topography and the model cross-section is at sea-level (0 m).
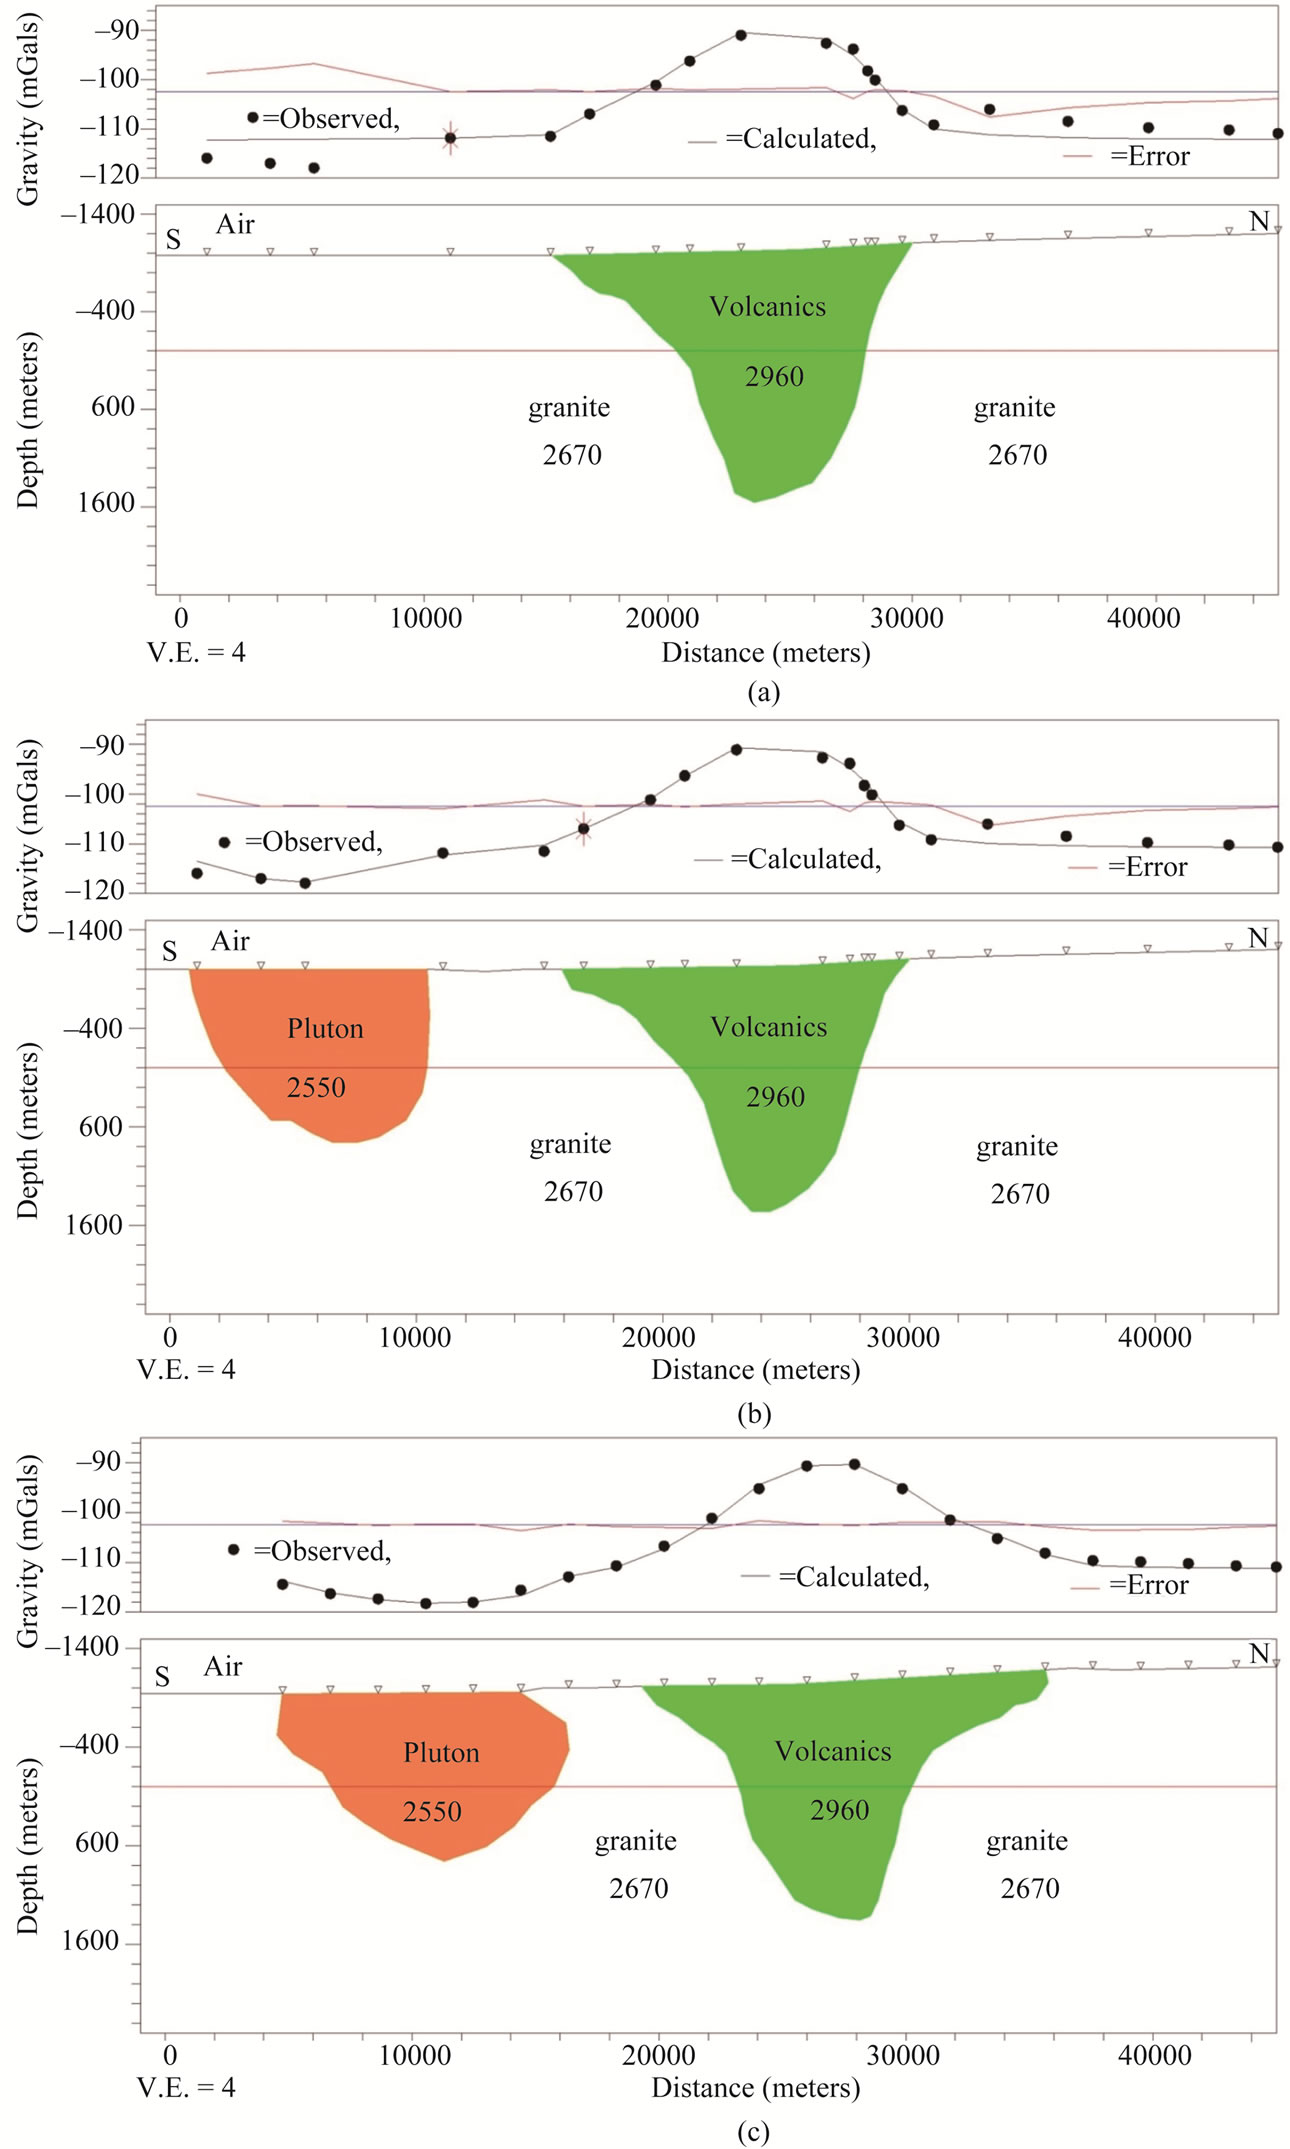
Figure 8. (a) Bouguer gravity anomaly and  D density model along traverse L2 (field points) without pluton south of the greenstone belt, resulting in poor match/fit. Also note the scatter in the north due to distant stations as explained in the text? Density r in kg/m3. VE = Vertical Exaggeration (4). The surface of the model relates to the topography and the model cross-section is at sea-level (0 m); (b) Bouguer gravity anomaly and
  D density model along profile L2 (original stations) with pluton south of the greenstone belt, resulting in a better fit. Density r in kg/m3. VE = Vertical Exaggeration (4). The surface of the model relates to the topography and the model cross-section is at sea-level (0 m); (c) Bouguer gravity anomaly and
  D density model along profile L2 (grid points). Density r in kg/m3. VE = Vertical Exaggeration (4). The surface of the model relates to the topography and the model cross-section is at sea-level (0 m).
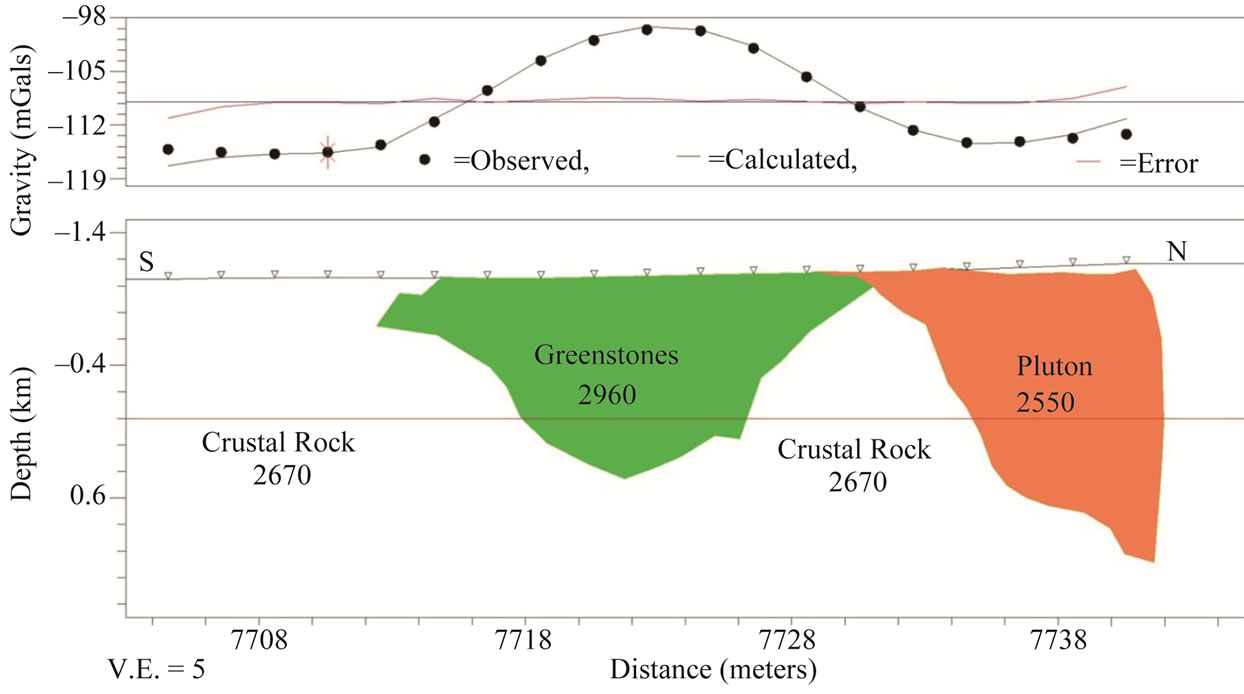
Figure 9. Bouguer gravity anomaly and  D density model along profile L3 (grid points). Density r in kg/m3. VE = Vertical Exaggeration (5). The surface of the model relates to the topography and the cross-section is at sea-level (0 m).
central (L2), and eastern profiles (L3), respectively. As explained above, no attempt was made to reproduce every detail of the observed anomalies and the models are probably the simplest that broadly satisfy the surface geology, the density measurements and the gravity field. Conclusions regarding the broad-scale structure of the belt are not significantly affected by these limitations/ assumptions [16,17]. The depth extent of the greenstone belt is an important boundary condition for reconstructing the tectonic history that created its present structure.
6.1. Model FB1: Western Profile (L0 and L1)
Traverse Lo and profile L1 run approximately NE-SW and transect the widest part of the greenstone belt and part of the peak Bouguer gravity anomaly (Figure 5). The gravity anomaly along this section (Figure 7) is approximately 34 mGal in amplitude and occurs directly over the greenstone belt outcrop, falling off sharply over the granite-greenstone contact. This implies steeply dipping contacts and the belt has been modelled as such, with a small overall tilt towards the southwest.
For both models presented, the greenstone belt is modelled as a basin-like mass with a maximum depth extent of about 3.8 km. Since we are considering a uniform density model, varying the density within the limits of the standard deviation (Table 2) simply results in a corresponding percentage change in the thickness of the belt (i.e., ±0.06 km; cf [16,17]). Therefore, the depth extent of the greenstone belt does not exceed 4 km. The two models also show the ambiguity in shape (and dip) determination from gravity data.
6.2. Model FB2: Central Profile (L2)
The Filabusi greenstone belt outcrop spatially thins from west to east (or ~NW to SE) (e.g. Figures 1 and 5) such that although this ~N-S profile passes through the central part of the belt, it transects a narrower section than the western profile and lies on the edge of the peak gravity anomaly. Accordingly, the Bouguer gravity anomaly is smaller than for profiles L0 and L1, with amplitude of about 26 mGal (Figure 8). The profile is also slightly asymmetric, falling off gradually over the granite contact in the north but with a steeper gradient in the south; there is also a slightly higher background in the north than in the south. This is partly because the profile passes across a younger, low density granite pluton (Ndwangu-Somukamba, NS on Figures 5 and 6) in the south, which has the effect of introducing a small depression in the anomaly. Models with and without the pluton are presented for the field data points (Figures 8(a) and (b)), and the gravity profiles also clearly show the earlier mentioned scatter of values particularly in the north. Along this profile, the volcanics are modelled with a relatively shallow dip in the south and steep contact in the north (Figures 8(a) and (b)). In contrast, for the grid points, the volcanics have a shallow contact in the north and a steep contact in the south; again illustrating the shape ambiguity problem. Similarly, the pluton is portrayed with two different shapes that reasonably fit the data. In all models, the depth extent of the greenstone belt is shown to be no more than 3.0 km, compared to 4.0 km for the western profile. The pluton is less than 2.0 km thick in both cases.
6.3. Model FB3: Eastern Profile (L3)
As a result of road/track access issues, this profile is located towards the eastern edge of the greenstone belt and hence transects the narrow part of the belt (Figure 5). Consequently, it has the smallest gravity anomaly amplitude of approximately ~16 mGals (Figure 9), suggesting a small depth-extent. However, the anomaly appears wider than the mapped outcrop of the greenstone belt and continues beyond the belt surface exposures into granite area; with no sharp boundary (Figure 5). This implies subsurface continuation of volcanics under granites, although relatively poor data coverage could contribute to this effect. The profile starts in a pluton area (NS) in the south and passes on the edge of another granite pluton (C) in the north, again causing a small low in the anomaly, this time in the north, as supported by the vertical derivative map (Figure 6). Hence the Congese pluton (C) in the north has been modelled together with the greenstone belt, with a lower density of 2550 ± 30 kg/m3. Figure 9 shows that the greenstone belt is very thin at the location of this profile, with a depth extent of only 1.5 km. It continues in both directions under granite beyond mapped contacts at shallow angles. The Congese pluton is about 2.0 km thick, and also continues northward under granite/gneiss beyond the mapped contact.
The model shows a dipping contact in the southwest and steep/vertical contact in the northeast. However, the pluton occurs on the edge of the profile, hence the shape is not well constrained.
7. Discussion and Conclusions
The aeromagnetic data display a good correspondence between anomalies and the known geology, and have also allowed mapping to be extended to areas of poor rock exposure. The dominant basaltic volcanics appear to be magnetically quiet but large amplitude magnetic highs occur over ultramafic units/horizons which are also of particular economic significance as some of them host Ni and asbestos deposits. Further, they tend to be markers; define either greenstone belt edges or its synclinal structure [10,11], both closely related to greenstone belt development. Several NNW-trending dykes and fractures cutting across the greenstone belt have been revealed, as well as a major extension of one of the metakomatiiticBIF units, the Shamba Range. Overall, three major structural directions/trends are identified, viz: NNW, NNE and WNW-ESE, related to dykes and faults. The NNW trend is dominant and significant: being the trend of one of the limbs of the greenstone belt, major fractures/dykes and drainage pattern (five major rivers), as well as the main gravity high over the western half of the greenstone belt. The NNW-trending magnetic dykes are associated with the widespread 1.8 - 2.0 Ga Mashonaland Igneous event [34]; and may be related to the ESE-trending dextral faults in the area (e.g., Mchingwe, Jenya, Figure 1), among other tectonic events [31]. They probably fill extension fractures associated with the initial development of the Filabusi basin [10,11]. A few E-W to ESE trending dykes (BKD) identified in the southeast could be part of the Okavango Karoo (180 Ma) dyke swarm in northern Botswana associated with crustal extension during the break-up of Gondwana [44]. However, Jourdan et al. [45] show that Proterozoic dykes and sills are also present in the Okavango swarm (~10% of all dykes), and relate these to the ~1.1 Ga Umkondo Igneous event [34]; thus clearly demonstrating basement control on the polyphase dyke intrusions. However, no other Umkondo events are recognised in the area.
The Bouguer gravity anomaly map of the area and the derived greenstone models are also very informative; gravity generally provides information at larger depths than magnetics. Pronounced gravity highs and steep gradients generally correspond with the mapped margins of the greenstone belt, with little or no subsurface continuation beyond mapped exposures (Figure 5). There are important exceptions where plutons intrude the belt and may form a carapace or hood over greenstone occurrences (e.g., Mbalabala, Figures 1 and 5). The positive anomaly axis coincides with the inferred synform greenstones. The steep gradients indicate steeply dipping contacts for the anomalous bodies that, in turn, suggest an intrusive relationship between the greenstones and the plutons. The 2.5 D gravity models (Figures 7-9) can explain the positive Bouguer anomalies as due to moderately steep-sided volcanic bodies within the granitic crust. They do not support a deep crustal root of any width for the bodies. Isolated oval shaped, small gravity lows generally correlate with outand sub-outcropping K-rich post-volcanic (2.6 Ga Chilimanzi suite) granite plutons. Surprisingly one of these plutons, the Mbalabala porphyritic granite intruding and deforming the greenstone belt in the west, has no associated gravity anomaly low, suggesting that it is instead of the syn-volcanic tonalitic (2.7 Ga Sesombi suite) type with small or no density contrast with the older gneisses and tonalites.
The Filabusi greenstone belt spatially and vertically thins eastwards, progressively shallowing eastwards from L1 to L3; and has a modelled maximum depth extent of 3 - 4 km. This compares relatively well with source depth estimates from gravity spectra that give a density discontinuity at a depth of 3.15 ± 0.15 km [43]. However, this is one half to a third of the mapped stratigraphic thickness of up to 9.5 km (Table 1, [10]), although the latter does not necessarily represent vertical thickness, as there could be tectonic repetition [1]. This suggests no simple rotation of the greenstone lithologies, but instead a truncation at shallow depth of the structurally repeated lithologies. Elsewhere, the discrepancy between the greenstone depth extent from gravity models and the stratigraphic thicknesses has been attributed to a number of tectono-magmatic processes: e.g., magmatic stoping, granitisation, thrust faulting and tectonic truncation at depth [21,22,53,54]. One of the common aspects of granitegreenstone relationships is the intrusion of synto-postvolcanic granites into the greenstones and thus modifying their geometry, and regional structural patterns [55-57], as partly observed here. Many of these granitic bodies can be interpreted from geophysical data to be sheet-like intrusions (e.g., [16,22]); but others are wedges emplaced into tectonic fractures in the brittle crust (e.g., [17,50]).
In the study area, intrusion of K-rich young granites into the greenstone terrains is common (Figure 1; [10,11, 39]). Within a regional context, much of the area separating the Fort Rixon-Shangani belt and the Bubi-Bulawayo greenstone belt is occupied by a plutonic complex (SSg, Figure 1) related to the ~2.7 Ga Sesombi suite of tonalite-trondjhemite-granitoids (TTG) [2,11,31]. Removal of this complex and joining the Fort Rixon-Shangani belt to the Bulawayo-Bubi belt would create a continuous northerly-trending sequence of ultramafics along the eastern margin of the Bubi-Bulawayo, Fort Rixon-Shangani, and Filabusi greenstone belts [9,11,13] (Figure 1). The identification and trend of an extension of the ultramafic-BIF unit between Filabusi and Fort Rixon (SRe, Figures 2-4), together with the strike-slip movement on the ILSZ, supports this interpretation. Restoring some dextral strike-slip would align the axes of the Bulawayo and Filabusi greenstone belts [9,13]. Furthermore, the NNW gravity anomaly trend of the Filabusi belt is similar to that of the Bulawayo-Bubi greenstone belt on the regional gravity anomaly map [47]; and even appears as one continuous anomaly high partially broken by lows over intrusive syn/post-volcanic plutons. Therefore both the gravity and magnetic data support arguments that it may have been one large greenstone belt: the Bubi-Bulawayo-Fort Rixon/Shangani-Filabusi belt. This interpretation could be of significance to the Filabusi model and the general granitegreenstone relationship across the craton. But further detailed geophysical works, at least similar to those discussed here, should be applied to other greenstone belts as a prerequisite for any “unified” geotectonic model. Also a regional picture is required; questions to answer include development of a large basin for such a “reconstructed” belt, or individual separate basins? Further, this is one of the difficult problems of “retracing” Archaean tectonics and the potential field data may be reflecting present structures, and at best the recent past so that there is need for other geoscience methods.
Overall, the present geophysical data and geological information support a simple basin model of volcanics overlying older granitic crust, as observed in other greenstone belts in the Zimbabwe craton [16,17]. Given the often low strain and lack of structural complexity within some of the late Archaean greenstone belts, it is arguable that their shape and distribution pattern may reflect at least in part their extensional or transtensional emplacement on and within a previously deformed and fragmented gneissic crust [55]. The general symmetry and size of the Bouguer gravity anomalies, the modelled greenstone configuration, and the interpreted steep contacts (partly confirmed by forward modelling), all agree with the ideas that the present greenstone belt location approximates to the depositional position, and the areal extent is probably comparable to the original size [16]. This is consistent with an autochthonous origin frequently argued for Zimbabwe greenstone belts [1,2,6,7, 12,14-17]. Also, there is no indication of thrust tectonics from the aeromagnetic data, which partly rules out an allocthonous setting. The essential regional pattern now seen may have been acquired in part prior to the main phase of late Archaean deformation and granitoid emplacement which then modified, rather than produced, the basic geometry of the greenstone belts [13,31,55]. Field evidence and the gravity anomaly geometry/shape also indicate that greenstone belt deformation is partly due to granite intrusion (e.g., Mbalabala and Congese plutons, Figures 1 and 5; cf. [56,57]). The model advanced for the Filabusi greenstone belt (evolution and deformation) is in agreement with results in similar terranes in southern Africa [22,55,58]; and other parts of the world [21,22,24,53]. Invariably, there is no conclusive evidence on the relative importance of vertical and horizontal tectonics, as the case with many other similar terrains [13, 18,19, 27,30,31,55-57].
8. Acknowledgements
The Zimbabwe Geological Survey (ZGS) provided the aeromagnetic data and some of gravity data used in this study and gave permission for the data to be published. Additional (new) gravity data were collected through a University of Zimbabwe Research Board grant RB/108/ 96 and the support of the Geophysics Unit of the ZGS. O. T. Okatswa is thanked for the geology graphics. Comments by the reviewers greatly improved the paper.
REFERENCES
- M. J. Bickle and E. G. Nisbet EG, Eds., “The Geology of the Belingwe Greenstone Belt, Zimbabwe: A Study of the Evolution of Archaean Continental Crust,” Geological Society of Zimbabwe, Special Publication 2, A. A. Balkema, Rotterdam, 1993.
- J. F. Wilson, R. W. Nesbitt and C. M. Fanning, “Zircon Geochronology of Archaean Felsic Sequences in the Zimbabwe Craton: A Revision of Greenstone Stratigraphy and a Model for Crustal Growth,” In: M. P. Coward and A. C. Ries, Eds., Early Precambrian Processes, Geological Society, Special Publication 95, London, 1995, pp. 109-126.
- T. G. Blenkinsop, A. Martin, H. A. Jelsma and M. L. Vinyu, “The Zimbabwe Craton,” In: M. J. de Wit and L. D. Ashwal, Eds., Greenstone Belts, Oxford Monograph on Geology and Geophysics, Clarendon Press, Oxford, 1997, pp. 567-580.
- M. S. A. Horstwood, R. W. Nesbitt, S. R. Noble and J. F. Wilson, “U-Pb Zircon Evidence for an Extensive Early Archean Craton in Zimbabwe: A Reassessment of the Timing of Craton Formation, Stabilization and Growth,” Geology, Vol. 27, No. 8, 1999, pp. 707-710. doi:10.1130/0091-7613(1999)027<0707:UPZEFA>2.3.CO;2
- H. A. Jelsma and P. H. G. M. Dirks, “Neoarchaean Tectonic Evolution of the Zimbabwe Craton,” In: C. M. R. Fowler, C. Ebinger and C. J. Hawkesworth, Eds., The Early Earth: Physical, Chemical and Biological Development, Geological Society, Special Publications 199, London, 2002, pp 183-211.
- M. D. Prendergast, “The Bulawayan Supergroup: A Late Archaean Passive Margin-Related Large Igneous Province in the Zimbabwe Craton,” Journal of the Geological Society, Vol. 161, No. 3, 2004, pp. 431-445. doi:10.1144/0016-764902-092
- M. D. Prendergast and M. T. D. Wingate, “Zircon Geochronology and Partial Structural Re-Interpretation of the Late Archaean Mashaba Igneous Complex, South-Central Zimbabwe,” South African Journal of Geology, Vol. 110, No. 4, 2007, pp. 585-596. doi:10.2113/gssajg.110.4.585
- D. S. Bartholomew, “Base Metal and Industrial Mineral Deposits of Zimbabwe, and Gold Deposits of Zimbabwe,” Zimbabwe Geological Survey Mineral Resources Series No. 22 and 23, Harare, 1990.
- S. D. G Campbell and P. E. J. Pitfield, “Structural Controls of Gold Mineralization in the Zimbabwe CratonExploration Guidelines,” Zimbabwe Geological Survey Bulletin 101, Harare, 1994.
- N. Baglow, “The Geology of the Filabusi Granite-Greenstone Terrain,” Zimbabwe Geological Survey Bulletin 91, Harare, 1998.
- S. D. G. Campbell, N. Baglow and P. E. J. Pitfield, “The Structural Framework of the Filabusi Greenstone Belt, and Its Relevance to Gold Mineralization,” Annals of the Zimbabwe Geological Survey, Vol. 15, 1990, pp. 29-38.
- B. S. Kamber, R. Bolhar and G. E. Webb, “Geochemistry of Late Archaean Stromatolites from Zimbabwe: Evidence of Microbial Life in Restricted Epicontinental Seas,” Precambrian Research, Vol. 132, No. 4, 2004, pp. 379-399. doi:10.1016/j.precamres.2004.03.006
- S. D. G. Campbell, P. M. Oesterlen, T. G. Blenkinsop, P. E. J. Pitfield and H. Munyanyiwa, “A Provisional 1:2,500, 000 Scale Tectonic Map and the Tectonic Evolution of Zimbabwe,” Annals of the Zimbabwe Geological Survey, Vol. 16, 1991, pp 31-50.
- M. J. Bickle, E. G. Nisbet and A. Martin, “Archean Greenstone Belts Are not Oceanic Crust,” The Journal of Geology, Vol. 102, No. 2, 1994, pp. 121-138. doi:10.1086/629658
- M. A. Hunter, M. J. Bickle, E. G. Nisbet, A. Martin and H. J. Chapman, “Continental Extensional Setting for the Archean Belingwe Greenstone Belt, Zimbabwe,” Geology, Vol. 26, No. 10, 1998, pp. 883-886. doi:10.1130/0091-7613(1998)026<0883:CESFTA>2.3.CO;2
- R. T. Ranganai, K. A. Whaler and C. J. Ebinger, “Gravity Anomaly Patterns in the South-Central Zimbabwe (Archaean) Craton and Their Geological Interpretation,” Journal of African Earth Sciences, Vol. 51, No. 5, 2008, pp. 257-276. doi:10.1016/j.jafrearsci.2008.01.011
- O. Gwavava and R. T. Ranganai, “The Geology and Structure of the Masvingo Greenstone Belt and Adjacent Granite Plutons from Geophysical Data, Zimbabwe Craton,” South African Journal of Geology, Vol. 112, No. 3-4, 2009, pp. 277-290. doi:10.2113/gssajg.112.3-4.277
- P. H. G. M. Dirks and H. A. Jelsma, “Silicic Layer-Parallel Shear Zones in a Zimbabwean Greenstone Sequence: Horizontal Accretion Preceding Doming,” Gondwana Research, Vol. 1, No. 2, 1998, pp. 177-193. doi:10.1016/S1342-937X(05)70829-7
- T. M. Kusky, “Tectonic Setting and Terrane Accretion of the Archean Zimbabwe craton,” Geology, Vol. 26, No. 2, 1998, pp. 163-166. doi:10.1130/0091-7613(1998)026<0163:TSATAO>2.3.CO;2
- A. Hofmann and T. Kusky, “The Belingwe Greenstone Belt: Ensialic or Oceanic?” Developments in Precambrian Geology, Vol. 13, 2004, pp. 487-538.
- V. K. Gupta, P. C. Thurston and T. H. Dusanowskj, “Constraints upon Models of Greenstone Belt Evolution by Gravity Modeling, Birch-Uchi Greenstones Belt, Northern Ontario,” Precambrian Research, Vol. 16, No. 4, 1982, pp. 233-255. doi:10.1016/0301-9268(82)90062-6
- E. H. Stettler, J. H. de Beer, D. Eberle, J. Ludden and M. Mareschal, “Geophysics and Deep Structures,” In: M. J. de Wit and L. D. Ashwal, Eds., Greenstone Belts, Oxford Monograph on Geology and Geophysics, Clarendon Press, Oxford, 1997, pp 339-375.
- R. I. Gibson and P. S. Millegan, Eds., “Geologic Applications of Gravity and Magnetics: Case Histories,” Society of Exploration Geophysicists, Geophysical Reference Series 8, Tulsa, 1998.
- P. Wellman, “Upper Crust of the Pilbara Craton, Australia: 3D Geometry of a Granite/Greenstone Terrain,” Precambrian Research, Vol. 104, No. 3-4, 2000, pp. 175-186. doi:10.1016/S0301-9268(00)00092-9
- A. P. Peschler, K. Benn and R. W. Roest, “Insights on Archean Continental Geodynamics from Gravity Modelling of Granite-Greenstone Terranes,” Journal of Geodynamics, Vol. 38, No. 2, 2004, pp. 185-207. doi:10.1016/j.jog.2004.06.005
- M. A. McLean and P. G. Betts, “Geophysical Constraints of Shear Zones and Geometry of the Hiltaba Suite Granites in the Western Gawler Craton, Australia,” Australian Journal of Earth Sciences, Vol. 50, No. 4, 2003, pp. 525- 541.
- P. J. Treloar and T. G. Blenkinsop, “Archaean Deformation Patterns in Zimbabwe: True Indicators of TibetanStyle Crustal Extrusion or Not?” In: M. P. Coward and A. C. Ries, Eds., Early Precambrian Processes, Geological Society Special Publication 95, 1995, pp. 87-108.
- M. J. De Wit, “On Archean Granites, Greenstones, Cratons and Tectonics: Does the Evidence Demand a Verdict?” Precambrian Research, Vol. 91, No. 1, 1998, pp. 181-226. doi:10.1016/S0301-9268(98)00043-6
- W. B. Hamilton, “Archean Magmatism and Deformation were not Products of Plate Tectonics,” Precambrian Research, Vol. 91, No. 1, 1998, pp. 143-179. doi:10.1016/S0301-9268(98)00042-4
- M. J. Van Kranendonk, R. H. Smithies and V. C. Bennett, Eds., “Earth’s Oldest Rocks,” Elsevier, Amsterdam, 2007.
- J. F. Wilson, “A craton and Its Cracks: Some of the Behaviour of the Zimbabwe Block from the Late Archaean to the Mesozoic in Response to Horizontal Movements, and the Significance of Some of its Mafic Dyke Fracture Patterns,” Journal of African Earth Sciences, Vol. 10, No. 3, 1990, pp. 483-501. doi:10.1016/0899-5362(90)90101-J
- C. W. Stowe, “Wrench Tectonics in the Archaean Rhodesian Craton,” Transactions of the Geological Society of South Africa, Vol. 83, No. 2, 1980, pp. 193-205.
- N. Baglow, “The Epoch Nickel Deposit, Zimbabwe,” In: C. R. Anhaeusser and S. Maske, Eds., Mineral Deposits of Southern Africa, Geological Society of South Africa, Johannesburg, 1986, pp 359-376.
- J. F. Wilson, D. L. Jones and J. D. Kramers, “Mafic Dyke Swarms in Zimbabwe,” In: H. C. Halls and W. F. Fahrig, Eds., Mafic Dyke Swarms, Geological Association of Canada Special Paper 34, 1987, pp. 433-444.
- R. J. Blakely, “Potential Theory in Gravity and Magnetic Applications,” Cambridge University Press, Cambridge, 1995.
- P. R. Milligan and P. J. Gunn, “Enhancement and Presentation of Airborne Geophysical Data,” AGSO Journal of Australian Geology & Geophysics, Vol. 17, No. 2, 1997, pp. 63-75.
- S. W. Letros, D. W. Strangway and J. Geissman, “Apparent Susceptibility Mapping in the Kirkland Lake Area, Ontario, Abitibi Greenstone Belt,” Canadian Journal of Earth Sciences, Vol. 20, No. 4, 1983, pp. 548-560. doi:10.1139/e83-052
- H. J. Broome, “Generation and Interpretation of Geophysical Images with Examples from the Rae Province, Northwestern Canada Shield,” Geophysics, Vol. 55, No. 8, 1990, pp. 977-997.
- A. Martin, “The Geology of the Belingwe-Shabani Schist Belt,” Rhodesia Geological Survey Bulletin 83, Salisbury, 1978.
- J. B. Moody, “Serpentinisation: A Review,” Lithos, Vol. 9, No. 2, 1976, pp. 125-138. doi:10.1016/0024-4937(76)90030-X
- F. S. Grant, “Aeromagnetics, Geology and Ore Environments, I. Magnetite in Igneous, Sedimentary and Metamorphic Rocks: An Overview,” Geoexploration, Vol. 23, No. 3, 1985, pp. 303-333. doi:10.1016/0016-7142(85)90001-8
- R. T. Ranganai and C. J. Ebinger, “Aeromagnetic and LANDSAT TM Structural Interpretation for Identifying Regional Groundwater Exploration Targets, South-Central Zimbabwe Craton,” Journal of Applied Geophysics, Vol. 65, No. 2, 2008, pp. 73-83. doi:10.1016/j.jafrearsci.2008.01.011
- R. T. Ranganai, “Geophysical Investigations of the Granite-Greenstone Terrain in the South-Central Zimbabwe Archaean Craton,” Ph.D. Thesis, University of Leeds, Leeds, 1995.
- C. V. Reeves, “The Geophysical Mapping of Mesozoic Dyke Swarms in Southern Africa and Their Origin in the Disruption of Gondwana,” Journal of African Earth Sciences, Vol. 30, No. 3, 2000, pp. 499-513. doi:10.1016/S0899-5362(00)00035-X
- F. Jourdan, G. Feraud, H. Bertrand, A. B. Kampunzu, G. Tshoso, B. Le Gall, J. J. Tiercelin and P. Capiez, “The Karoo Triple Junction Questioned: Evidence from Jurassic and Proterozoic 40Ar/39Ar Ages and Geochemistry of the Giant Okavango Dyke Swarm (Botswana),” Earth and Planetary Science Letters, Vol. 222, No. 3, 2004, pp. 989-1006. doi:10.1016/j.epsl.2004.03.017
- O. Gwavava, “A Regional Gravity Study of the Limpopo Belt and Mechanisms of Isostatic Compensation in the Region,” Ph.D. Thesis, University of Zimbabwe, Harare, 1990.
- K. Fisk and M. T. Hawadi, “The National Gravity Dataset of Zimbabwe,” Zimbabwe Geological Survey Bulletin No. 103, Harare, 1996.
- H. Moritz, “Geodetic Reference System 1980,” Bulletin of Geodesy, Vol. 58, No. 3, 1984, pp. 388-398. doi:10.1007/BF02519014
- W. H. F. Smith and P. Wessel, “Gridding with Continuous Curvature Splines in Tension,” Geophysics, Vol. 16, 1990, pp. 222-227.
- R. T. Ranganai and O. Gwavava, “Gravity Modelling of Late Archaean Chilimanzi and Razi plutons, Zimbabwe craton,” 23rd Colloquium of African Geology CAG23 Abstracts, Johannesburg, 2011, p. 344.
- D. M. Robertson, “Potash Granites of the Southern Edge of the Rhodesian Craton and the Northern Granulite Zone of the Limpopo Belt,” In: L. A. Lister, Ed., Symposium on Granites, Gneisses and Related Rocks, Geological Society of South Africa, Special Publication 3, Salisbury, 1973, pp 265-276.
- I. J. Won and M. Bevis, “Computing the Gravitational and Magnetic Anomalies Due to a Polygon: Algorithms and Fortran Subroutines,” Geophysics, Vol. 52, No. 2, 1987, pp. 232-238.
- C. Subrahmanyam and R. K. Verma, “Gravity Interpretation of the Dharwar Greenstone-Gneiss-Granite Terrain in the Southern Indian Shield and Its Geological Implications,” Tectonophysics, Vol. 84, No. 2-4, 1982, pp. 225- 245. doi:10.1016/0040-1951(82)90161-5
- R. C. A. Minnitt and C. R. Anhaeusser, “Gravitational and Diapiric Structural History of the Eastern Portion of the Archean Murchison Greenstone Belt, South Africa,” Journal of African Earth Sciences, Vol. 15, No. 3-4, 1992, pp. 429-440. doi:10.1016/0899-5362(92)90026-9
- J. R. Ridley, J. R. Vearncombe and H. A. Jelsma, “Relations between Greenstone Belts and Associated Granitoids,” In: M. J. de Wit and L. D. Ashwal, Eds., Greenstone Belts, Oxford Monograph on Geology and Geophysics, Clarendon Press, Oxford, 1997, pp. 376-397.
- A. F. M. Kisters and C. R. Anhaeusser, “Emplacement Features of Archaean TTG Plutons along the Southern Margin of the Barberton Greenstone Belt, South Africa,” Precambrian Research, Vol. 75, No. 1-2, 1995, pp. 1-15. doi:10.1016/0301-9268(95)00003-N
- H. A. Jelsma, P. A. van der Beek amd M. L. Vinyu, “Tectonic Evolution of the Bindura-Shamva Greenstone Belt (Northern Zimbabwe): Progressive Deformation Around Diapiric Batholiths,” Journal of Structural Geology, Vol. 15, No. 2, 1993, pp. 163-176. doi:10.1016/0191-8141(93)90093-P
- J. H. de Beer and E. Stettler, “Geophysics and the Deep Structure of the Barberton Belt: A review,” 11th SAGA Biennial Technical Meeting and Exhibition, Swaziland, 16-18 September 2009, pp. 2-6.