International Journal of Geosciences
Vol. 3 No. 4A (2012) , Article ID: 23230 , 9 pages DOI:10.4236/ijg.2012.324085
Re-Evaluations of Seismic Hazard of Syria
1Department of Earth Sciences, Helwan University, Cairo, Egypt
2Researcher in National Earthquake Center, Damascus, Syria
3Institute of Earthquake Engineering and Engineering Seismology (IZIIS), Skopje, Macedonia
Email: hat_m74@yahoo.com
Received May 21, 2012; revised June 26, 2012; accepted July 8, 2012
Keywords: Earthquake Seismology; Engineering Seismology
ABSTRACT
Seismic Hazard analysis requires geologic, seismologic and geophysical data to be applied in a certain area. There are several studies were established to estimate the seismic hazard of Syria. In this study, the authors integrated the historical, instrumental seismological data, the structural-geological data of Syria and the subsurface tectonic map of Syria to re-evaluate the seismic hazard of Syria. The current research introduces new seismic source models which were not used before. The source models were chosen according to the structural and tectonic setting of the study area. The recurrence relationship was applied for each source for obtaining the regression coefficients related to each seismic source. Finally, the seismic hazard maps were plotted for (50, 100, 200, 475, and 1000) return periods by using Poisson probabilistic method. Regarding with theses resulted maps, there is obvious increase of the seismicity from the eastern parts of Syria to the western parts which reaches to its maximum value in El-Ghab region.
1. Introduction
The study area extends between Latitudes (35˚ & 37˚N) and Longitudes (35˚ & 42˚E), Figure 1. It represents Syrian lands and covers about 185, 180 km2 in area. Syria is located at the northern part of the Arabian Plate, which includes the Arabian Peninsula, Palestine, Syria, Lebanon, Jordan, and Iraq.
The Arabian Plate is bordered from the West by the Red Sea and the Dead Sea fault system (Syrian-African Rift), which extends between Aquaba Gulf and Escandaron Gulf. In the southern part it is bounded by Aden, and the Persian Sub-plate (Zagarouse Mountains) in the East as well as the Anatolian Plate (Torous Mountains). In the northern side is the Anatolian Plate, Figure 1.
The movement of the earth crust differs from one part to another in the Middle East region according to the Arabian Plate movement, which moves to the north in a rotating movement counter clock wise [1]. This rotating movement causes the induction of the Arabian Plate under the Anatolian Plate and Persian one. This in consequence causes the displacement of the Persian to the east and the Anatolian to the West. The displacement rate of the Arabian Plate was estimated as about 1 cm/year approximately.
According to [2], the Syrian lands can be divided into three main tectonic regimes: the first one is the Dead Sea rift system which is represented by N-S left lateral strike slip faults system. The second one is the Palmyrides mega-tectonic shear zone which is characterized by highly repeated folding and NE-SW faults system. The third tectonic zone is the Euphrate system which is characterized by the NW-SE normal faults system.
2. Seismic Hazard Methodology
2.1. Seismic Sources Modeling
The seismic data which we used include instrumental and historical data sets. The digital instrumental records came from the Syrian National Earthquake Center. We obtained the historical data from [3]. We released the after-shocks from the instrumental records by using the computer programming taking in consideration the nature of earthquake coda-magnitude type of data and it is related analysis [4]. We used in this study the method of [5] which includes two models. The first one is the seismicity model which determines all the seismic sources in the area of interest, then describing the seismicity of each zone in terms of the recurrence relationship of the seismic records with magnitude greater than or equals certain value.
The second model is the attenuation model which associates the seismic record in each zone with the magnitude, distance and the zone characteristics. Depending on the integration between the geological, the subsurface geophysical, the historical and the instrumental data of Syria, we divided Syria into 13 seismic zones of area type, Figure 2.
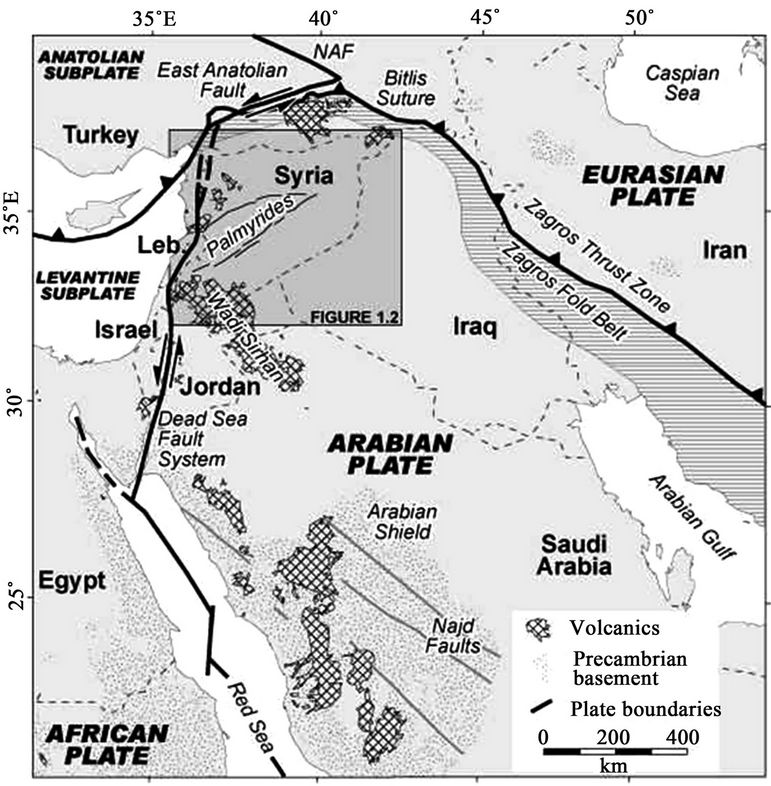
Figure 1. The main tectonic trends of Syria, after Cornell University, USA 2001.
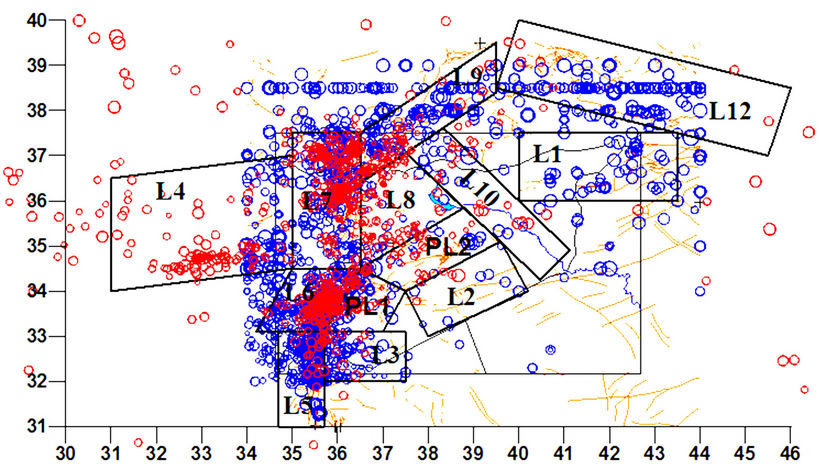
Figure 2. Seismic source models of Syria.
2.1.1. Source L-1 (Abdel Aziez—Senjar Upleft)
The focal mechanism of this zone is related to the intersection between E-W normal fault system and the main NE-SW reverse fault.
2.1.2. Source Zone L-2 (Rutbah Uplift)
This zone is distributed along the Rutbah Uplift and the detected sources were related to the normal faults (step faults) of NE-SW direction.
2.1.3. Source Zone L-3 (Al-Arab Mountain Fault)
The mechanism of the sources in this zone is related to normal faults which extend along the Arab Mountain.
2.1.4. Source Zone L-4 (Mediterranean Fault)
The Mediterranean source zone seismicity is related to the thrust fault system of E-W direction. This fault system was produced as a result of a simple compressional fold thrust direction related to the north-south compressive stress [6].
2.1.5. Source Zone L-5 (Dead Sea Fault)
The focal mechanism of this source is related to Dead Sea left lateral strike slip fault system.
2.1.6. Source Zone L-6 (Yamona Fault)
This source extends along Yamona left-lateral strike slip fault of N-S direction and El-Room normal fault of NWSE direction and its seismicity is related in general to these two main faults.
2.1.7. Source Zone L-7 (Al-Ghab Fault)
The seismicity of this source zone is related in general to the Al-Ghab fault system which is a part of the left-lateral strike slip African Syrian system (Dead Sea fault system) of N-S direction. Furthermore, the increasing of the intensity of seismicity in the northern part of the source was interpreted due to the overlapping between Eastern Anatolian fault of left-lateral strike slip type with Al-Ghab fault system [7].
2.1.8. Source L-8 (Alepo Fault System)
The focal mechanism of this zone is related to NE-SW normal faults.
2.1.9. Source L-9 (Eastern Anatolian Fault )
This zone is extended along the Eastern Anatolian fault of left-lateral strike slip component which is responsible for the seismicity of this zone.
2.1.10. Source L-10 (Euphrate Fault System)
The Seismicity of this zone is related to the normal faults of opposite throw which are responsible for the formation of the main channel of Euphrate River.
2.1.11. Source PL-1 (Palmyrides Fault System)
The seismicity of this zone is related to the NE-SW mega-tectonic shear zone (Syrian Arch System) and its corresponding fault system. Furthermore the intensive seismicity at the southern western portion of this zone is related to the junction between Yamona fault system and the Palmyrides fault system.
2.1.12. Source PL-2 (Palmyrides Fault System)
This zone is characterized by highly complicated tectonic regimes including the intersection between the NE-SW diagonal faults (with strike slip component and reverse slip one) and the NW-SE normal faults. This complicated tectonic setting resulting in the fluctuating distribution of the intensity inside the seismic source of this zone.
2.1.13. Source L-12 (Bitlis Suture Zone)
The higher intensive seismicity of this zone is related to the thrust fault system of the Bitlis suture zone (collision zone).
3. Earthquake Recurrence Relationship
Recurrence relationships are formulas relating the frequency of occurrence with the size parameter of the seismic event. These relationships are empirically obtained by curve fitting or regression analysis for each seismic source [8]. Thus, for a seismic area source, the seismic data (historical and instrumental) for the total area source are used to obtain the recurrence relationship. Basically, the recurrence relationship is represented in a functional form given by the equation:
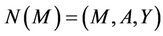 (1)
(1)
M = Richter Magnitude.
A = Area of the source under consideration.
Y = Time period over which the seismic data were collected; usually in years.
 = Number of earthquakes with Richter Magnitude greater than M.
The most widely used format for the recurrence relationship is the log-linear format:
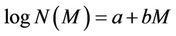 (2)
(2)
 (3)
(3)
 (4)
(4)
 for area source(5)
α', β: Normalized regression coefficients.
 = Normalized mean number of events larger than Richter Magnitude M for a unit time (1 year) and unit area or length. In other words,
  represents the number of events on a given source per unit area (or length) of that source and for unit of time (usually one year).
Figures 3 and 4 show the regression lines corresponding to the seismic zones L7 and L6 respectively. The parameters of the different seismic sources and their recurrence relationships are listed in Table 1.
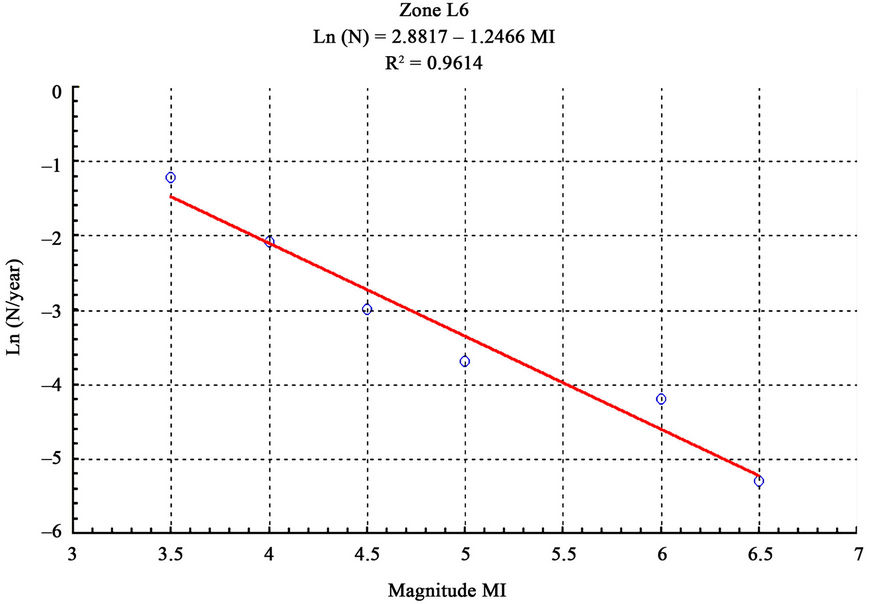
Figure 3. The regression line related to the seismic source L6.
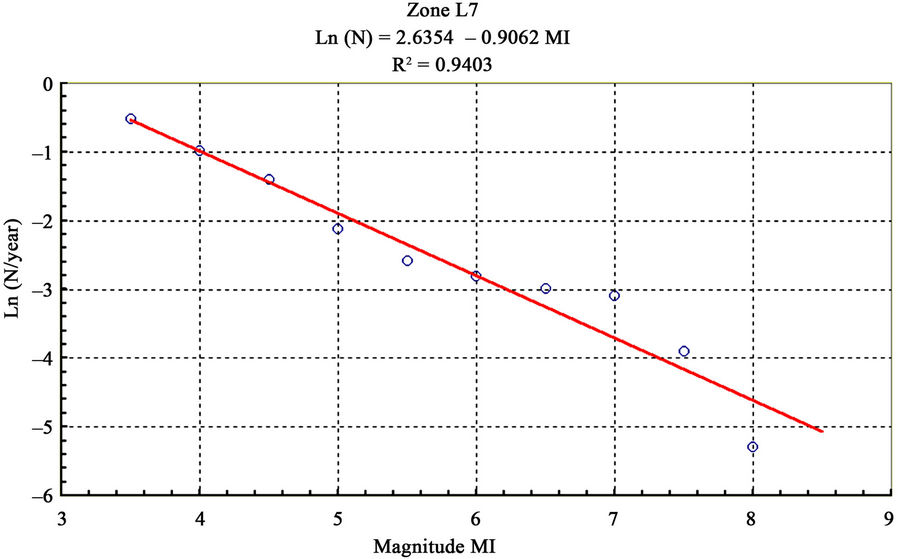
Figure 4. The regression line related to the seismic source L7.
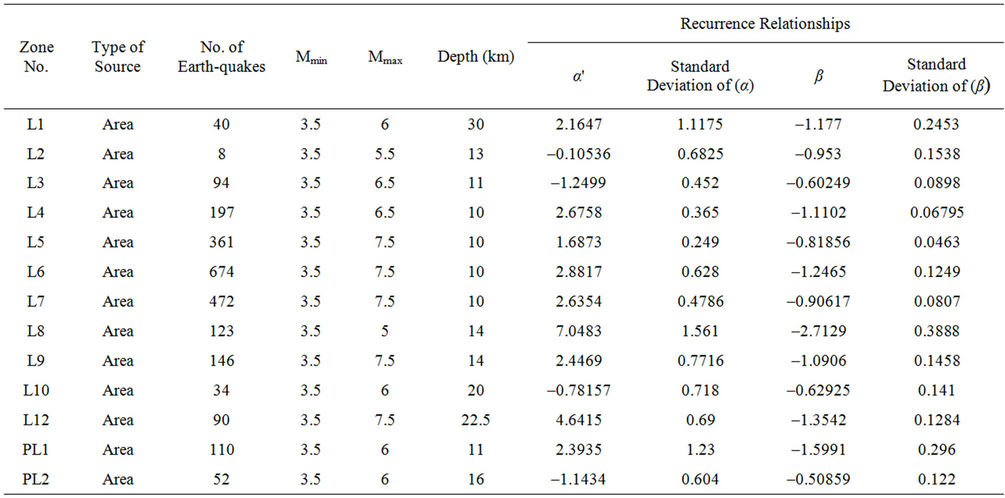
Table 1. The parameters of seismic source models.
4. Attenuation Relationship
When a rupture occurs along the fault plane, vibratory ground motions are generated. These motions travel out from the source in a form of body and surface waves. Then these waves attenuate by traveling away from the source. The type and amount of attenuation depends on many factors. Attenuation is defined as a decrease in the size of the peak ground acceleration PGA, with the distance from the hypocenter. The decreasing is related to the geometrical spreading of the seismic energy as well as the dispersion of the seismic energy due to the physical characteristics of the transmitting medium. However, there are no sufficient strong ground motion data in Syria to obtain the attenuation relationship. As a result, we will use the Esteva’s attenuation Equation [9]:
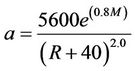 (6)
(6)
5. Poisson’s Model of Seismic Occurrences
The earthquake occurrences in space and time belong to the general category of stochastic processes. Therefore, some of the stochastic models from the probability theory are used for their modeling. The two most commonly applied stochastic models for generation of the number of earthquake occurrences are the Poison’s and the Markov’s processes.
A Poisson’s process assumes that earthquake occurrences represent the processes which are independent from time and space and have no “memory in time”. The Poisson’s model can be written as [10]:
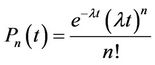 (7)
(7)
where:
Pn(t) = Probability of having n events in future time period t.
n = Number of events.
λ = Mean rate of occurrence.
Then, from the Poisson conditions on spatial independence, we can obtain the cumulative distribution function of peak ground acceleration for this area source [11]:
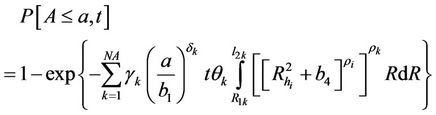 (8)
(8)
6. Seismic Hazard Maps
Considering the various types of sources surrounding a site considered, their location and focal depth as well as attenuation patterns characterizing the region analyzed, cumulative distribution function of peak ground acceleration can be computed by using Equation (8). Then for a given probability of exceedance , in other words for a specific hazard level, the PGA values can be computed. By using the aid of computer program (HAZ81), we divided the study area into a grid with 0.25 × 0.25 degree area.
The PGA values for given property of exceedence, derived for each site or for each nodes of the grid adopted. The result from a grid of different site in a region can be used to construct seismic hazard maps showing the contours of equal average PGA. That with certain probability will not be exceeded for a time period of (T) years.
According to [10], the seismic motion level can be determined either by its mean return period time or by its probability of exceedance. The return period can be determined by the following equation [11]:
 (9)
(9)
where:
TR = Return-period of ground motion in years.
TL = The average life time of a building in years.
PR = The reference probability of exceedance.
There are two types of seismic hazard maps; the first is high level of risk which corresponds to important structures such as power plants and bridge. This type can be represented by the maps of return periods (475 and 1000 years). The second is the low level of risk which corresponds to less important properties. This type is represented by the maps of return periods (50, and 100, and 225 years).
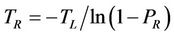
Figures 5-9 depict the seismic hazard maps of Syria. They are corresponding to (50, 100, 225, 475 and 1000 years) of return periods respectively and (20% PR - 10 year TL, 10% PR - 10 year TL, 20% PR - 50 year TL , 10% PR - 50 year TL , and 5% PR - 50 year TL) respectively. With the inspection of Figure 9, there is an increment in the values of PGA from the eastern sides to the western sides and the maximum value of PGA is related to Al Ghab seismic zone.
Although the Deterministic Seismic Hazard Assessment method (DSHA) does not address the temporal characteristic of ground motion (i.e. the occurrence interval or frequency and its associated uncertainty), it still one of the best method in use. The maximum credible earthquakes are considered, so, the lack of seismic records along the occurrence interval can be overcome [12].
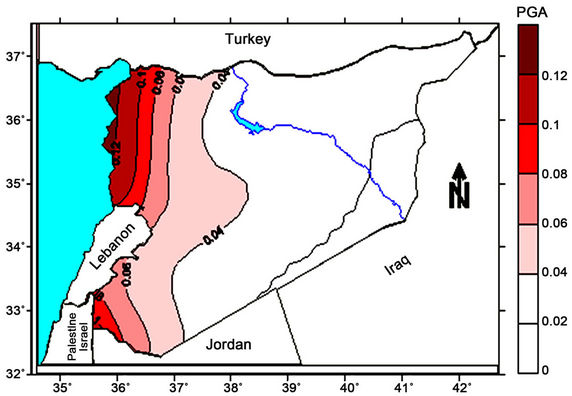
Figure 5. Seismic hazard map of Syria, distribution of PGA for return period of 50 years.
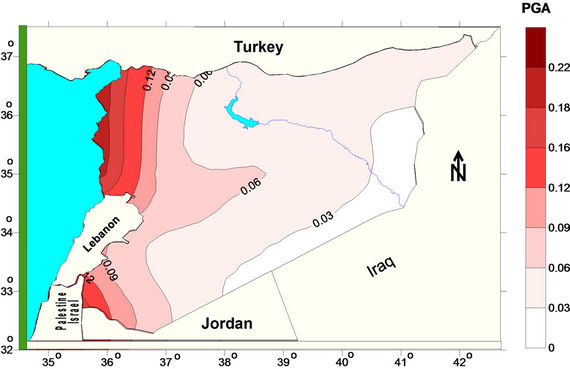
Figure 6. Seismic hazard map of Syria, distribution of PGA for return period of 100 years.
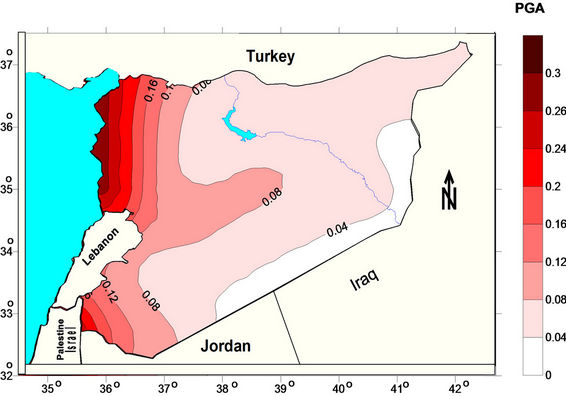
Figure 7. Seismic hazard map of Syria, distribution of PGA for return period of 224 years.
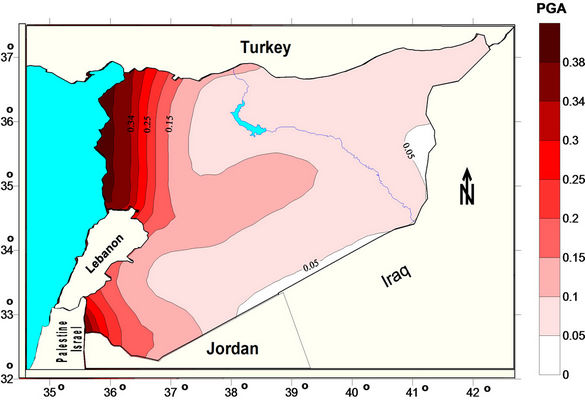
Figure 8. Seismic hazard map of Syria, distribution of PGA for return period of 475 years.
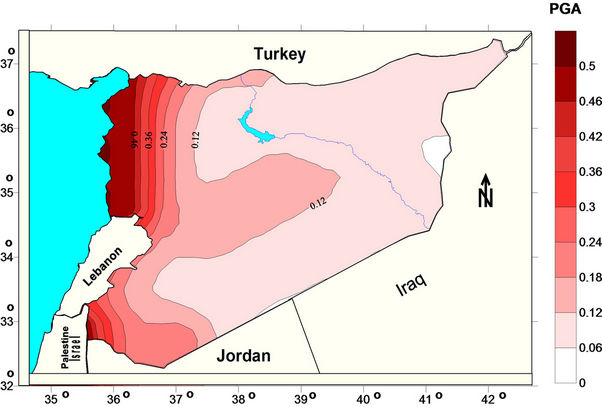
Figure 9. Seismic hazard map of Syria, distribution of PGA for return period of 1000 years.
A general look at the resulted seismic hazard maps of Syria of return periods 50, 100, 200, 475, and 1000 years shows a gradual increase of the seismic hazard from the East and a sharp increase when we reach the western edge of Syria. This can be adjoined to the existence of the series of strike slip faults: El-Ghab fault in the N-W and the Dead Sea active fault system.
Unlike countries such as the USA, Syria as developing country cannot afford the expensive USA-earthquake code or even the European-code which can establish that type of buildings resist earthquakes of the 10th magnitude [13]. As [14] concluded that it is required to originate new techniques for Seismic Hazard Assessment (SHA) and clearly researchers should differentiate between hazard moderation and risk decrease in both developed and developing countries. There are different methods of SHA such as the deterministic method DSHA and the new— deterministic method NDSHA [15]. These methods can work very well in the area of high seismicity and large earthquake magnitudes like the north western part of Syria. These methods can be applied in the Syrian territory for achieving better estimation. As Syria be considered one of the developing countries, the civil urban planners and the geotechnical engineers in general will face a necessity to focus more on the seismic hazard analysis and spend more research fund in this field to reduce the cost of materials required for producing safe infrastructures which can defy the intense high magnitudes earthquakes specially in the western sites.
7. Conclusions
1) Regarding with seismic hazard maps, we can detect an increasing in the value of the PGA from the eastern side of Syria to the western side.
2) The maximum expected design value of PGA (0.38 g for R.P. 475 years) is concentrated at the north western part of Syria (Escondaron, Latekia and Tartous cities).
3) According to the Syrian Building Code (1995), the design PGA value (0.4 g for R.P. 1000 years) covers all western parts of Syria (Edlib, Aleppo, Escondaron, Latekia, Tartous, Dara as well as some parts of Hama, Homs, Damascus and Swaida cities). Also some parts in the center of Syria (Palmyra).
4) The accepted Seismic hazard map in Syrian Building Code (1995) for R.P. 1000 years is not consistent with the methodology of Earthquake Coding all over the world, so, it is convenient to replace it to be consistent ones.
5) We recommend that; it is necessary to construct micro-zonation maps for the most important cities in Syria such as Damascus, because these maps give us precise and more details about the expected seismic hazard and its influence by local site conditions.
8. Acknowledgements
We would like to express our deepest gratitude to all the Faculty members and staff of IZIIS institute for their highly intensive efforts and their nice caring of us. In addition, we would like to send our appreciation to the Syrian National Earthquake Center for supplying us by the required data. We are really indebted to Prof. Mihailov, The head of the Engineering Seismology Unit in IZIIS, who sincerely supervised and guided us in this work.
We truthfully appreciated the incessant encouragement of our CADAC/2003 colleagues Mr. Mohamed Ouksili, Abdel Mottalib Said, and Floria Quesada for their continuous help. Finally, we send our acknowledgments to Dr. Amin Ismaeil, Helawn University for his advice and help.
REFERENCES
- M. Barazangi, “The Seismic Settings of Syria and Arabic Region,” Syrian Journal of Geology, Vol. 11, 1998, pp. 1- 65.
- Cornell University, “Tectonic Map of Syria,” Institute for the Study of the Continents, Cornell University Press, New York, 2001.
- Syrian National Earthquake Center (SNEC), “Earthquakes Seismicity Data Set of Syria,” Bulletins of Syrian National Earthquake Center, Vol. 1, No. 1, 1995, pp. 1- 10.
- K. Akik, “Analysis of Seismic Coda of Local Earthquakes as Scattered Waves,” Journal of Geophysical Research, Vol. 74, No. 2, 1969, pp. 615-631. doi:10.1029/JB074i002p00615
- C. A. Cornell, “Engineering Seismic Risk,” Bulletin of the Seismological Society of America, Vol. 58, No. 5, 1968, pp. 1583-1606.
- N. Ambrseys and M. Barazangi, “The 1759 Earthquake in the Bakaa Valley, Implications for Earthquake Hazard Assessment in the Eastern Mediterranean Region,” Journal of Geophysical Research, Vol. 94, No. B4, 1989, pp. 4007-4013. doi:10.1029/JB094iB04p04007
- A. El Hariri, “Seismotectonic Study, Seismic Hazard Assessment and Zonation of the Arab Republic of Syria,” M.Sc. Thesis, Institute of Earthquake Engineering and Engineering Seismology, Skopje, 1991.
- V. Mihailov, “Seismic Hazard Study—Data, Maps and Related,” European Conference on Earthquake Engineering, Vol. 2, Athens, 20-25 September 1982, pp. 51- 60.
- L. Esteva and R. Villaverde, “Seismic Risk, Design Spectra and Structural Reliability,” The 5th World Conference on Earthquake Engineering, Vol. 2, Rome, 1974, pp. 2586-2596.
- S. L. Kramer, “Geotechnical Earthquake Engineering,” Prentice Hall Press, Upper Saddle River, 1996.
- V. Mihailov, “Basic Principles in the Seismology and Earthquake Engineering,” Lecture Note, Institute of Earthquake Engineering and Engineering Seismology, Skopje, 2003.
- Z. Wang, “Seismic Hazard Assessment: Issues and Alternatives,” Pure and Applied Geophysics, Vol. 168, No. 1-2, 2011, pp. 11-25. doi:10.1007/s00024-010-0148-3
- Syrian Earthquake Building Code, “Syrian Engineering Association Publications,” Damascus, 2004.
- G. F. Panza, K. Irikura, M. Kouteva, A. Peresan, Z. Wang and R. Saragoni, “Advanced Seismic Hazard Assessment,” Pure and Applied Geophysics, Vol. 168, No. 1-2, 2011, pp. 1-9. doi:10.1007/s00024-010-0179-9
- E. Zucollo, F. Vaccari, A. Peresan and G. F. Panza, “Neo-Deterministic and Probabilistic Seismic Hazard Assessments: A Comparison over the Italian Territory,” Pure and Applied Geophysics, Vol. 168, No. 1-2, 2011, pp. 69-83. doi:10.1007/s00024-010-0151-8