International Journal of Geosciences
Vol. 3 No. 3 (2012) , Article ID: 21212 , 10 pages DOI:10.4236/ijg.2012.33051
Synergetic Use of Satellite Image and DEM for Identification of Landforms in a Ridge-Valley Topography
National Remote Sensing Centre (NRSC), Indian Space Research Organisation (ISRO), Hyderabad, India
Email: trmartha@rediffmail.com
Received April 11, 2012; revised May 10, 2012; accepted June 2, 2012
Keywords: Geomorphology; Resourcesat-1; ASTER; India
ABSTRACT
Multispectral satellite image and digital elevation model (DEM) have emerged as the primary data sources for the mapping of landforms. They offer an opportunity to gain a fresh insight into the geomorphology of an area through landform identification using spatial, temporal, spectral and radiometric resolution of satellite images, and through the synergetic approach using DEM derivatives such as profile, slope, hill shading, contour pattern and 3-D flythrough visuals. This paper demonstrates an integrated study of Resourcesat-1 LISS III (23.5 m) image with ASTER DEM (30 m) for the identification of landforms in a rugged topography where conventional field based methods are difficult to adopt due to terrain inaccessibility. Satellite image aided by 3-D visualisation helped in accurate identification of landforms such as hogback, cuesta, plateau top and intermontane valley. The results showed that although denudational processes are active in this area, structural imprints of the strata that is mostly of proterozoic era, are still preserved.
1. Introduction
Geomorphology, the branch of science that deals with the study of landforms, is a subject of great significance because of its requirement across disciplines. Geomorphology, along with information on soil, water and vegetation has become essential for planning various developmental activities. The scope of geomorphology has further expanded with the landform maps widely used in various fields of resource surveys, environmental analysis, hydrological studies, engineering application and geotechnical studies, mineral and oil explorations and also in hazard mitigation [1-3].
Geomorphology has long been treated as a subject with landform identification by field investigation. Each of these investigations was focused on landform characterization leading to the process understanding. After more than a hundred years as a recognized discipline, landform characterization through field investigation remains central to many geomorphological studies until recent. Now, new trends have emerged that integrate field work with modern technologies such as GIS, GPS, remote sensing and elevation models, which further strengthens the study of relationship between the landforms and the processes that created them. Over the years, scientists have conducted research and shown the use fulness of spatial technologies, remote sensing and field studies in landform mapping and understanding of geomorphic processes [4].
Satellite imageries have been used for geomorphological mapping of large and remote areas along with field study and aerial photographs [5,6]. However, while aerial photographs are of restricted nature in many countries, field investigations are labour intensive. Therefore, moderate and high resolution images from civilian satellites are extensively used as a suitable alternative. But, geomorphological features are poorly represented by the pixels of satellite data having dimensions that are constant and landscape independent. Another problem in the use of remote sensing data in geomorphological mapping is that topography is not explicitly represented in the imagery, although, there may be valuable implicit expressions of a terrain in the form of shadows as shown by Craig [7], and Astaras and Soulakellis [8]. The lack of explicit topographic information has been addressed with studies integrating a digital elevation model (DEM) and its derivatives with remote sensing data that increased the classification accuracies of landforms [9-13]. Previously, creation of DEM used to be difficult task, and was mostly carried out by digitisation of contour lines or using spot heights obtained from geodetic surveys. However, now with several satellites providing stereoscopic data (e.g. Cartosat-1, ASTER and ALOS PRISM), creation of DEM is no more a difficult option [14].
Identification of landforms from remote sensing data requires understanding of the key interpretation features that can be derived from satellite images and DEMs. Pike [15] developed the idea of geometric signatures to describe the morphometric characteristics of landscapes using variables derived from DEM. A geometric signature is described as a “critical analytic tool, which describes topographic form well enough to distinguish among geomorphologically disparate landscapes” [15]. In an extension of Pike’s work, McDermid and Franklin [16] used slope profile analysis for classification of landscape features. Similarly, Chorowicz et al. [17] used a pattern recognition technique to identify strike ridges and fluvial deposits from the elementary profile analysis of a DEM. Second order derivatives along a profile were considered to be geomorphologically significant, and were used in the identification of specific landforms. Therefore, usage of DEMs has become significant in this aspect from last two decades. But, still the full potential of digital remote sensing data (satellite data and DEM) for geomorphological study is yet to be achieved, particularly, with the easy availability of DEM such as from ASTER, and remote sensing data from several civilian satellites.
The objective of the paper is to delineate the landforms in a ridge-valley complex topography with the help of Resourcesat-1 LISS-III data and DEM extracted from ASTER images up to a certain detail level which is a basic requirement in understanding the processes that have acted or are acting in the evolution of the present day landscape. Special emphasis was given to bring out the morphological attributes and probable geomorphic evolution history which led to the development of the present morphography.
2. Study Area
The study area is in the Sehore, Raisen and Hoshangabad districts of Madhya Pradesh state in India (Figure 1). The area represents a typical ridge-valley complex in the Central India. Here two areas of interest (AOI) were chosen because of their broad and distinctive geomorphic characteristics. While in AOI 1 geomorphic units such as hogback and cuesta are exposed, AOI 2 comprises of plateaus dissected with deep gorges.
2.1. Physiography
Narmada, Tawa and Denwa are the three major rivers flowing through this area (Figure 1). While Narmada and Denwa rivers flow from east to west, Tawa river flows from south to north. Several other small tributaries, mostly of ephemeral nature, are also present. The area receives an average rainfall of about 1343.5 mm. Approximately 70% - 75% area comprised of hills and plateaus, and the remaining area is in the plains of the Narmada river. Relief wise this area can be divided into three different categories; 1) less than 350 m elevation above the mean sea level (MSL), where fluvial landforms are exposed; 2) between 350 m to 500 m above the MSL, occupying ridges and valleys; and 3) between 500 m to 550 m above the MSL, covered with plateau surfaces.
2.2. Regional Geology
Major litho constituents of this area are the Mahakoshal, Vindhyan and Gondwana Super Group of rocks followed by Deccan Trap basalts. The stratigraphy of the area with exposed rock types is provided in Table 1. The Bijawar Group of meta-sediments and gneissic complex of Archaean-Proterozoic era are the minor litho constituents [18]. Quaternary alluvium is confined mainly to the Narmada valley. The disposition of the litho units are in conformity with ENE-WSW trending Son-Narmada tectonic lineament that has influenced the development of a basin landscape. The Son-Narmada lineament considered to be an active tectonic element, perhaps right from the Pre-Cambrian era, and has had its influence on the geology and geomorphology of the region in the subsequent geological periods [19].
The Gondwanas and the Deccan Traps constitute the bulk composition of ENE-WSW trending Satpura ranges in south of the Narmada river, while in the north, Vindhyan sedimentary rocks occupy a vast area in the form of regional plateau with an escarpment parallel to SonNarmada trend.
3. Data Sources
Georectified Resourcesat-1 LISS III and ASTER DEM data were used for the identification of landforms. LISS III has 23.5 spatial resolution and four bands such as green (0.52 - 0.59 μm: band 1), red (0.62 - 0.68 μm: band 2), NIR (0.77 - 0.86 μm: band 3) and SWIR (1.55 - 1.70 μm: band 4). A 30 m ASTER Global Digital Elevation Model (GDEM), downloaded freely from the ASTER GDEM website, was used in this study. Apart from the space-based data, ancillary data such as topographic map on 1:50,000 scale with a 20 m contour interval and geological map were also used in this study.
4. Methodology
The delineation of landforms was done using onscreen image interpretation techniques. Geomorphic features were interpreted based on key image elements such as shape, tone or colour, pattern, shadow, association and texture. Different band combinations of satellite data
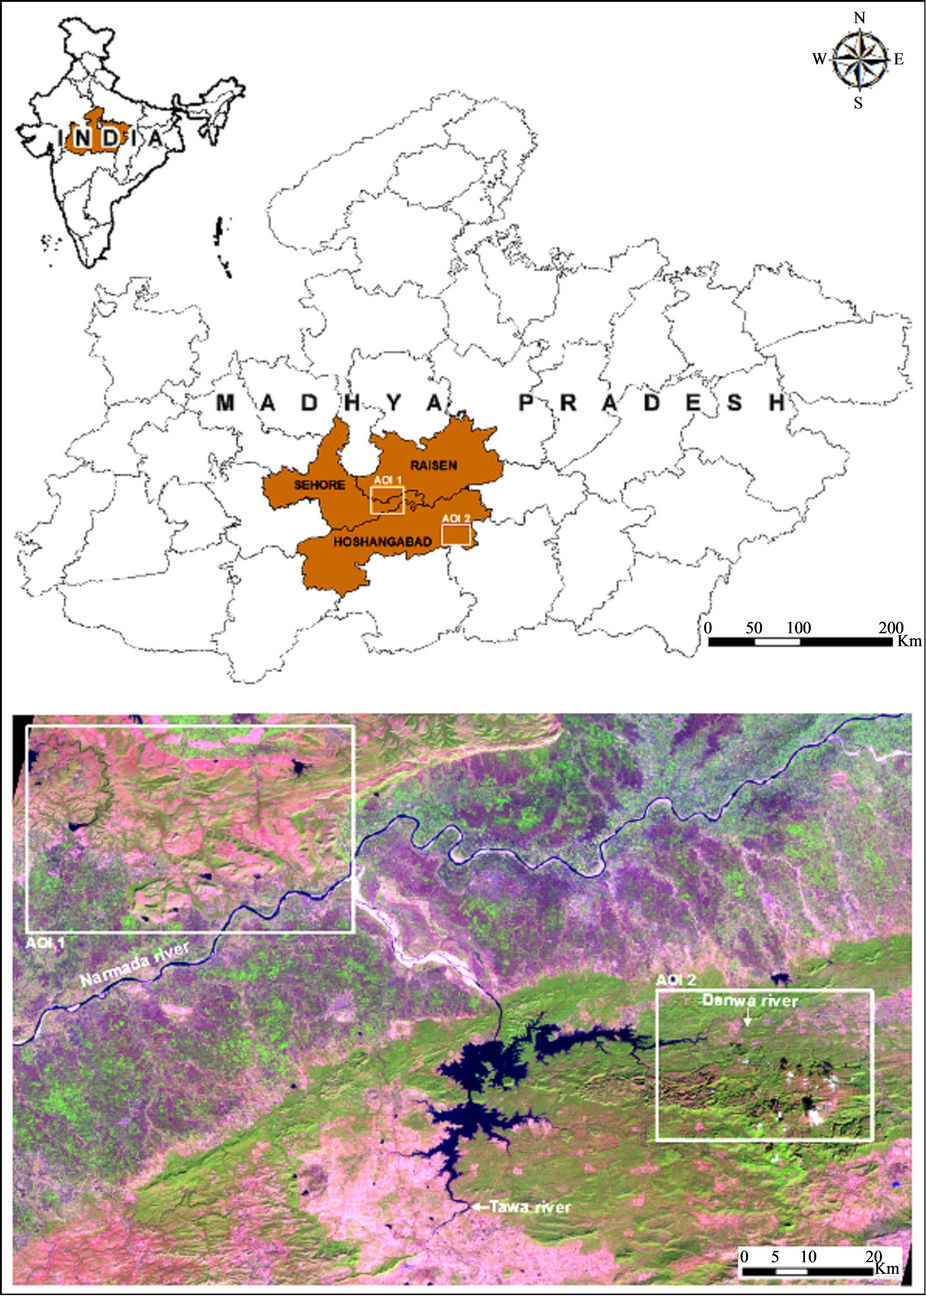
Figure 1. Location map of the study area showing two areas of interest (AOI). Resourcesat-1 LISS III image (RGB = 432) showing a synoptic view of the study area.
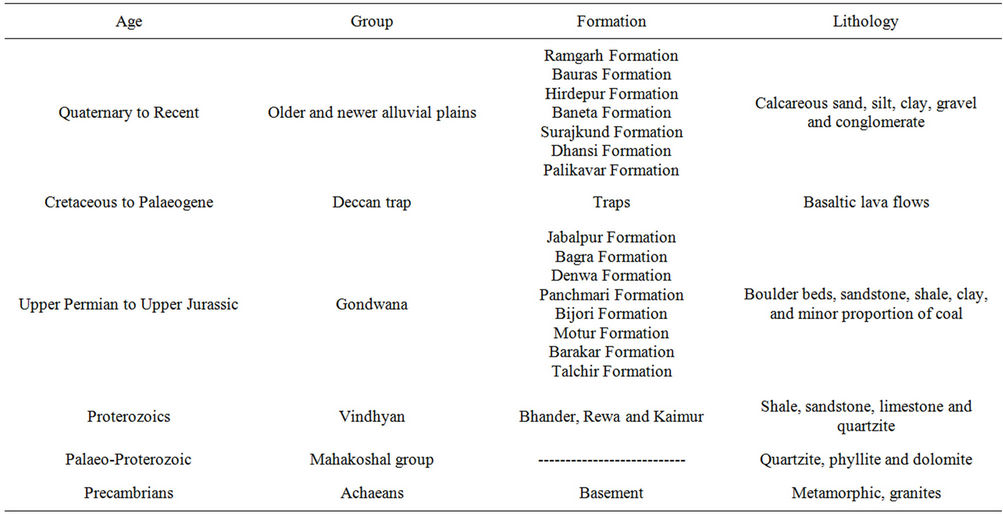
Table 1. Generalised stratigraphic succession of the region (Source: District Resource Map published by Geological Survey of India [18,20]).
were used to generate a false colour composite (FCC) for image interpretation and onscreen mapping. For example, while the use of SWIR in FCC highlighted the rocky outcrops, NIR band helped in the identification of vegetated scarp areas. The selection of optimum FCC for mapping geomorphic features was done interactively.
Visualisation of the terrain is an important component of landform identification process in a hilly area. DEM, which is digital spatial representation of the surface of the Earth, helps in identification of landforms in a hilly area. In this study, ASTER DEM was used to generate profile, slope, hill shading, contour, 3D scene fly through view, which aided in the visualization of landforms since the study area is in ridge-valley topography. Geometric signatures such as surface texture, local convexity derived from the DEM, were also considered during image interpretation. While 2D and 3D surface profiles of various landforms were created from DEM using ERDAS imagine software, 3D flythrough created using Virtual GIS module of ERDAS software helped in 3D perspective visualisation and accurate demarcation of landforms.
Satellite image, DEM and ancillary data were in the same spatial framework (projection-UTM and datumWGS 84). This helped in synergetic use of the various data sources in landform mapping.
5. Results
Landforms of structural origin were mapped in this area, which represent a typical plateau-ridge-valley complex. Most of the landforms under this class have genesis related to underlying horizontally to sub-horizontally bedded sedimentary rocks of Vindhyan and Gondwana Supergroups. Primary structures such as bedding play an important role for developing resistance of litho units, which manifested itself in different types of landform. Some of these variations are minor and some are in a mega scale. The mega scale structures have a dramatic effect on the genesis of landforms and hence mapping of such forms indirectly indicates the structural setup of the area. Landforms identified in this area using satellite image and DEM are explained below.
5.1. Dissected Structural Hills and Valleys
Dissection is mainly due to the development of secondary structures i.e. lineaments such as joints or fractures. Highly dissected hills and valleys were identified in south of the Narmada river, where sandstones and shales with near horizontal dips are exposed. This area is highly dissected by lineaments trending parallel to the NarmadaSon mega lineament (Figure 2). Large number of lineaments has also resulted in a high drainage density. Therefore, the difference in drainage density derived from the topographic sheets, was also used, while demarcating the boundary between two types of dissection pattern. 2D and 3D profiles created from the DEM were also referred while demarcating the boundary between moderately and highly dissected structural hills. Moderately dissected hills and valleys were identified north of the Narmada river where sandstones and shales of Vindhyan Supergroups are exposed (Figure 3).
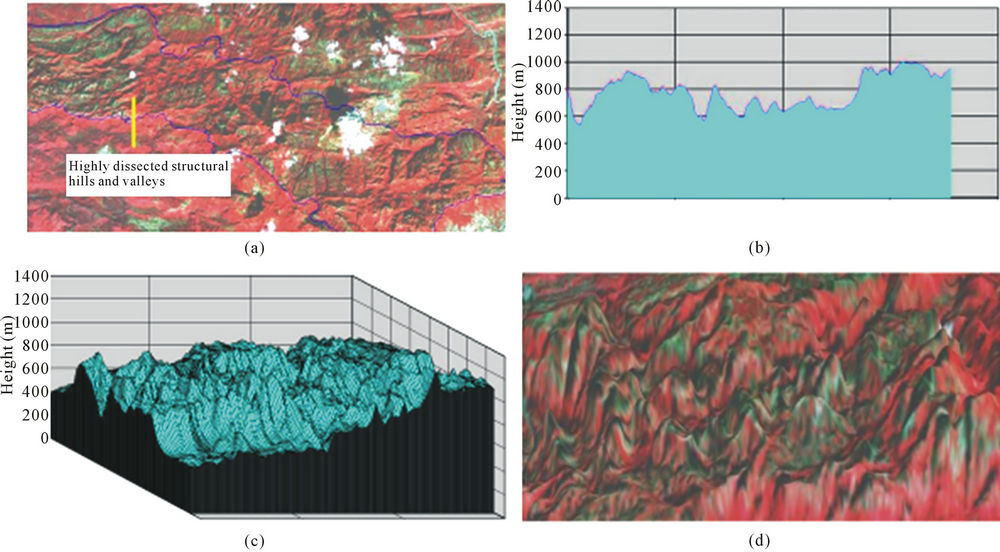
Figure 2. Highly dissected structural hills and valleys in the horizontally bedded sedimentary rocks of Gondwana Supergroup. (a) Satellite image of the area; (b) 2-D profile of created from DEM; (c) 3-D profile created from DEM; and (d) 3-D perspective view generated by draping satellite image over DEM.
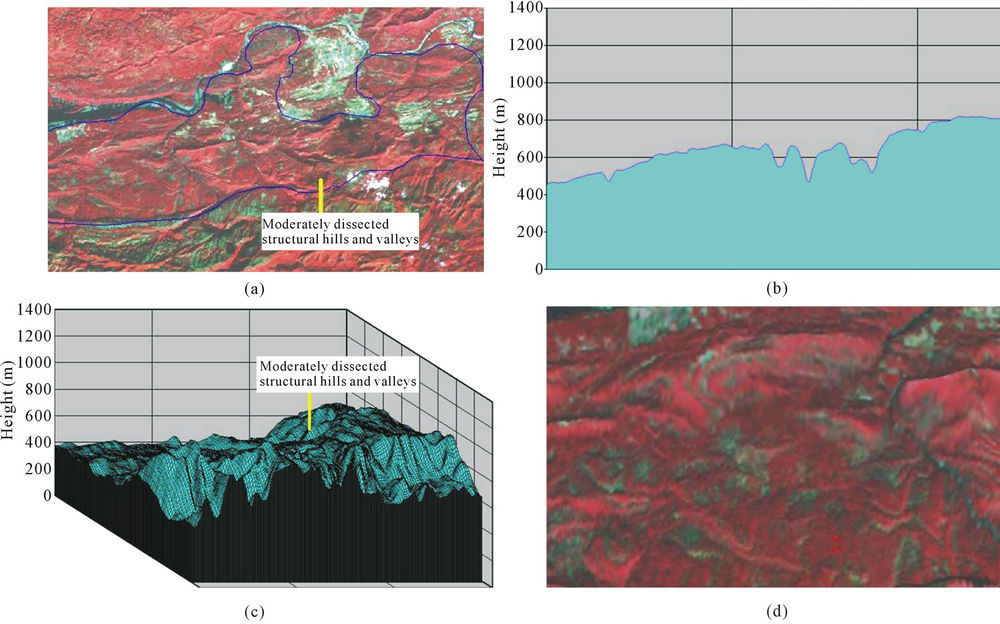
Figure 3. Moderately dissected structural hills and valleys developed in the rocks of Vindhyan Supergroup. (a) Satellite image of the area; (b) 2-D profile created from DEM; (c) 3-D profile created from the DEM; and (d) 3-D perspective view generated by draping satellite image over DEM.
5.2. Hogback
It is a long narrow ridge, which is structurally controlled by the presence of homoclinal sedimentary strata that dips steeply. It has symmetrical slopes on either side of the ridge. These structures were mostly developed on the rocks with alternate soft and hard strata. They remain more or less fixed on their position because of their steep dips (Figure 4). Although, hogbacks were mappable from the satellite images, use of 3D profile was found to be effective in demarcation of the boundary.
5.3. Cuesta
It is ridge with a gentle slope on one side and steep slope on the other side. It is especially an asymmetric ridge with one face (dip slope) long and gentle and confirming with the dip of the resistant beds that form it, and a steep slope on the opposite side (scrap slope) (Figure 5). Cuesta has a tendency to retreat. Figures 5(b) and (c) clearly shows a set of cuesta developed on gently dipping sandstone. The appreciation of dip slope and scarp slope can be done with a relative ease from the 2D and 3D profiles in comparison to the satellite image alone.
5.4. Intermontane Valley
An elongated but relatively large gently sloping depression, situated between hills and plateaus. It is developed by stream erosion. Intermontane valleys contain transported soil from the upslope areas due to which it supports agricultural activities (Figure 6). These valleys generally develop due to erosion by rivers, which are controlled by geological structures such as faults or joints. The central part of the valley may be flat or slightly undulating nature.
5.5. Plateau Top
It is a comparatively elevated flat area of great extent, and limited at least on one side by an abrupt descent. The surface may be flat, but often dissected by deep valleys
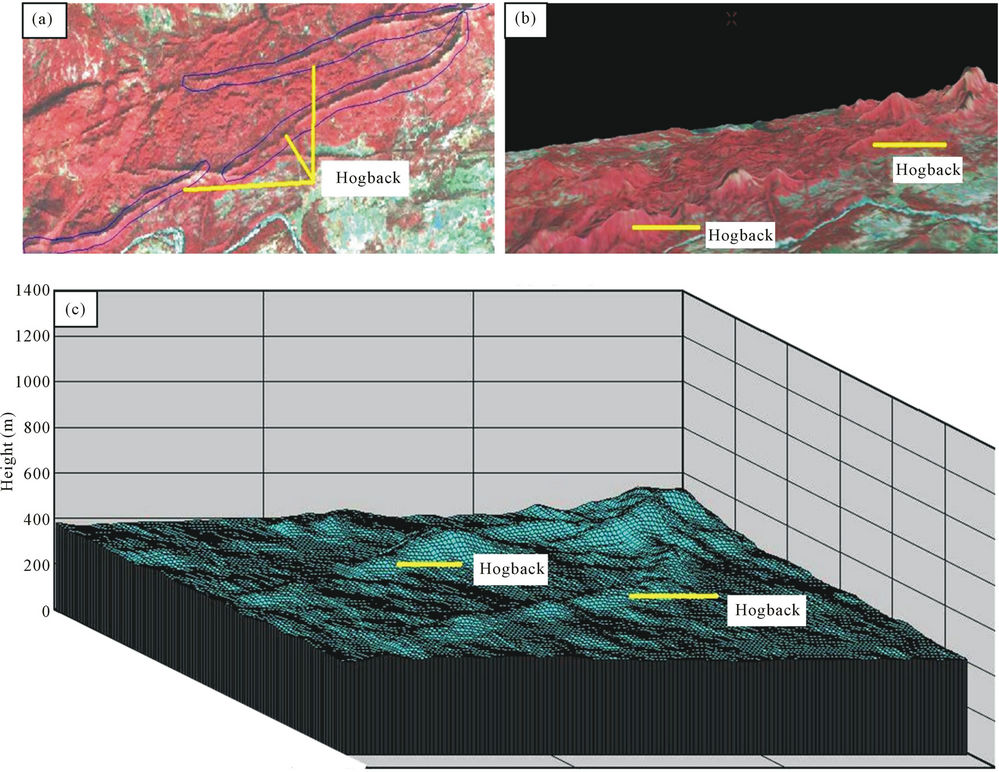
Figure 4. Hogbacks in the sandstones of Gondwana Supergroup. (a) Satellite image of the area; (b) 3-D perspective view of Hogback in the moderately dissected structural hills and valleys; and (c) 3-D profile of hogbacks created from the DEM.
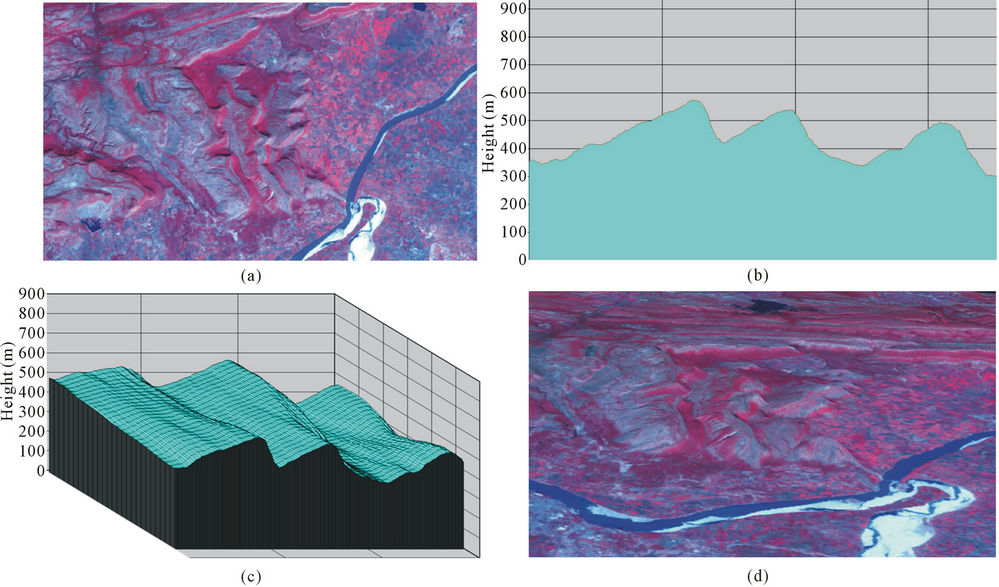
Figure 5. Cuestas developed in the moderately dipping Bhander sandstones of the Vindhyan Supergroup. (a) Satellite image (RGB = 432) of the area; (b) 2-D profile of Cuesta showing alternate steeply dipping (scarp slope) side and gentle dipping (dip slope) side; (c) 3-D profile of Cuestas extracted from the DEM; and (d) 3-D perspective view of Cuesta.
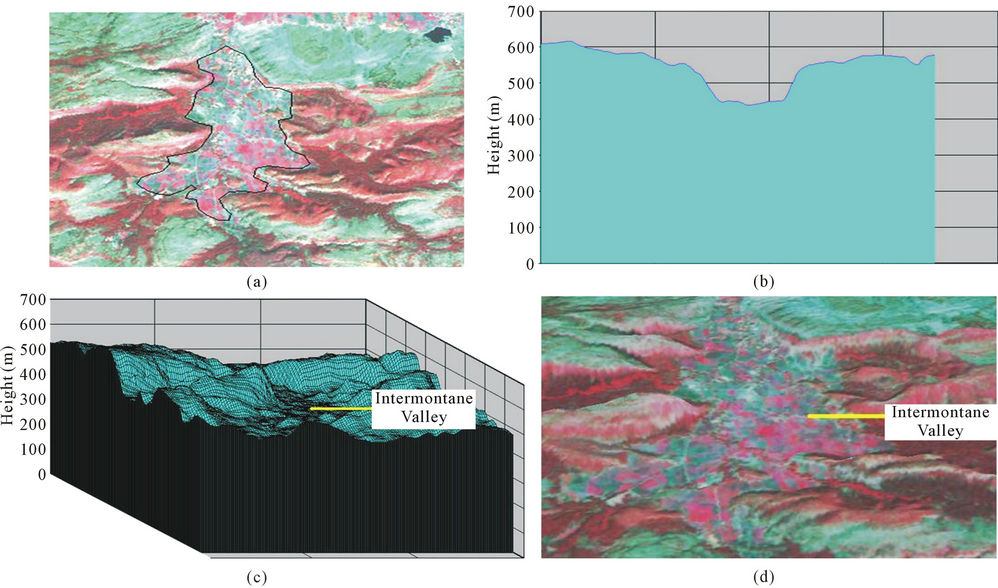
Figure 6. Intermontane valley developed in sandstones. (a) Satellite image of the area showing the intermontane valley (black outline); (b) 2-D profile of the intermontane valley clearly showing the developed depression; (c) 3-D profile of the intermontane valley created from the DEM; and (d) 3-D perspective view of the intermontane valley.
and gorges. These are higher lands and have a noticeable relief than the adjacent plains. The plateaus are sometimes dissected by drainages. The flatness in the top of the plateau surrounded by steep flanks can be better appreciated in 2D and 3D profiles (Figures 7(a) and (b)) in comparison to the satellite image (Figure 7(a)). The plateaus in this area are associated with small ridges and valleys, and therefore, they form a complex of plateauridge-valley (Figure 7).
5.6. Gorge
They are deep valleys with nearly vertical rocky walls enclosed within the mountains. They are developed due to deep undercutting by rivers. Gorges are mainly controlled by geological structures such as faults and joints. In this area, most of the gorges are developed along the E-W trending lineaments (Figure 8). The 3D profiles created from the DEM aided in identification of gorges accurately.
6. Conclusions
Identification of landforms using key interpretation features such as image tone, profiling, association and terrain shadow supported by 3D flythrough was demonstrated in this paper. Since the study area is in a ridgevalley topography, the profiles (2D and 3D) derived from ASTER DEM were very useful in the visualisation of the terrain, which is essential in geomorphological mapping. Using these data and method, landforms such as hogback, cuesta, plateau top, gorge and intermontane valley were identified. These landforms were developed mainly due to the control by the primary structure i.e. bedding in the rocks which are of proterozoic era.
This study highlighted that the 30 m global DEM from ASTER, freely downloadable now, can be used effectively for the mapping of geomorphic features at medium scale (1:100,000 or 1:50,000). The procedure for synergetic use of satellite image and DEM, demonstrated in this paper, can be adopted for landform mapping in any hilly terrain. However, use of high resolution data such as Resourcesat-1 LISS-IV Mx (5.8 m) and Cartosat-1 (2.5 m) stereoscopic data can provide further details of the landforms due to their high resolution imaging capability. Apart from the identification of structural landforms, the datasets used in this paper can be used selectively
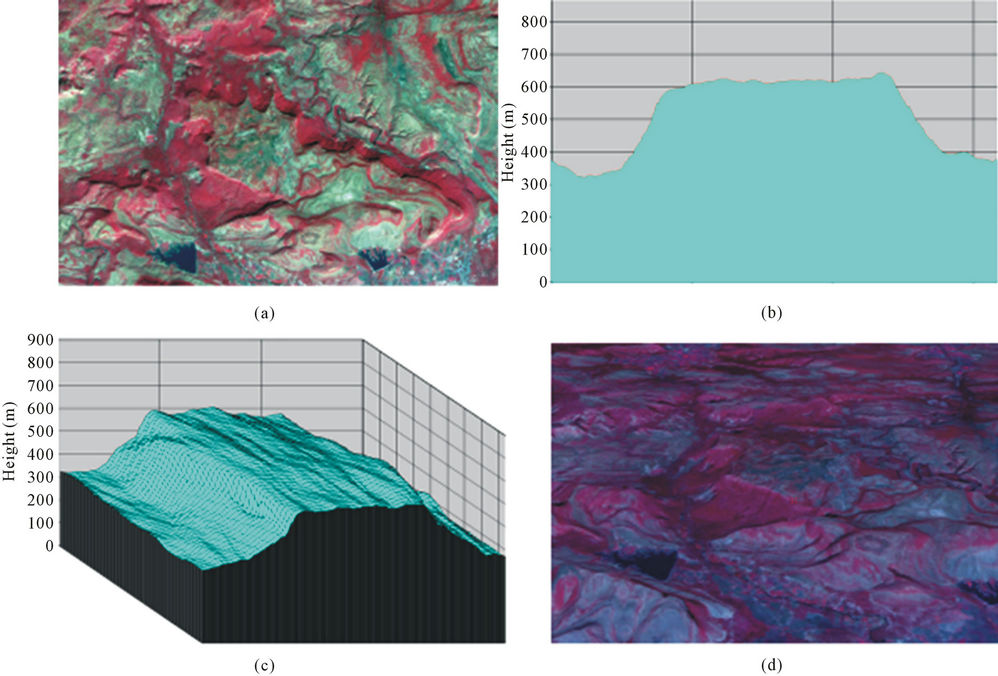
Figure 7. Plateau tops in the sandstones of Vindhyan Supergroup. (a) Satellite image of the area; (b) 2-D profile showing a flat plateau top and steep scarps on either side; (c) 3-D profile of the plateau top extracted from the DEM; and (d) 3-D perspective view of the plateau top.
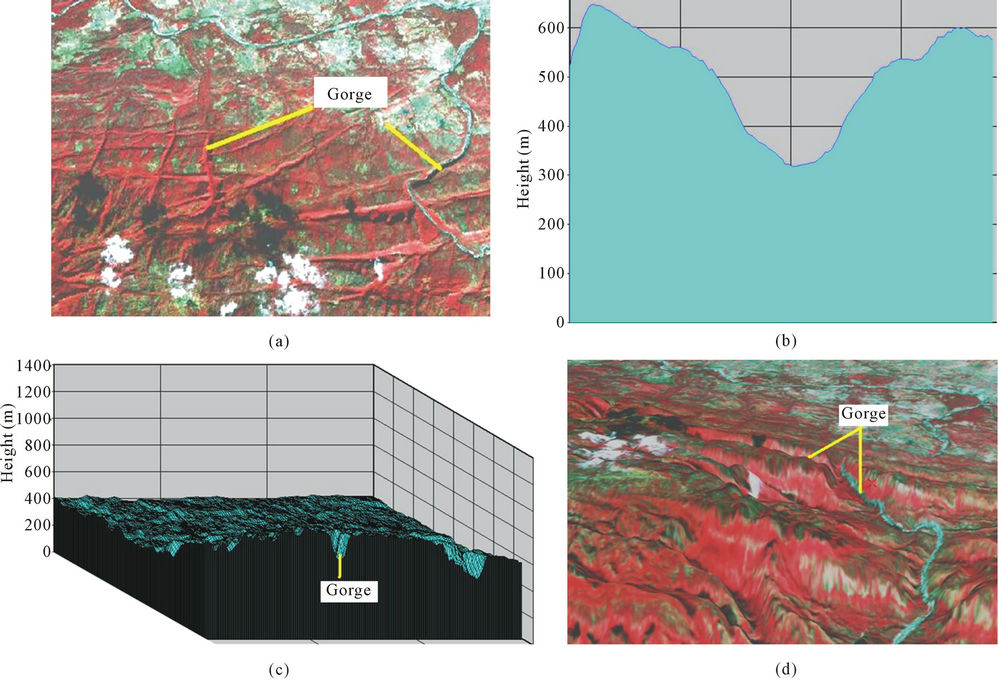
Figure 8. Gorges developed in the Denwa river catchment in the sandstones of Gondwana Supergroup. (a) Satellite image of the Gorges along Denwa river and its tributaries; (b) 2-D profile of Gorges showing steep scarps; (c) 3-D profile of Gorges extracted from the DEM; and (d) 3-D perspective view of Gorges.
landform mapping in certain areas hilly terrain and piedmont zones for enhancing the end result of geomorphic interpretation.
7. Acknowledgements
We thank Dr. V. K. Dadhwal, Director, NRSC and Dr. Y. V. N. Krishnmurthy, Dy. Director, RSA-A, NRSC, for their encouragement to carry out this study. The support and encouragement by G. Behera, former DD (RSGISAA), Dr. R. Nagaraja, Group Head, NRSC Data Centre (NDC), NRSC is duly acknowledged. The second author would like thank D. Chandrasekharan, Head, NDC, NRSC, for his support during the work.
REFERENCES
- I. A. Lcantara-Ayala, “Geomorphology, Natural Hazards, Vulnerability and Prevention of Natural Disasters in Developing Countries,” Geomorphology, Vol. 47, No. 2-4, 2002, pp. 107-124. doi:10.1016/S0169-555X(02)00083-1
- F. A. Kruse, “Mapping Surface Mineralogy Using Imaging Spectrometrey,” Geomorphology, Vol. 137, No. 1, 2012, pp. 41-56. doi:10.1016/j.geomorph.2010.09.032
- F. Scarciglia, I. Pulice, G. Robustelli and G Vecchio, “Soil Chronosequences on Quaternary Marine Terraces along the Northwestern Coast of Calabria (Southern Italy),” Quaternary International, Vol. 156-157, 2006, pp. 133-155. doi:10.1016/j.quaint.2006.05.027
- P. Simon, “Remote Sensing in Geomorphology,” Oxford Book Company, Jaipur, 2010.
- H. Kienholz and M. Bichsel, “The Use of Air Photographs for Mapping Natural Hazards in Mountainous Areas: A Study Based on the Colorado Rocky Mountains, USA,” Mountain Research and Development, Vol. 2, No. 4, 1982, pp. 349-358.
- R. W. Young and K. L. White, “Satellite Imagery Analysis of Landforms: Illustrations from Southeastern Australia,” Geocarto International, Vol. 9, No. 2, 1994, pp. 33- 44. doi:10.1080/10106049409354448
- R. G. Craig, “The Spatial Structure of Terrain: A Process Signal in Satellite Digital Images,” Proceedings IEEE Pecora 9 Symposium, Silver Springs, 2-4 October 1984, pp. 51-54.
- T. A. Astaras and N. A. Soulakellis, “Contribution of Digital Image Analysis Techniques on Landsat-5 TM Imageries for Drainage Network Delineation. A Case Study from the Olympus Mountain, W. Macedonia, Greece,” Proceedings 18th Annual Conference of the Remote Sensing Society, Dundee, 15-17 September 1992, pp. 153-172.
- M. D. Fleming, “An Integrated Approach for Automated Cover-Type Mapping of Large Inaccessible Areas in Alaska,” Photogrammetric Engineering and Remote Sensing, Vol. 54, No. 3, 1988, pp. 352-357.
- T. D. Frank, “Mapping Dominant Vegetation Communities in the Colorado Rocky Mountain Front Range with Landsat Thermatic Mapper and Digital Terrain Data,” Photogrammetric Engineering and Remote Sensing, Vol. 54, No. 12, 1988, pp. 1727-1734.
- K. O. Niemann, “Landscape Drainage Modelling to Enhance Landsat Classification Accuracies,” Geocarto International, Vol. 6, No. 1, 1991, pp. 13-30. doi:10.1080/10106049109354289
- W. Ahmad, L. B. Jupp and M. Nunez, “Land Cover Mapping in a Rugged Terrain Area Using Landsat MSS Data,” International Journal of Remote Sensing, Vol. 13, No. 4. 1992, pp. 673-683. doi:10.1080/01431169208904145
- P. T. Giles, M. A. Chapman and S. E. Franklin, “Incorporation of DEMs Derived by Stereocorrelation of Satellite Imagery in Automated Terrain Analysis,” Computers and Geosciences, Vol. 20, No. 4, 1994, pp. 441-450. doi:10.1016/0098-3004(94)90078-7
- T. R. Martha, N. Kerle, C. J. van Westen, V. Jetten and K. V. Kumar, “Effect of SUN ELEVATION ANGLE on DSMs DERIVED from Cartosat-1 DATA,” Photogrammetric Engineering and Remote Sensing, Vol. 76, No. 4, 2010, pp. 429-438.
- R. J. Pike, “The Geometric Signature: Quantifying Landslide-Terrain Types from Digital Elevation Models,” Mathematical Geology, Vol. 20, 1988, pp. 491-511. doi:10.1007/BF00890333
- G. J. McDermid and S. E. Franklin, “Spectral, Spatial, and Geomorphometric Variables for Remote Sensing of Slope Processes,” Remote Sensing of Environments, Vol. 49, No. 1, 1994, pp. 57-71. doi:10.1016/0034-4257(94)90059-0
- J. Chorowicz, J. Kim, S. Manoussis, J.-P. Rudant, P. Foin and I. Veillet, “A New Technique for Recognition of Geological and Geomorphological Patterns in Digital Terrain Models,” Remote Sensing of Environment, Vol. 29, No. 3, 1989, pp. 229-239. doi:10.1016/0034-4257(89)90002-3
- R. N. Padhi, S. G. Krishna, K. Sarkar and S. M. Dutta, “Regional Geomorphological Survey for Land Use Programming over the Narmada Basin, India,” 1994. http://www.a-a-r-s.org/acrs/proceeding/ACRS1994/Papers/PS94-5.html
- W. D. West, “The Line of Narmada and Son Valleys,” Current Science, Vol. 31, No. 4, 1962, pp. 143-144.
- District Resource Map, Geological Survey of India, 2002.