Journal of Flow Control, Measurement & Visualization
Vol. 1 No. 1 (2013) , Article ID: 30732 , 9 pages DOI:10.4236/jfcmv.2013.11005
Experimental Investigation of Operating Room Air Distribution in a Full-Scale Laboratory Chamber Using Particle Image Velocimetry and Flow Visualization
1Department of Civil, Environmental and Architectural Engineering, University of Colorado, Boulder, USA
2Department of Mechanical Engineering, University of Colorado, Boulder, USA
Email: hertzberg@colorado.edu
Copyright © 2013 James McNeill et al. This is an open access article distributed under the Creative Commons Attribution License, which permits unrestricted use, distribution, and reproduction in any medium, provided the original work is properly cited.
Received January 12, 2013; revised February 28, 2013; accepted March 16, 2013
Keywords: Operating Room; Surgical; Ventilation; Airborne Infection
ABSTRACT
Room air distribution in hospital operating rooms (OR) is critical to the effective functioning of surgical procedures, but the air distribution patterns are governed by complex physics that are currently not well understood. Both qualitative and quantitative flow visualization techniques were used to evaluate the room air distribution in a full-scale chamber designed to simulate a hospital operating room. A laser sheet illumination technique was used to identify key features of the room air distribution, and particle image velocimetry (PIV) was used to measure the velocity field in a plane crossing the surgical site. Hospital operating rooms require the use of ASHRAE Group E diffusers in an array above the surgical table, providing downward, unidirectional, non-aspirating air flow across the sterile region of the room. The supply air jet is characterized by complex physics, including annular shape, impingement, buoyancy, a large jet to room aspect ratio, and recirculation. The large diameter of the jet relative to the room size makes the overall room air distribution highly sensitive to the parameters of the supply air. The air distribution pattern in the room was found to have relatively low velocity and turbulence near the supply air diffuser, but increasing velocity and turbulence in the shear region at the edge of the supply air jet. Flow visualization and PIV methods both demonstrated an angle of the shear layer inwards towards the center of the jet. This flow feature reduces the overall coverage area for the sterile air flow and may pose a risk to the protection of the surgical patient.
1. Introduction
Hospital operating rooms (OR) have unique requirements for indoor environment design, including sterile air flow for infection control, the ability to provide large cooling loads for handling heat gains from medical equipment, and achieving thermal comfort for varying activity levels and levels of dress. The consequences of poor ventilation design in operating rooms can be very severe, leading to higher infection rates among patients and reducing the performance of the surgical staff. The proper design of hospital operating room ventilation systems is therefore critical to both the comfort of the surgical staff, and more importantly to the health of occupants and outcomes of surgical procedures. The types of occupants range from anesthetized patients to heavily dressed surgeons with lead vests for x-ray protection. It has been nearly impossible for heating, ventilation and air conditioning (HVAC) engineers to meet all of the diverse requirements that are necessary to the optimal functioning of the operating room. The most critical design parameter of the operating room has been the design of the supply air diffusers.
Early operating room ventilation designs, prior to 1950s, used sidewall diffusers and low-mounted grilles on the opposing walls to provide air for comfort conditioning. At this time, the interaction between indoor air quality and infectious disease transmission was beginning to be understood. Modern operating room ventilation systems are based on the original laminar flow cleanroom design by Whitcomb and Clapper [1]. The cleanroom was originally designed for the manufacturing of nuclear weapons in the 1960s, but the system was also believed to be appropriate for the reduction of airborne contagions. The main difference between the cleanroom design and that used for hospital operating rooms is that the diffusers are mounted only in the central region of the room. This creates a sterile air flow in the center of the room that is separate from the outer perimeter of the room. This seemed appropriate because the hospital operating room contains a combination of sterile and nonsterile objects and personnel, and the sterile air field produces an environmental delineation between these levels of sterility. Other systems have been tested over time [2-4], but the downward, unidirectional, non-aspirating system originally based on Whitcomb’s design and refined by Memarzadeh [5,6] has been proven to provide the greatest reduction in surgical site infections, and is currently the only system type allowed in ASHRAE Standard 170-2008 [7]. ASHRAE is the American Society of Heating, Refrigerating and Air-Conditioning Engineers, and is responsible for setting standards in this area.
While both dilution and air flow patterns have been deemed to be of critical importance [8], there is growing desire to reduce outdoor air change rates and total room air change rates due to energy concerns. The purpose of this research is to evaluate the air distribution patterns of typical operating room ventilation, so a discussion related to colony forming units (CFU) will not be made.
The main impact of a ceiling only partially covered with supply air diffusers is that a free shear layer is created along the edge of the supply air diffuser. The diffusers are typically installed in an array above the surgical table, using single 0.61 × 1.22 m (2 × 4 ft) diffusers. The hydraulic diameter of the diffuser array is usually far larger than in other occupied indoor environments, which creates a significant perimeter for the shear layer. Operating rooms also typically have higher ceiling heights (~3 m or 10 ft) than other occupied spaces, which produces larger length scales that influence the size of the largest eddies in the room and the distances that a free buoyant jet can accelerate before impingement.
The original clean room design used plug flow to produce a laminar (or low-turbulence) air flow to greatly reduce the diffusion of particles throughout the room. This lowered transmission of generated particles to critical manufacturing components that are unusable when contaminated. The downward air flow was chosen to decrease the settling time of micron sized particles that may otherwise stay airborne indefinitely. All of these features of the clean room are also desirable for the removal of infectious particles in the operating room. The introduction of the free shear layer provides a feature to create turbulence in the indoor environment.
The hospital operating room ventilation system has been studied by numerous researchers [9-13]. Woods et al. [14] used laboratory experiments to develop a simplified mathematical model of the contaminant transmission, using a two-zone method with the sterile and nonsterile regions of the room. Lewis [4] proposed that laminar flow air systems may cause particles to impinge on the surgical site. Memarzadeh and Manning [5] used CFD to study the influence of various ventilation system layouts on the incidence of infectious particles being deposited in the surgical site. Later Memarzadeh and Jiang [6] used computational fluid dynamics (CFD) to study the influence of room geometry and ventilation rate on the risk of particle impingement to the surgical site. Most of the current studies solely rely on CFD and many are based on the Reynolds-averaged Navier-Stokes (RANS) equations with an eddy viscosity turbulence model. While many eddy viscosity turbulence models have been validated for many types of flow, there is still a great need to validate these models in the case of operating room air distribution. The underlying physics of the air distribution in ORs are significantly different from the validation cases for the k-ε turbulence models that are typically used in indoor environments. There is still a significant need for further experimental investigation of the room air distribution in operating rooms in order to better understand the mechanisms for room air patterns and their influence on transport of infectious agents.
This research used both qualitative and quantitative measurement of air flow in a full-scale laboratory chamber that represents the indoor environment characteristic of the operating room to investigate the essential physics of the air distribution. A primary goal of this study was the improvement of the understanding of the air distribution patterns and influences on the room air motion. This knowledge may later be used to evaluate the operating room air distribution performance based on particle transport via the indoor air. The main outcome of this research is the determination of key design parameters that significantly influence the air distribution patterns, and a quantitative dataset of the mean flow and turbulence quantities. Additionally, the data presented here are valuable for validating CFD models in order to further investigate the design of operating room air distribution systems in the computational domain.
2. Methodology
A full-scale operating room chamber was constructed for conducting experiments to measure the fluid and thermal conditions inside a typical operating room. The chamber consisted of a 6.1 × 5.8 m (20 × 19 ft) room with 2.9 m (9.5 ft) floor to ceiling height and typical furnishings and heat sources. The walls and ceiling of the test chamber were constructed with R-50 insulation, with R-30 insulation covering the floor. The measurements were conducted with a typical temperature of 18˚C (65˚F) at the surface of the laboratory chamber, so the heat loss through the envelope was approximately 12 W (42 Btu/ hr). The maximum conductive heat transfer through the envelope was less than 1% of the sensible room cooling load for the laboratory chamber and was therefore neglected in the analysis. Thermal manikins were used with variable voltage internal heat sources. The ventilation air was provided by a full-scale commercial air-handling unit to a set of variable air volume terminal reheat units. Each terminal unit had a modulating damper and duct mounted air flow meter to provide balanced air flow to each bank of diffusers. Room air flow was provided by a set of commercial Group E diffusers mounted in the ceiling in the center of the room. The air temperature at the room center was controlled at 20˚C (68˚F) with 5% fluctuation. The room air temperature can reach stability within 1 - 2 hours. Due to the large volume of supply air (i.e., 31.6 ACH—air change rate per hour), the movement of personnel and existence of lighting fixtures only had localized and short-period (<30 seconds) disturbance to the entire room air environment. The room characteristics for the laboratory chamber were chosen per Table 1.
The laboratory chamber (Figure 1) was set-up with typical furnishings for operating rooms that act as blockages to indoor air flow as shown in Table 2. The thermal characteristics of the room (shown in Table 3) were selected based on a combination of design specifications and field testing results. The characteristics are designed to provide a baseline for a typical operating room, and do not represent an extreme case (i.e. massive trauma surgery, hybrid OR). This research does not intend to experimentally test the influence of heat gains due to periods of high occupant density or the use of diagnostic imaging equipment in the OR. As not all conditions can be accounted for in this research, the experiment specifications are limited to the necessities that are common to all class B and C surgeries.
The effect of heat gains was implemented in the laboratory chamber through a number of heat sources that were designed to represent typical sources found in a general surgical environment. The main heat gains inside of the sterile region of the operating room come from the surgical staff and surgical lighting. Outside of the sterile region, the load is dominated by medical equipment (e.g. anesthesia machine, c-arm x-ray).For a more detailed analysis of the heat gains in a general operating room see analysis of the heat gains in a general operating room see recent work by the authors [15]. The laboratory experi
Table 1. Laboratory chamber characteristics.
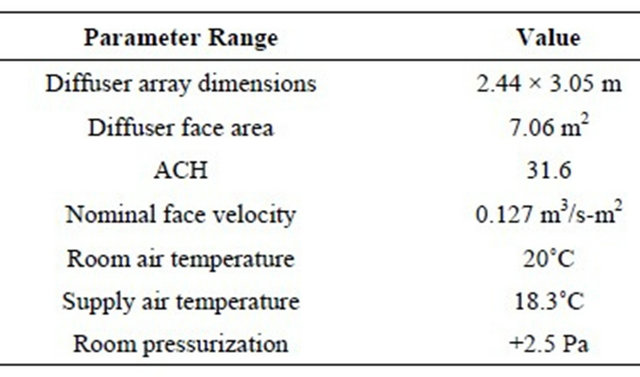
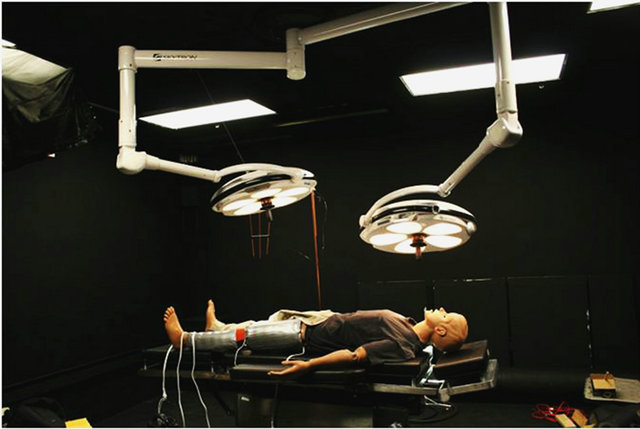
Figure 1. Full-scale laboratory chamber used for evaluation of air distribution via flow visualization and PIV.
Table 2. Room object dimensions.
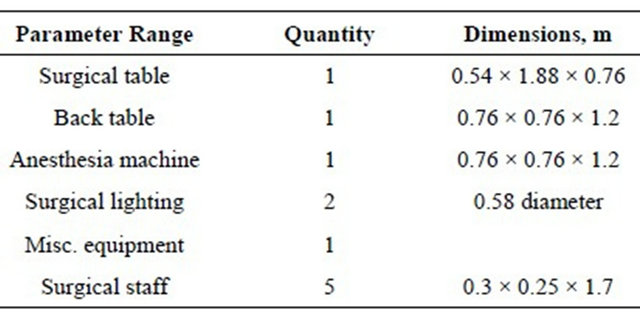
Table 3. Room heat gains.
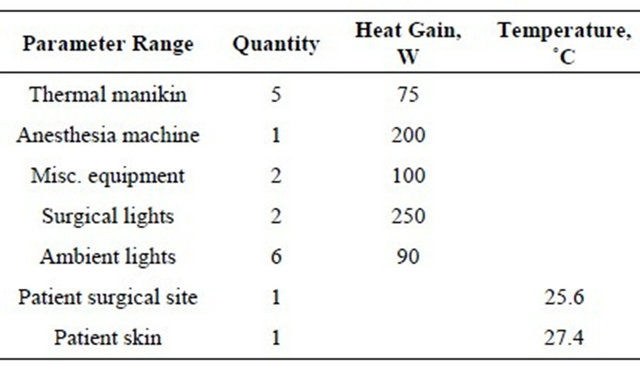
ment was designed to provide a fundamental understanding of the air distribution in the surgical environment, so exact heat sources were not the focus of this study. The total heat gain (1817 W) was designed to be in the range of the typical operating room and the primary heat sources were located in the approximate locations in the indoor environment. The supply air temperature difference to meet the steady-state cooling load was 1.8˚C (3.2˚F).This represents a moderate cooling load for an operating room. There are a number of instances (e.g. trauma, imaging equipment) in which the cooling load and temperature difference would be significantly higher than this case. The heat gains and quantities in Table 3 were present for all flow visualization and PIV experiments presented in this paper.
The heat gains from the surgical staff were implemented in the laboratory experiment using manikins with variable internal heat sources that were controlled using a variable voltage source to achieve a desired heat output. A total of five thermal manikins were used to represent typical surgical staff members (i.e. surgeons, nurses, and anesthesiologist). The density of heating elements was arranged to provide an approximate desired surface temperature for the manikins. The manikin surface heat temperature distribution was calibrated using thermal model data compared to real-life subjects for accuracy.
The patient manikin was constructed using a medical manikin with a wound simulator located on the left leg to represent a typical surgical procedure seen in orthopedic surgery. The wound simulator was constructed from three individually controlled heating elements that were modulated using a proportional integral feedback controller with pulse width modulation to maintain a constant surface temperature on the heating elements. This allowed the specification of a constant surface temperature for both the surgical wound and the surrounding skin. The wound simulator provided an approximate representation of the thermal conditions observed in actual surgical cases, where the exposed portion of the body has a normal skin temperature and a surgical wound temperature. The remainder of the body is typically covered with sterile draping and was assumed to be adiabatic with the room environment.
2.1. Flow Visualization
Flow visualization is a popular method for obtaining qualitative and quantitative data describing an indoor air flow. Most indoor air flows are defined by relatively large scales and three-dimensional flows that can be difficult to describe with point measurements. This makes planar flow visualization techniques an appropriate method for evaluating the characteristics of the flow field. Researchers have been utilizing new techniques originally developed for studying fundamental fluid mechanics to better provide better understanding of the characteristics of indoor air flows [16]. Two types of flow visualization techniques were used to evaluate and measure the flow field over the patient area. The boundary marking laser sheet illumination technique was used extensively to determine key flow features in the operating room by capturing digital photographs of seeded particles. This method proved to be appropriate for indoor air flows in operating rooms as it produced planar, time-resolved images that could be easily compared with PIV and CFD results. Particle image velocimetry was also used to obtain quantitative values in the planar region across the surgical site and within the sterile region of the room.
The boundary marking technique was used to visualize several flow features in the room. This paper will focus on the wake around the surgical light and the free shear layer at the interface between the non-sterile air and the sterile jet. The most successful implementation of the boundary marking technique was achieved by completely filling the laboratory chamber with stage fog and introducing unseeded air from the ventilation system. This provided a clear distinction in the flow visualization images of the interface between the sterile and non-sterile air flows. It additionally provided information regarding turbulent mixing that occurs in this region as a function of the luminous intensity in the interface region. This technique was particularly successful due to the ease of setup and small amount of time required to collect data when compared with the particle image velocimetry technique.
2.2. Particle Image Velocimetry
Two-component particle image velocimetry (PIV) was used to measure the air flow in the sterile region of the full-scale laboratory chamber. PIV measurements provide velocity vector measurements at sampling rates greater than 1 Hz with high spatial resolution. PIV has been widely used for studying indoor air flows and has become increasingly popular over the past decade [17- 20]. This technique is excellent for studying indoor air distribution, because data at numerous locations are captured in a single measurement.
The seeding material used was a water-glycol based theatrical stage fog chosen for its ability to accurately act as a tracer for the air flow. The fog droplets have diameters on the order of 1 µm [21]. It was injected at the air handling unit in order to achieve neutral buoyancy and well-mixed conditions at the diffuser outlet. The PIV measurements were captured in a two-dimensional plane across the surgical site of the patient using a camera mounted normal to the laser sheet, as shown in Figure 2. A New Wave Solo 120 mJ Nd:YAG laser at a wavelength of 532 nm was used for the light sheet. Images were recorded by a TSI PIVCam 138 Model 630047 camera with 1K × 1K resolution. TSI Insight 3G PIV software was used to capture and process the series of digital image pairs using a dual frame capture method.
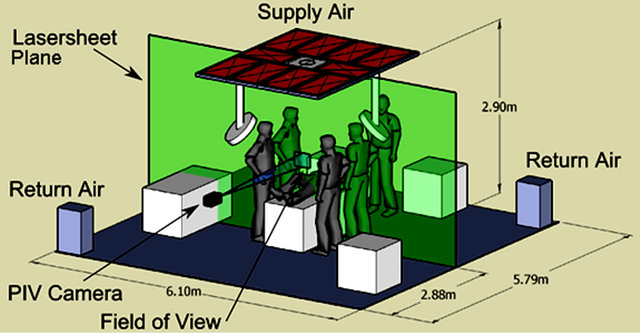
Figure 2. Schematic of flow visualization and PIV experiment layout.
The images were separated by 4000 μs between frames. A standard Nyquist grid was used with a central difference offset scheme and a correlation window spot size of 128 × 128 pixels. This window size helped to reduce the computing time necessary for calculating the large number of datasets, while still providing an accurate representation of the flow field. The image pair correlation was calculated using a fast Fourier transform (FFT) algorithm, and sub-pixel accuracy was provided with a Gaussian fit. The laser sheet was approximately 5 - 6 mm thick in the field of view region in order to reduce the quantity of through-plane particles that contribute to particle dropout.
The overall flow field was compiled from individual PIV measurement images across the sterile field. The field of view for a single PIV image was 0.320 m wide by 0.256 m high requiring a measurement grid of 5 images wide by 8 high to cover half of the sterile region of the room, as shown in Figure 3. The air distribution was tested for symmetry in order to reduce the number of measurements required to evaluate the flow field. This consisted of a comparison of flow normalized luminous intensity values from flow visualization images taken at the shear layer boundary. Three sets of data were compared (right and left sides of edge of diffuser array) at four vertical locations across the image (200, 250, 250, and 450 mm below the diffuser face), as shown in Figure 4. Luminous intensity values across the shear layer were deemed adequate to make the assumption of symmetry for the supply air jet.
A minimum of 1000 PIV images were collected at each measurement location with a pulse repetition rate of 3.63 Hz in order to calculate the mean flow characteristics and turbulence statistics for each individual location. The overall flow field was then produced by mapping the data at the individual locations to the room geometrical locations. A standard procedure was used to capture the data. Measurements were collected at each measurement location on multiple days to assist in removing any bias error.
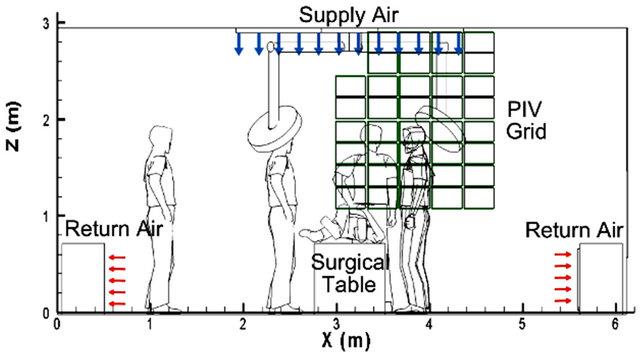
Figure 3. Schematic showing location of image captures for evaluating the flow field over the sterile region of the operating room.
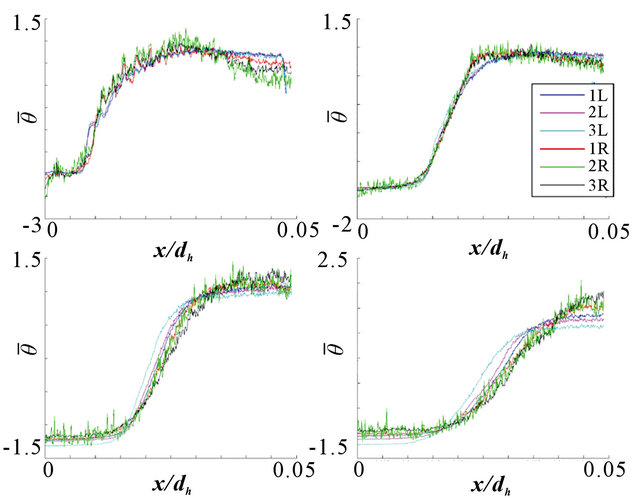
Figure 4. Comparison of flow visualization luminous intensity from left (L) and right (R) sides of the supply air jet at four vertical locations.
3. Results
3.1. Flow Visualization
Initial flow visualization images showed that the area of the flow field at the perimeter of the diffuser array is critical to the performance of the sterile air field. This region contains a free shear layer formed by the boundary of the supply air jet with the still air in the surrounding region. This free shear layer forms a boundary between the sterile and non-sterile air regions of the room, as well as being an area for the production of turbulence in the supply air. Laser sheet illumination using the boundary marking technique was then used to capture details of the free shear layer by seeding the room air with stage fog and introducing non-seeded supply air into the room. This technique allowed the shear layer to be visualized and provides details of the eddies, as shown in Figure 5; the supply air jet is on the left, and the seeded room air is on the right. The image shows that a significant amount of mixing is occurring in the shear layer and that the direction of the shear layer angles inwards towards the surgical table.
In addition to the turbulence production and entrainment properties of the free shear layer, the central void caused by the lack of diffuser in the surgical light boom location creates a square, annular jet. Annular jets have a number of unique characteristics that differentiate these types of jets from standard round or rectangular jets. Boehler [22] studied annular air jets in the context of ground pressure effects in detail and discovered that these jets converge due to a pressure cavity that exists in the annular region. The annular supply air jet found in the typical operating room is described as both impinging and confined, which contribute to further complexities in the physics of the flow. The authors are not aware of any thorough study of these types of jets related to indoor
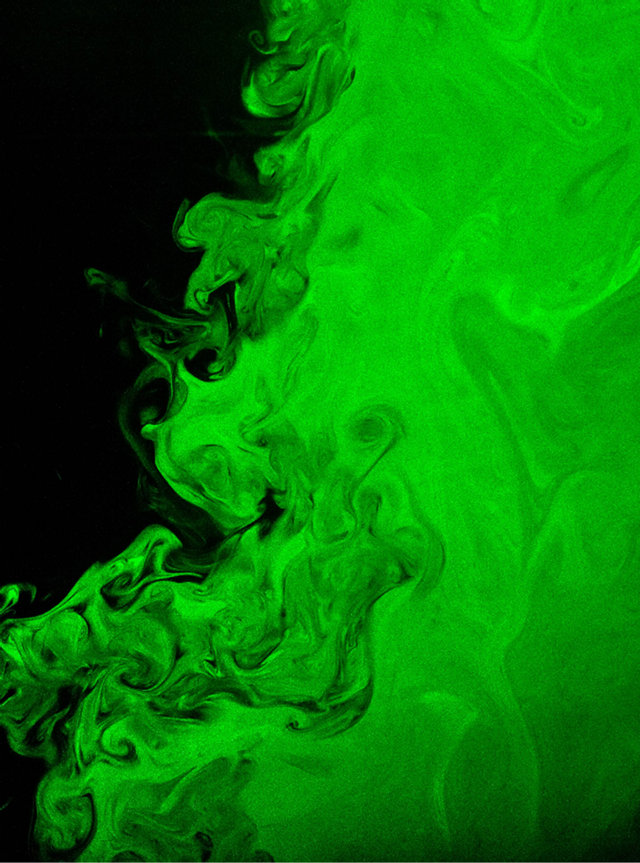
Figure 5. Image of boundary marking technique applied at the interface between the non-sterile region (left) and the sterile region (right) of the room used to demonstrate the angle of contraction of the free shear layer at the perimeter of the supply air jet. The image width spans approximately 0.5 m.
environments and they behave far differently than the typical circular or rectangular jet that is commonly used in indoor air distribution.
Other objects in the OR influence the local air flow in the vicinity of the sterile occupants (e.g. scrub nurse, surgeons, patient). The influences of the surgical lights and light support booms have been of great interest to engineers. The heat gains for surgical lights have been reduced dramatically in recent years with the advancement of LED lighting technology, but there are still a large number of surgical lights that use halogen lamps in use. These surgical lights produce large heat gains (~200 - 500 W), which result in surface temperature of approximately 40˚C (105˚F). Observations made of the air flow around a halogen type surgical light in the present study showed that there is a stagnation zone near the lens of the light head due to the heat gains from the lamps. Figure 6 shows the wake around a surgical light that is placed partially in the sterile air jet using the boundary marking technique. The non-sterile air is seeded and unseeded air is introduced into the sterile region. The surgical lights are typically located behind the head of the
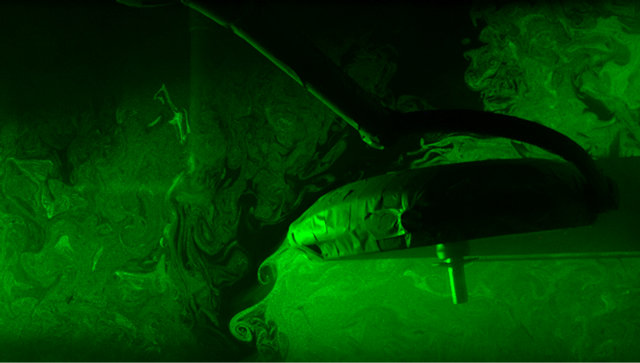
Figure 6. Image of boundary marking technique showing the wake over a surgical light placed partially underneath the supply air flow. The jet centerline is to the left of the image. The image spans 1.2 m.
surgeon at the perimeter of the sterile air field. Figure 6 illustrates how the light wake may create a major disruption in the shear layer position as the recirculation zone below the light entrains room air. In any case, the turbulent mixing that will occur due to the wake reinforces the concept that these lights should not be located above the patient or near any sterile objects.
3.2. Particle Image Velocimetry
Determination of the indoor air flow field is critical for understanding of the flow characteristics of the room air distribution and for the development and validation of computational fluid dynamics models. PIV images were acquired at 38 locations underneath the sterile flow field, between the surgical table and the diffuser. Statistical measurements were calculated from over 1000 realizations at each location. The total PIV dataset contained over 13 million individual data points. Figure 7 shows a histogram of all of the measured velocities in the dataset. The majority of the measured velocities are below about 0.2 m/s (39 fpm), but a significant number of the values are above the desired value of 0.127 m/s (25 fpm). The histogram shown in Figure 8 demonstrates that when the velocity is averaged at each measurement location the maximum average velocity is less than 0.3 m/s (59 fpm). The velocity values above 0.3 m/s are due to turbulent fluctuations. This means velocity histogram also shows a flat distribution except at the low velocities. This is due to velocities in the jet region being in the range of 0.2 - 0.3 m/s, whereas the velocities in the recirculating region were less than 0.2 m/s.
The flow field in the operating room demonstrates a dramatic velocity component inward towards jet centerline and thus the surgical table. Figure 9 shows the air pattern directs from the perimeter of the diffuser array inward towards the patient location and then curves outwards from the center of the room upon impingement with the surgical table. This air distribution pattern
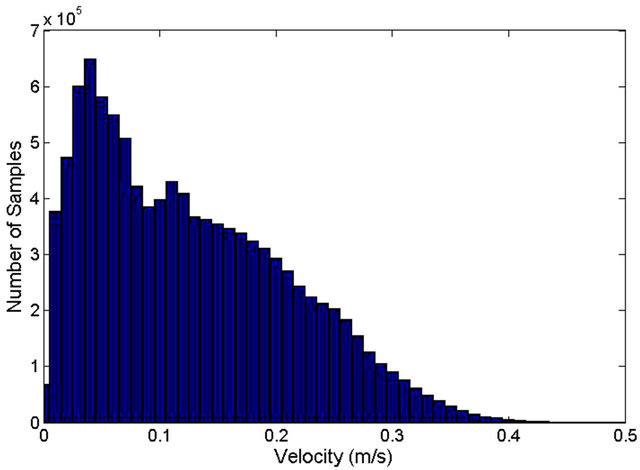
Figure 7. Histogram of all measured velocity magnitudes collected from PIV data.
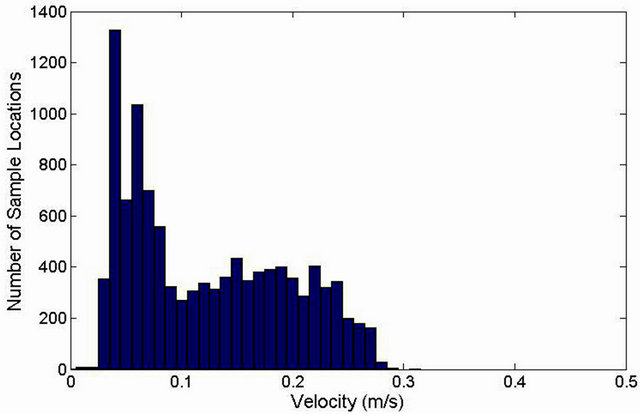
Figure 8. Histogram of velocity magnitude averaged at each measurement location.
allows non-sterile air to flow over the surgeons. These staff members are scrubbed-in and are required to remain sterile during the surgical procedure. This air distribution pattern produces concerns that the ventilation may not be adequately protecting the surgeons from airborne pathogens in the non-sterile region. Typical isothermal jet flow contains an inertial core near the outlet of the jet followed by a decay region, but the velocity contours shown in Figure 10 describe a jet with a low velocity near the outlet of the diffuser and with a high velocity region in the free shear region of the jet. A second high velocity region is seen in the area to the side of the patient. This region may be due to interaction with the surgical table. The non-sterile region of the room is characterized by recirculating flow with very low velocities (<0.05 m/s (10 fpm)). A secondary small recirculation region is located just below the surgical light boom and is created by low pressure in the inner recirculating region.
Figure 11 shows the RMS velocity fluctuations in the flow field. The magnitude of the fluctuations follows the contour maps for the velocity magnitude in the jet region. Significant fluctuations (>0.2 m/s) are found in the
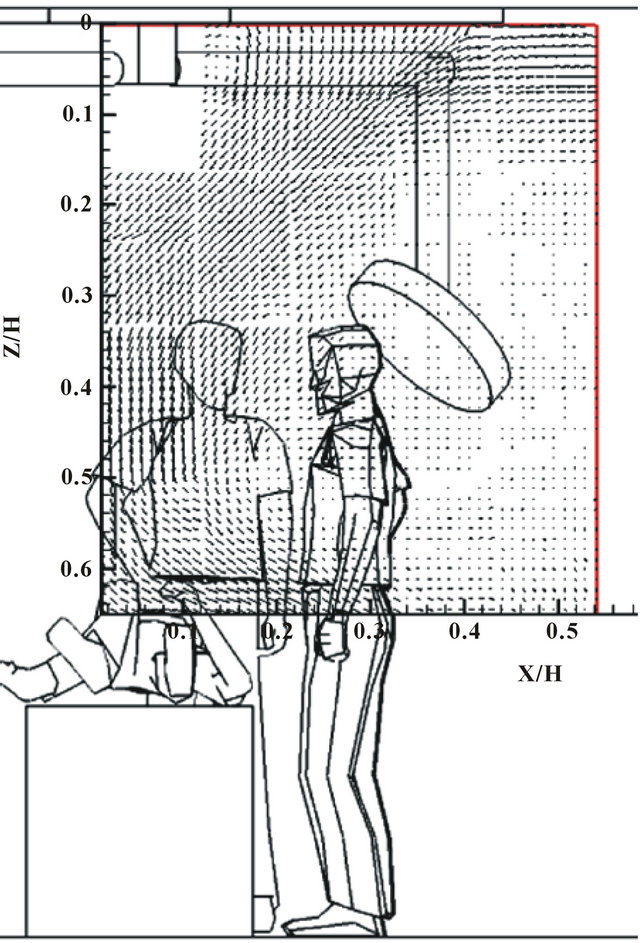
Figure 9. Velocity vectors in the plane intersecting the center of the room in the sterile region above the patient.
shear region of the flow.
Turbulence intensity contours, shown in Figure 12, provide further demonstration of the turbulence production in the shear layer. Turbulence intensity in these figures is defined as the root mean square velocity fluctuation, divided by the local mean velocity.
The turbulence intensity is below 10% in the area near the diffuser, but quickly increases as the annular jet forms and begins to contract. The turbulence intensity is quite high in the non-sterile region (40% - 60%), but this is a factor of the velocity being quite low. The fluctuations in this region are therefore of negligible velocity.
4. Conclusions
This research showed that the air flow pattern in a hospital operating room with an annular air distribution pattern is characterized by complex physics that cause the jet to contract inwards towards the centerline. This location is coincident with the typical location of the patient, likely exposing the patient to non-sterile air. The physics of the indoor air distribution include impingement, recirculation, annular flow, free shear layer flow, and buoyancy. While laminar flow may be achievable with a distribution system that fully covers the ceiling and plug flow,
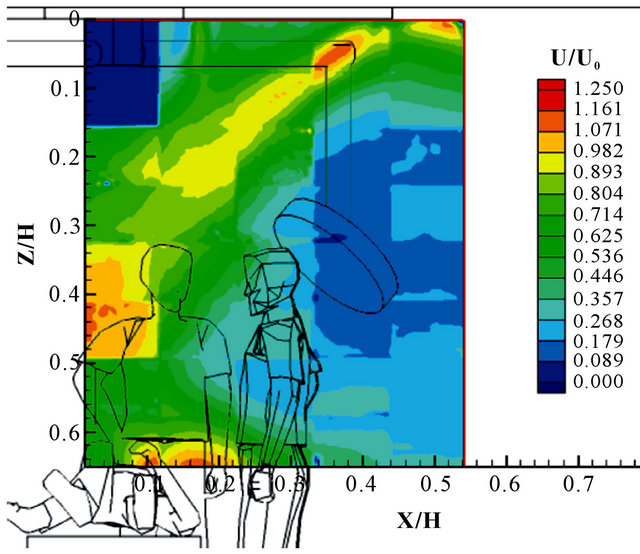
Figure 10. Normalized velocity magnitude contours in the plane intersecting the center of the room in the sterile region above the patient.
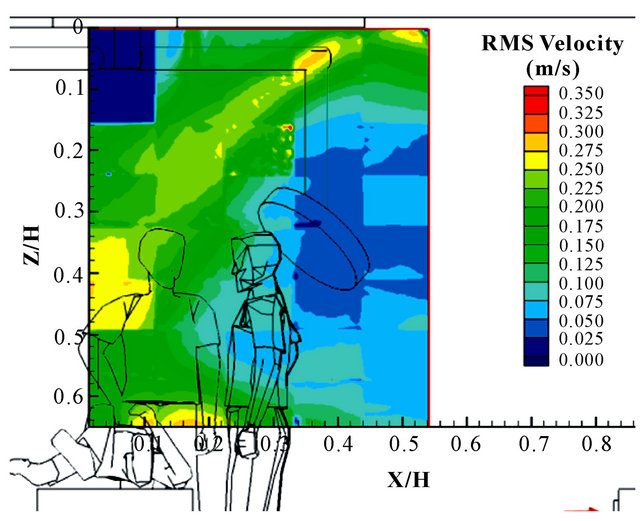
Figure 11. RMS velocity contours in the plane intersecting the center of the room in the sterile region above the patient.
the smaller ceiling coverage area and lower air speeds used in the modern operating room produce a flow in the turbulent regime. The air flow may be characterized by generally low air velocities with significant curvature and higher velocities at the edge of the sterile region. The contraction of the jet is likely a direct consequence of an annular design. If the inlet diffuser array is made continuous by moving the light attachment locations to the outer edge, the jet contraction may be mitigated, although additional study will be needed to verify this.
The primary source of turbulence production in the operating room is the free shear layer at the edge of the diffuser array. The turbulence characteristics of the supply air jet from the diffusers is important to the turbulence in the jet flow, but the undesirable mixing of sterile and non-sterile air occurs at the interface between these
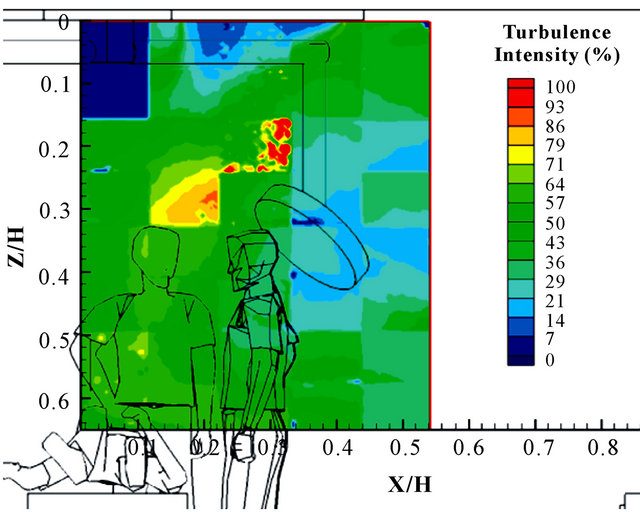
Figure 12. Turbulence intensity contours in the plane intersecting the center of the room in the sterile region above the patient.
regions of the room. The turbulence intensity is therefore much greater downstream of the diffuser as turbulence is produced in the free shear layer.
The downward direction of the supply air jet and the supply-to-room air temperature difference required for meeting the space cooling load produces a mixed convection condition, and buoyancy may play an important role. Since the velocity is typically constrained by the required air change rate and face air velocity, the parameter that has the greatest operational flexibility is the supply air temperature difference. The trend in operating rooms is towards higher cooling loads to meet the additional heat gains of modern medical equipment. The supply air to room air temperature was fixed in this research, but further study is required to better understand the impact of this parameter on the overall air distribution pattern.
The inlet flow conditions of the supply air appear to be less important to the overall room air distribution than the layout of the air distribution system. While low velocity and low turbulence inlet conditions may exist, the supply air jet may increase in velocity and turbulence upon reaching the surgical table. Additional research is required to better understand the contributing factors to the increase in velocity in the shear layer region.
This research was conducted on a simple steady-state representation of a basic surgical environment. In reality, the operating room contains numerous transient phenomena that may cause significant changes to the time resolved indoor air distribution pattern (e.g. opening of door). Other transient phenomena (e.g. wakes, start of surgery, movement of surgeons, and cauterization of surgical wounds) may also have significant influences on the indoor air distribution patterns, and require further study in order to understand the implication on indoor air quality.
5. Acknowledgements
This work was sponsored under ASHRAE 1397RP, “Experimental Investigation of Hospital Operating Room Air Distribution”. The authors would like to thank the members of TC 9.6—Healthcare Facilities for their support of this research project.
REFERENCES
- J. G. Whitcomb and W. E. Clapper, “Ultraclean Operating Room,” The American Journal of Surgery, Vol. 112, No. 5, 1966, pp. 681-685. doi:10.1016/0002-9610(66)90104-8
- R. Blowers and B. Crew, “Ventilation of OperatingTheatres,” Epidemiology & Infection, Vol. 58, No. 4, 1960, pp. 427-448. doi:10.1017/S0022172400038572
- B. Friberg, S. Friberg, L. G. Burman, R. Lundholm and R. Östensson, “Inefficiency of Upward Displacement Operating Theatre Ventilation,” Journal of Hospital Infection, Vol. 33, No. 4, 1996, pp. 263-272. doi:10.1016/S0195-6701(96)90012-2
- J. R. Lewis, “Operating Room Air Distribution Effectiveness,” ASHRAE Transactions, Vol. 99, No. 2, 1993, pp. 1191-1200.
- F. Memarzadeh and A. P. Manning, “Comparison of Operating Room Ventilation Systems in the Protection of The Surgical Site/Discussion,” ASHRAE Transactions, Vol. 108, No. 2, 2002, p. 3.
- F. Memarzadeh and J. Jiang, “Effect of Operation Room Geometry and Ventilation System Parameter Variations on the Protection of the Surgical Site,” Proceeding of IAQ 2004, Tampa, 15-17 March 2004.
- ASHRAE TC 9.6, “ANSI/ASHRAE Standard 170-2008. Ventilation of Healthcare Facilities,” American Society of Heating, Refrigerating, and Air-Conditioning Engineers, Inc., Atlanta, 2008.
- Y. Li, G. M. Leung, J. W. Tang, X. Yang, C. Y. H. Chao, J. Z. Lin, J. W. Lu, P. V. Nielsen, J. Niu, et al., “Role of Ventilation in Airborne Transmission of Infectious Agents in the Built Environment—A Multidisciplinary Systematic Review,” Indoor Air, Vol. 17, No. 1, 2007, pp. 2- 18. doi:10.1111/j.1600-0668.2006.00445.x
- T.-T. Chow and X.-Y. Yang, “Performance of Ventilation System in a Non-Standard Operating Room,” Building and Environment, Vol. 38, No. 12, 2003, pp. 1401-1411. doi:10.1016/S0360-1323(03)00155-0
- M. Woloszyn, J. Virgone, and S. Mélen, “Diagonal AirDistribution System for Operating Rooms: Experiment and Modeling,” Building and Environment, Vol. 39, No. 10, 2004, pp. 1171-1178. doi:10.1016/j.buildenv.2004.03.013
- T. T. Chow and X. Y. Yang, “Ventilation Performance in the Operating Theatre against Airborne Infection: Numerical Study on an Ultra-Clean System,” Journal of Hospital Infection, Vol. 59, No. 2, 2005, pp. 138-147. doi:10.1016/j.jhin.2004.09.006
- T. T. Chow, Z. Lin and W. Bai, “The Integrated Effect of Medical Lamp Position and Diffuser Discharge Velocity on Ultra-clean Ventilation Performance in an Operating Theatre,” Indoor and Built Environment Vol. 15, No. 4, 2006, pp. 315-331. doi:10.1177/1420326X06067802
- H. Brohus, K. D. Balling and D. Jeppesen, “Influence of Movements on Contaminant Transport in an Operating Room,” Indoor Air, Vol. 16, No. 5, 2006, pp. 356-372. doi:10.1111/j.1600-0668.2006.00454.x
- J. E. Woods, D.T. Brayman, R. W. Rasmussen, G. L. Reynolds and G. M. Montag, “Ventilation Requirements in Hospital Operating Rooms—Part I: Control of Airborne Particles,” ASHRAE Transactions, Vol. 92, 1986, pp. 396-426.
- J. S. McNeill, Z. (John) Zhai and J. Hertzberg, “Field Measurements of Thermal Conditions during Surgical Procedures for the Development of CFD Boundary Conditions,” ASHRAE Transactions, Vol. 118, No. 2, 2012, pp. 596-609.
- M. Sandberg, “Whole-Field Measuring Methods in Ventilated Rooms,” HVAC&R Research, Vol. 13, No. 6, 2007, pp. 951-970. doi:10.1080/10789669.2007.10391464
- G. Cao, M. Sivukari, J. Kurnitski, M. Ruponen and O. Seppänen, “Particle Image Velocimetry (PIV) Application in the Measurement of Indoor Air Distribution by an Active Chilled Beam,” Building and Environment, Vol. 45, No. 9, 2010, pp. 1932-1940. doi:10.1016/j.buildenv.2009.11.020
- D. Marr, T. Khan, Mark Glauser, Hiroshi Higuchi and J. Zhang, “On Particle Image Velocimetry (PIV) Measurements in the Breathing Zone of a Thermal Breathing Manikin,” ASHRAE Transactions, Vol. 111, No. 2, 2005, pp. 299-305.
- L. Zhao, Y. Zhang, X. Wang, G. L. Riskowski and L. L. Christianson, “Development of PIV Techniques to Measure Airflow Patterns in Ventilated Airspaces,” ASHRAE Transactions, Vol. 105, No. 2, 1999, pp. 1098-1107.
- S. Zhu, S. Kato and J.-H. Yang, “Study on Transport Characteristics of Saliva Droplets Produced by Coughing in a Calm Indoor Environment,” Building and Environment Vol. 41, No. 12, 2006, pp. 1691-1702. doi:10.1016/j.buildenv.2005.06.024
- S. Varughese, K. Teschke, M. Brauer, Y. Chow, C. van Netten and S. M. Kennedy, “Effects of Theatrical Smokes and Fogs on Respiratory Health in the Entertainment Industry,” American Journal of Industrial Medicine, Vol. 47, No. 5, 2005, pp. 411-418. doi:10.1002/ajim.20151
- G. D. Boehler, “Aerodynamic Theory of the Annular Jet,” Aerophysics Co., Washington, DC, 1959.