Food and Nutrition Sciences
Vol.07 No.04(2016), Article ID:65813,10 pages
10.4236/fns.2016.74027
Nutritional Composition of Orange Juice: A Comparative Study between French Commercial and Home-Made Juices
Aurelie Chanson-Rolle1, Veronique Braesco1*, Julien Chupin2, Laurence Bouillot3
1VAB-nutrition, 1 rue Claude Danziger, Clermont-Ferrand, France
2Eurofins Analytics France, Rue Pierre Adolphe Bobierre, Nantes Cedex 3, France
3Qualijus, Institut Professionnel pour la Qualité des Jus de Fruits, 23 boulevard des Capucines, Paris, France

Copyright © 2016 by authors and Scientific Research Publishing Inc.
This work is licensed under the Creative Commons Attribution International License (CC BY).
http://creativecommons.org/licenses/by/4.0/


Received 6 December 2015; accepted 22 April 2016; published 25 April 2016
ABSTRACT
The study aimed to compare the nutritional composition of commercial and home-made orange juices with a fruit content of 100%, i.e., without dilution with water and without addition of sugars or any other sweeteners. Orange juice samples (n = 12 for both types of juice) were representative of the French market and of French consumers’ habits as determined by a consumer survey. The results showed that both types of juices contained the same concentrations in total sugars and polyphenols and had low levels of dietary fiber (P > 0.05 for all parameters). Commercial orange juice contained less vitamin C (P = 0.035) and folate (P = 0.002) than home-made juice (15% and 27% less, respectively), probably owing to the vitamin degradation that may occur during industrial production (e.g., during pasteurization) and storage of commercial orange juice. The observed differences were of relatively small magnitude overall, however, and within the expected ranges for vitamin loss due to pasteurization and storage at ambient temperature. Indeed, commercial orange juice contained 85% of the vitamin C concentration measured in home-made juice, showing that vitamin C was well preserved in commercial juice. Another study with a larger number of samples would be needed to confirm these observations.
Keywords:
Orange Juice, Process, Vitamin C, Sugars

1. Introduction
Fruit juices are very lightly processed foods that are governed by a specific regulation within the European Union: Council Directive 2001/112/EC, which has been transposed into French law by Decree 2003-838 and amended by Directive 2012/12/EU. This regulation defines three main types of products, depending on the fruit content and process: “fruit juice”, “fruit juice from concentrate” and “fruit nectar”. Fruit juice is obtained by mechanical extraction (squeezing) of fruits harvested at maturity, followed by pasteurization. Fruit juice from concentrate is obtained in the same way except that the juice is concentrated through evaporation of natural water content. The juice is then restored by adding the same amount of water as was extracted from that juice during the concentration process. The concentration step is used to facilitate storage and transportation, and improve the environmental impact of the product. Fruit nectar is made by adding water to fruit juice or fruit purée, with or without sugar or artificial sweeteners. The minimal fruit content in fruit nectar should be 25% - 50%, depending on the type of fruit.
Orange juice (OJ) is the most consumed fruit juice in Europe and around the world [1] [2] . It is obtained from the endocarp of the Citrus sinensis fruit. Several varieties of oranges are cultivated to make OJ, among which the main ones are Hamlin, Pineapple, Valencia and Pera. Most of the OJ consumed in Europe is imported, primarily from Brazil (79%), but also from Florida (7%), Spain (7%), Italy and Greece (5%) and Mexico and Israel (2%) [1] [3] . In France in 2013, OJ and nectars represented 47% of the market share (in volume, moving annual total) for fruit juices (all types of products/fruits), among which the majority (90%) corresponded to OJ made from concentrate or not from concentrate (with a fruit content of 100%), while only 10% corresponded to orange nectar (with a fruit content lower than 100%) (Nielsen, French fruit juice market as of December 29th 2013 personal communication).
OJ contains substantial amounts of several micronutrients such as vitamin C, folate and polyphenols (e.g., hesperidin which is a flavanone) [2] [4] , and may therefore contribute significantly to their daily intakes. Data obtained from a representative sample of the French population showed that fruit juices contributed to 31% of the daily vitamin C intake of children and to 16% of the daily vitamin C intake of adults [5] . When applying the market share figures described above, OJ would contribute to 15% of the daily intake of vitamin C for children and adolescents, and 8% for adults. The same data indicated that fruit juices and OJ contributed to 10% and 5% of the daily intake of simple carbohydrates in children, and 5% and 2% in adults, respectively.
Some steps of the process used for the industrial production of OJ are known to impact its nutritional composition, especially for vitamin C [2] [6] . Consistently, commercial OJ may have a different nutritional composition to home-made OJ; however, no good-quality analytical study has been performed to compare the nutritional composition between the two types of OJ. The aim of the present study was to determine whether the nutritional composition of commercial OJ differs significantly from that of home-made OJ. For that purpose, the nutritional compositions (total sugar, individual sugars [fructose, glucose, sucrose], vitamin C, folate, dietary fiber and total polyphenols) of a sample of commercial OJ representative of the French market and a sample of home-made OJ prepared according to the usual practices of French consumers were compared. The originality of the work lies in the analysis of the actual mode of consumption and preparation of home-made OJ and information related to the OJ French market.
2. Materials and Methods
2.1. Chemical Reagents
L-ascorbic acid (Sigma A5960), gallic acid monohydrate (Sigma 27645) and Folin-Ciocalteu reagent (Sigma F9252) were purchased from Sigma Chemical Co. (St. Louis, MO, USA). Total dietary fiber assay kit (K-TDFR), protease (Subtilisin A from Bacillus licheniformis) (E-BSPRT), α-amylase (from Bacillus licheniformis) (E-BLAAM) and amyloglucosidase (from Aspergillus niger) (E-AMGDF) were purchased from Megazyme International Ireland (Bray, Co. Wicklow, Ireland). The Sucrose/D-Glucose/D-Fructose kit [Roche (previously Boehringer Mannheim) 10 716 260 035] was purchased from R-Biopharm France (Saint Didier au Mont d’Or, France). Lactobacillus casei ATCC 7469 (L. rhamnosus) was purchased from Culture Collection, University of Göteborg (product no. CCUG 21452) and free folic acid-casei medium (Difco 282210) was purchased from Becton Dickinson (BD) (Franklin Lakes, NJ, USA). All chemical reagents used in the experiments were of analytical grade.
2.2. Consumer Survey
A consumer survey was performed between March 5 and March 10, 2014 (CSA institute), in a sample of 1006 adults (481 men, 525 women) representative of the French adult population. Participants completed an online questionnaire with the aim to describe their usual consumption of fruit juices and their perception about fruit juices. The questionnaire included ten questions related to preparation and consumption of home-made fruit juices.
2.3. Constitution of the Two Samples of Orange Juice
The aim was to compare the nutritional composition of commercial and home-made OJ with a fruit content of 100%, i.e., without dilution with water and without addition of sugars or any other sweeteners.
Commercial orange juice: The aim was to create a sample that would be representative of the OJ market in France (Figure 1). For that purpose, segmentation of the French market for OJ was studied on the basis of the 2013 and 2014 figures for the French market shares (volume data) related to OJ from concentrate and not from concentrate (but not orange nectar). References to constitute the sample of commercial OJ were selected to reflect this segmentation and by choosing the best-selling references (by volume) among each segment. Market share data were obtained from three market research companies (Nielsen, Kantar World Panel and IRI, personal communications). Selected OJ reference samples were bought in July 2014. All chemical analyses were performed just after opening of the packaging.
Home-made orange juice: The aim was to create a sample that would be representative of the actual practices of French consumers regarding home-made OJ. For that purpose, answers from questions related to preparation and consumption of home-made juices obtained in the consumer survey described in Section 2.2 were used to define the protocol for preparation of home-made OJ (types of oranges, mode of squeezing). Oranges were bought in July 2014 and OJ samples were prepared according to the indications given by the result of the consumer survey (see Section 3.2. below). All chemical analyses were performed just after preparation of the OJ.
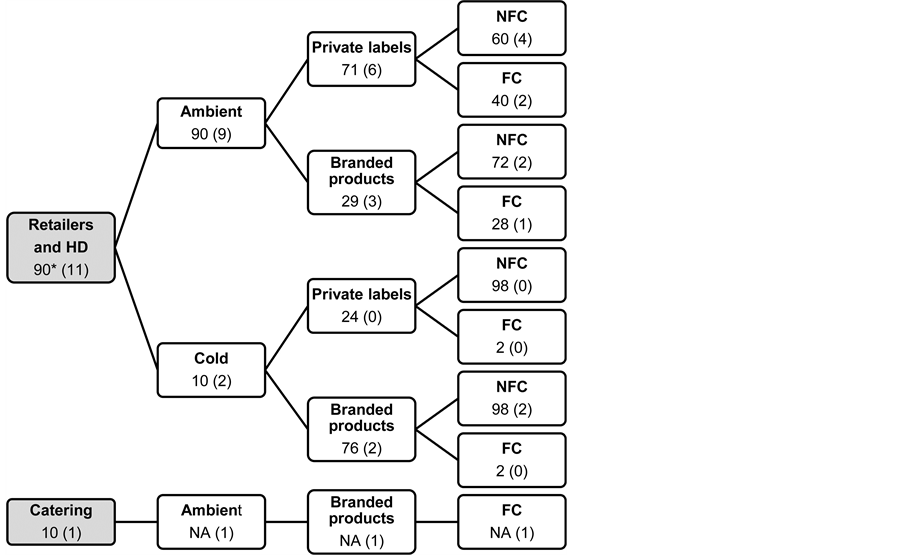
Figure 1. Segmentation of the French market for orange juices. *Market shares for orange juice are expressed in % (volume data, sources: Nielsen, moving annual total as of December 2013; Kantar World Panel, moving annual total as of November 2013; IRI, year-to-date as of April 2014; personal communications). The number in brackets indicates the number of corresponding references in the study sample of commercial orange juices (12 references in total). HD: hard discount. NA: data not available. NFC: not from concentrate. FC: from concentrate.
2.4. Sugar Composition
Sugar concentrations in OJ were measured according to methods published by the International Federation of Fruit Juice Producers (IFU). More precisely, glucose and fructose concentrations were measured according to method IFUMA55 [7] and sucrose according to method IFUMA56 [8] . Both methods are enzymatic methods and were performed by using an automatic spectrophotometer ABX PENTRA 400. All determinations were done once. Result uncertainties were given by the following formulas: glucose: U(g/L) = 0.714 + 0.03 × result; fructose: U(g/L) = 0.75 + 0.032 × result; sucrose: U(g/L) = 2 + 0.044 × result. For a glucose and fructose concentration of 20 g/L, this would correspond to an uncertainty of 1.3 and 1.4 g/L (i.e., approx. 7%), respectively. For a sucrose concentration of 40 g/L, this would correspond to an uncertainty of 3.8 g/L (i.e., approx. 10%). Total sugar concentration was the sum of the monosaccharides and disaccharides (glucose, fructose and sucrose).
2.5. Vitamin C
Vitamin C concentration in OJ was measured by high performance liquid chromatography (HPLC) according to NF V03-135 [9] using an Agilent (Agilent Technologies, Santa Clara, CA, USA) 1200 HPLC system equipped with a Quaternary Pump G1311A and coupled with a Diode Array Detector G1315D. OJ sample was diluted 1:20 with phosphate buffer pH 5.1. Then, 1 ml of dithiothreitol (6.12 g/L) was added to 5ml of this solution for the transformation of dehydroascorbic acid into ascorbic acid. Twenty μl were injected, and vitamin C (total ascorbic acid) was separated with a nucleosil® C18 column (250 mm × 4.6 mm; 5 μm particle size) and a CC 8/4 guard column (Macherey Nagel, Düren, Germany) using a mobile phase made of meta-phosphoric acid 0.8% at a flow rate of 1 mL/min. The detector was set at 254 nm and data were collected and analyzed by an Agilent Chem Station version B: 04:01 (Agilent Technologies, Santa Clara, CA, USA). All determinations were done once and the result uncertainty was given by the formula U(mg/L) = 1.4 + 0.07× result. For a vitamin C concentration of 400 mg/L, this would correspond to an uncertainty of 29.4 mg/L (i.e., approx. 7%).
2.6. Folate
Total folate concentration in OJ was measured by a microbiological assay using Lactobacillus casei ATCC 7469 (L. rhamnosus) and free folic acid-casei medium according to AOAC method 2004.05 [10] . Turbidity was measured using a Gilson 215 and a Scinco S-3100 spectrophotometer. All determinations were done once and the result uncertainty was 30%.
2.7. Total Polyphenols
Concentrations of total polyphenols were analyzed by a colorimetric assay using Folin-Ciocalteu phenol reagent (F?C reagent) according to method ISO-14502-1 [11] with modifications. One mL of OJ sample diluted 1:50 with deionized H2O was added to 0.5 mL of F?C reagent, 1.5 mL of 20% Na2CO3 and 7 mL of deionized H2O, mixed and allowed to react for 60 min at room temperature. Absorbance was measured at 765 nm. The quantification was done using an external calibration in four points with gallic acid solutions (80, 40, 10 and 1 mg/L). The sample concentration was expressed as mg gallic acid/L. The result uncertainty was given by the formula: U(mg/L) =10 + 0.25 × result. For a polyphenol concentration of 630 mg/L, this would correspond to an uncertainty of 167.5 mg/L (i.e., approx. 27%).
2.8. Total Dietary Fiber
Total dietary fiber was measured according to AOAC method 985.29 [12] with the modifications indicated in AOAC method 991.43 [13] . All determinations were done once and the result uncertainty was given by the formula U(g/100ml) = 0.1 + .
.
2.9. Titratable Acidity, Relative Density and Degree Brix
Titratable acidity was measured according to method IFUMA03 [14] by potentiometric titration (Titrando 809, Dosinos 800, 815 Robotic USB Sample Processor XL METROHM). All determinations were done once and results were expressed in citric acid (pH 8.1). The result uncertainty was given by the formula U(g/l) =
 . Relative density was measured according to method IFUMA01A [15] using a
density meter (Anton Paar DMA 5000). All determinations were done once and the result uncertainty was U = 0.00020. The corresponding Brix was calculated by using the tables relating Brix and Relative Density described in method IFUMA08 [16] .
2.10. Quality Control and Quality Assurance Procedure
All the analyses described above have been performed by a laboratory with ISO/IEC 17025 accreditation for the mentioned assays, except for the determination of total polyphenols. In accordance with the COFRAC (French Committee of Accreditation) specifications (LAB GTA25), a routine repeatability assay is performed every month for each analysis and before each measurement (a minimum of 95% of the results must be repeatable). Furthermore, each analytical session is internally verified with a control chart (internal or external reference material), and the laboratory takes part in a proficiency test every month.
2.11. Statistical Analyses
All results are presented as arithmetic means ± SD. The nutritional composition of the two samples of OJ (commercial and home-made OJ) were compared using the Wilcoxon-Mann-Whitney rank sum test. Statistical analyses were performed with R (2.13.0). Statistical significance was set at P < 0.05.
3. Results and Discussion
3.1. French Market for Orange Juice and Sample of Commercial Orange Juice
Figure 1 describes the segmentation of the French market for 100% OJ according to the channel of distribution (retailers, hard-discount or catering), the temperature used for the storage of juices (ambient or cold), the brand category (private labels or branded products), and the industrial process (OJ from concentrate or not from concentrate). References of commercial OJ (n = 12) were selected in order to reflect this segmentation (Figure 1). More precisely, most (75%) of the OJ references were purchased in the ambient departments of retailers and hard-discount stores. Private labels and branded products were represented in the same proportion (50% of the sample each). Sixty-seven per cent of the references were OJ not from concentrate and 33% were OJ from concentrate. All OJ samples were collected 1 to 2 months after packaging, i.e., at the beginning of their shelf life.
3.2. Consumer Survey and Sample of Home-Made Orange Juice
Results from the consumer survey showed that 93% of the questioned consumers who prepared home-made OJ bought specific oranges for this purpose (i.e., oranges labeled as “intended for juice” in the store). Most of the consumers (49%) used two oranges to make one serving of OJ (31%used ≥ three oranges, 20% used one orange) and the preferred method for squeezing was manual or electric citrus juicer (94%). Ninety-five per cent of the subjects consumed the juice less than 15 min after it was prepared, and 71% kept it at ambient temperature before consumption. The average volume of consumed home-made juice was 170 ml (77% consumed between 100 and 200 ml; 12% consumed ≥ 250 ml) and 95% of the subjects consumed home-made juice without addition of sugar or water. The sample of home-made OJ (n = 12) used in our study was created on the basis of these results (Figure 2). Briefly, three batches of oranges labeled as ‘intended for juice’ were collected in retailer stores (two private labels and one branded product). All oranges were of the same variety and origin (Valencia, Spain). Juices were made by squeezing the oranges with a manual or an electric citrus juicer, 3 or 11 days after purchase of the oranges (Figure 2), and all chemical analyses were performed less than 15 minutes following preparation.
3.3. Sugar Composition, Relative Density, Degree Brix and Titratable Acidity
As shown in Figure 3, the concentration of total sugars was not significantly different between commercial and home-made OJ (8.61 ± 0.427 g/100mL vs 8.35 ± 0.887 g/100mL, respectively, P = 0.45); commercial OJ contained significantly more fructose and glucose (P = 0.005 and 0.019, respectively), but significantly less sucrose (P = 0.001) than home-made OJ. Although the differences in individual sugars between the two types of juices were statistically significant, they were of relatively small magnitude and within the measurement uncertainty
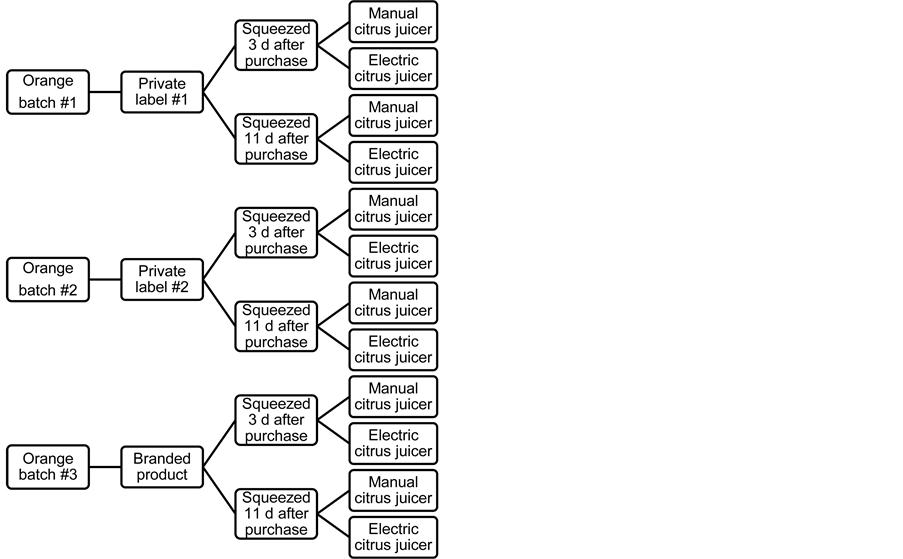
Figure 2. Compositions of the samples of home-made orange juices (n = 12).
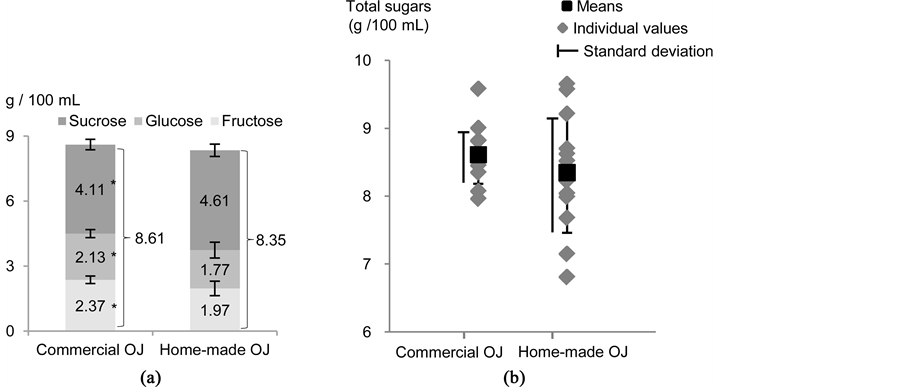
Figure 3. (a) Concentrations (means ± SD) of individual and total sugars in the commercial and home-made orange juices (g/100mL). (b) Distribution of the concentrations of total sugars (g/100mL) in the commercial and home-made orange juices. * denotes a significant difference between the means of the two samples (P < 0.05, Mann-Whitney test; n=12 for each sample).
for sucrose (approx. 10%). Differences in maturity, variety and/or origin between the oranges used to make home-made OJ and commercial OJ may explain those small variations. For instance, all the oranges used for home-made OJ originated from Spain while those used to make commercial OJ were mostly from Brazil. Furthermore, and as illustrated in Figure 3, distribution of the individual concentrations in total sugars within the 24 OJ samples showed a higher variability among home-made OJ samples. This may be explained by the fact that commercial OJ is commonly obtained by blending (OJ of various varieties, maturity stages and origins) to guarantee a constant organoleptic quality throughout the year, which probably leads to a higher homogenization of their sugar content.
Results for relative density and degree Brix reflected those obtained with total sugars since no significant differences were observed between the two types of OJ (relative density: 1.05 for both types of OJ; degree Brix: 11.2 ± 0.4 and 11.1 ± 0.9 for commercial and home-made OJ, respectively). Titratable acidity (pH 8.1) was significantly higher for home-made OJ (0.965 ± 0.188 g/100mL, expressed in citric acid) as compared with commercial OJ (0.739 ± 0.0596 g/100mL) (P = 0.001). Once again, differences in orange origin may explain this observation, oranges from Spain being generally more acidic than oranges from Brazil.
3.4. Vitamin C, Folate, Polyphenol and Dietary Fiber
Commercial OJ contained significantly less vitamin C (−15% approx.) and folate (−27%, approx.) than home- made OJ (vitamin C: 40.5 ± 10.1 mg/100mL vs 47.8 ± 8.59 mg/100 L, respectively, P = 0.035, Figure 4; folate: 25 ± 5.8 μg/100mL vs 34 ± 5.8 μg/100mL, respectively, P = 0.002, Figure 4). This difference is probably related to vitamin C and folate degradation that may occur during industrial production and storage of commercial OJ. In particular, pasteurization, which is used to avoid microbiological contamination, has been shown to induce a 6% to 11% reduction of vitamin C concentration in OJ [6] [17] . Besides, vitamin C concentration in OJ has also been shown to decrease during storage at ambient temperature, with an 18% to 39% reduction after 2 months, depending on the type of packaging [18] . This may therefore also explain the lower vitamin C concentration observed in commercial OJ, since analysis were performed 1 to 2 months after packaging and most of the references (10 out of 12) were stored at ambient temperature. Finally, the folate concentration measured in our OJ samples was similar to that previously reported by Ohrvik & Witthoft [4] (from 16 to 30 μg/100g). Therefore, the differences in vitamin concentrations observed in our study between commercial and home-made OJ appear to be within the expected ranges for vitamin loss due to pasteurization and storage at ambient temperature. Besides, they were of relatively small magnitude overall, with the concentration measured in commercial OJ representing 85% of that measured in home-made OJ for vitamin C and 73% for folate. The larger reduction observed for folate may be explained by the fact that this vitamin is known to be more fragile than vitamin C (higher sensitivity to oxidative degradation, light and heat) [19] .
Concentrations of total polyphenols were similar between the two types of OJ (63.3 ± 5.85mg/100mL vs 62.9 ± 5.94 mg/100mL, for the commercial and home-made OJ, respectively, P = 0.95, Figure 5). This result is not surprising, since hesperidin, which is the main polyphenol in OJ, is known to be stable in regard to pasteurization treatment, with a retention factor estimated at 95% for pasteurized OJ [20] [21] .
Finally, both commercial and home-made OJ contained low levels of dietary fiber, which were below the method’s limit of detection (i.e., <0.5g/100mL). Here, it should be specified that orange pulps were not reincorporated into the juice after squeezing during the preparation of the home-made OJ, and that 92% of the commercial OJ did not contain added orange pulps (11 references out of 12).
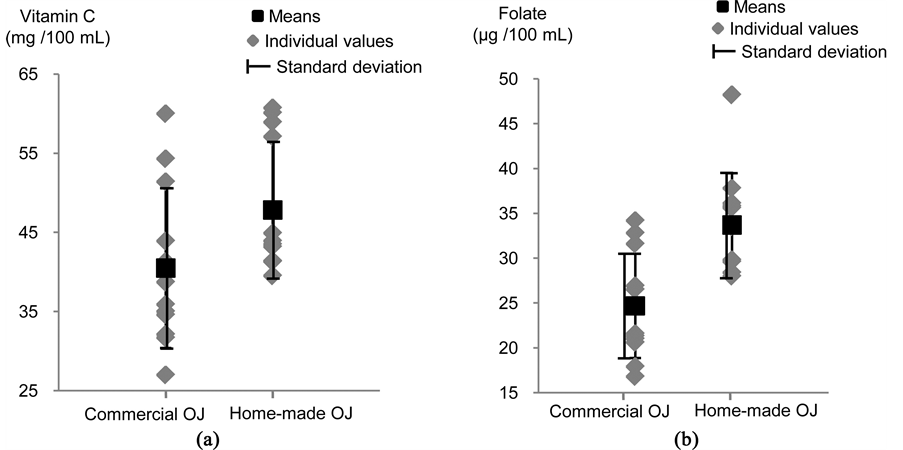
Figure 4. Vitamin C (a) and folate (b) concentrations in the commercial and home-made orange juices.
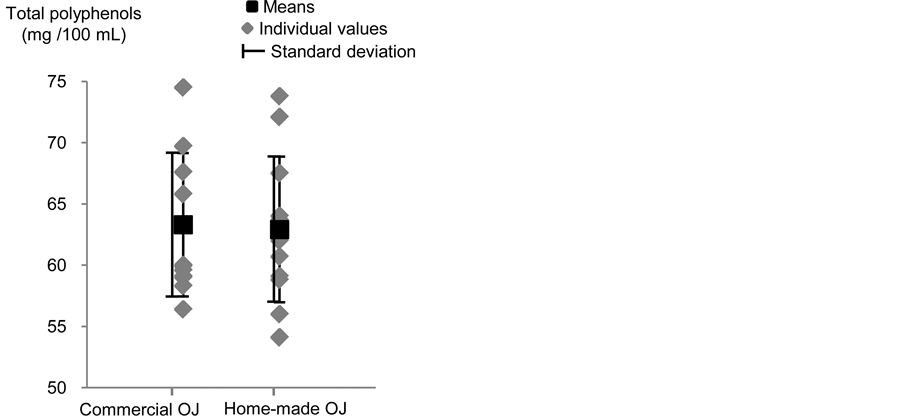
Figure 5. Concentrations of total polyphenols (mg/100mL) in the commercial and home-made orange juices.
3.5. Strengths and Limitations
Our study had some limitations that should be acknowledged. Although the sample size was sufficient to perform statistical comparisons between analytical data, our conclusions should be considered with caution because of the small number of analyzed samples, and results would need to be confirmed with another larger study. In particular, no conclusions could be drawn regarding the impact of the individual factors that could explain some of the result variability (e.g., orange variety and origin, types of packaging and storage temperature before opening for commercial OJ, mode of squeezing for home-made OJ). All oranges used to make home-made OJ were from the same origin (Spain) and of the same variety (Valencia), which therefore precluded any variability in these factors being introduced within the sample of home-made OJ. This was because fruit collections were all performed at the same time (July), and at that time of the year most oranges ‘intended to make juice’ that are available in French retail stores are of this variety and origin. Although Valencia is among the varieties most often used for home juicing in France, results for home-made OJ may need to be confirmed with further analyses with other types of oranges. Finally, although concentration of total polyphenols is almost equivalent to hesperidin concentration in OJ (since hesperidin is the dominant polyphenol), it would have been interesting to measure the flavanone glycosides (especially hesperidin) in our OJ samples instead of total polyphenols.
Our work had also several strengths. To our knowledge, it was the first study to compare the nutritional composition between home-made OJ and commercially available OJ, with a sample of products which was representative of the actual French market. Besides, the sample of home-made OJ was built to reflect the usual attitudes and practices of French consumers, as recorded from a consumer survey. These characteristics made our work original as compared with previous studies in this area, which did not consider commercially available OJ or home-made OJ prepared following usual consumer’s practices (e.g., [6] [17] [22] ).
4. Conclusion
This study compared the nutritional composition of two samples of commercial and home-made OJ, which were representative of the French OJ market and of French consumers’ habits. It showed that both types of OJ contained the same concentrations in total sugars and total polyphenols. Home-made OJ contained a very low amount of dietary fiber, as did commercial OJ. Vitamin C and folate concentrations were lower in commercial OJ than in home-made OJ, probably because of the vitamin degradation that may occur during industrial production (e.g., during pasteurization) and storage of commercial OJ. The observed differences were of relatively small magnitude, however, and within the expected ranges for vitamin loss due to pasteurization and storage at ambient temperature. Indeed, commercial OJ contained 85% of the vitamin C concentration measured in home- made OJ, showing that vitamin C was well preserved in commercial OJ. This is consistent with the fact that fruit juices, and OJ in particular, are important contributors to vitamin C intakes within the French population: being the primary contributor in children and the second most important contributor, after whole fruits, in adults [5] . Another study with a larger number of samples, and including a wider variability in relevant factors (e.g., orange varieties and countries of origin, types of packaging…), would be needed to confirm the observations of the current study and to provide further information on the impact of individual parameters on the vitamin content.
Acknowledgements
The authors wish to thank Petra Roberts who provided language help and reviewed the final version of the manuscript.
Conflict of Interest
LB is employee of Qualijus (Institut Professionnel pour la Qualité des Jus de Fruits). ACR and VB have received fees for technical and scientific consulting from the fruit juices professional associations.
Funding Source
Funding for this study has been provided by Qualijus. The funder did not have any role in study design; in the collection, analysis and interpretation of data; in the writing of the report; and in the decision to submit the article for publication.
Cite this paper
Aurelie Chanson-Rolle,Veronique Braesco,Julien Chupin,Laurence Bouillot, (2016) Nutritional Composition of Orange Juice: A Comparative Study between French Commercial and Home-Made Juices. Food and Nutrition Sciences,07,252-261. doi: 10.4236/fns.2016.74027
References
- 1. AIJN (2014) Liduid Fruit Market Report. AIJN European Fruit Juice Association, Brussels.
- 2. Galaverna, G. and Dall'Asta, C. (2014) Production Processes of Orange Juice and Effects on Antioxidant Components. In: Preedy, V.R., Ed., Processing and Impact on Antioxidants in Beverages, Elsevier, Amsterdam, 203-214.
http://dx.doi.org/10.1016/B978-0-12-404738-9.00021-0 - 3. AIJN (2012) Liduid Fruit Market Report. AIJN European Fruit Juice Association, Brussels.
- 4. Ohrvik, V. and Witthoft, C. (2008) Orange Juice is a Good Folate Source in Respect to Folate Content and Stability during Storage and Simulated Digestion. European Journal of Nutrition, 47, 92-98.
http://dx.doi.org/10.1007/s00394-008-0701-3 - 5. Braesco, V., Gauthier, T. and Bellisle, F. (2013) Jus de fruits et nectars. Cahiers de Nutrition et de Diététique, 48, 248-256.
http://dx.doi.org/10.1016/j.cnd.2013.07.001 - 6. Aschoff, J.K., et al. (2015) In Vitro Bioaccessibility of Carotenoids, Flavonoids, and Vitamin C from Differently Processed Oranges and Orange Juices [Citrus sinensis (L.) Osbeck]. Journal of Agricultural and Food Chemistry, 63, 578-587.
http://dx.doi.org/10.1021/jf505297t - 7. IFU (1985) Determination of Glucose and Fructose, Enzymatic (revised in 2005). International Federation of Fruit Juice Producers, Paris.
- 8. IFU (1998) Determination of Sucrose, Enzymatic (revised in 2005). International Federation of Fruit Juice Producers, Paris.
- 9. AFNOR (2011) Produits alimentaires—Dosage de la vitamine C par chromatographie liquide haute performance. Association française de normalisation, La Plaine Saint-Denis.
- 10. AOAC (2004) Total Folates in Cereals and Cereal Foods, Microbiological Assay—Trienzyme Procedure. AOAC International, Arlington, VA.
- 11. ISO (2005) Determination of Substances Characteristic of Green and Black Tea. Part 1: Content of Total Polyphenols in Tea. Colorimetric Method Using Folin-Ciocalteu Reagent. International Organization for Standardization, Geneva.
- 12. AOAC (1985) Total Dietary Fiber Determination. AOAC International, Arlington, VA.
- 13. AOAC (1991) Total, Soluble and Insoluble Dietary Fiber in Foods. AOAC International, Arlington, VA.
- 14. IFU (1996) Determination of Titratable Acidity (revised in 2005). International Federation of Fruit Juice Producers, Paris.
- 15. IFU (2000) Relative Density (Method using Density Meter) (revised in 2005). International Federation of Fruit Juice Producers, Paris.
- 16. IFU (2000) Determination of Soluble Solids (Indirect Method by Refractometry) (revised in 2005). International Federation of Fruit Juice Producers, Paris.
- 17. Naim, M., et al. (1997) Effects of Orange Juice Fortification with Thiols on p-Vinylguaiacol Formation, Ascorbic-Acid Degradation, Browning, and Acceptance during Pasteurization and Storage under Moderate Conditions. Journal of Agricultural and Food Chemistry, 45, 1861-1867.
http://dx.doi.org/10.1021/jf9608884 - 18. Berlinet, C., et al. (2006) Ascorbic Acid, Aroma Compounds and Browning of Orange Juices Related to PET Packaging Materials and pH. Journal of the Science of Food and Agriculture, 86, 2206-2212.
http://dx.doi.org/10.1002/jsfa.2597 - 19. Potier de Courcy, G., Christidès, J.P. and Hercberg, S. (2001) Apports Nutritionnels Conseillés pour la vitamine B9. In: Martin, A., Ed., Apports Nutritionnels Conseillés pour la population française, Technique et documation, Paris, 205-215.
- 20. Morand, C., et al. (2011) Hesperidin Contributes to the Vascular Protective Effects of Orange Juice: A Randomized Crossover Study in Healthy Volunteers. American Journal of Clinical Nutrition, 93, 73-80.
http://dx.doi.org/10.3945/ajcn.110.004945 - 21. Rothwell, J.A., et al. (2013) Phenol-Explorer 3.0: A Major Update of the Phenol-Explorer Database to Incorporate Data on the Effects of Food Processing on Polyphenol Content. Database.
- 22. Gil-Izquierdo, A., Gil, M.I. and Ferreres, F. (2002) Effect of Processing Techniques at Industrial Scale on Orange Juice Antioxidant and Beneficial Health Compounds. Journal of Agricultural and Food Chemistry, 50, 5107-5114.
http://dx.doi.org/10.1021/jf020162+
Abbreviations
AFNOR: Association française de normalisation.
AIJN: European Fruit Juice Association.
COFRAC: Comité français d’accréditation.
CREDOC: Centre de recherche pour l’étude et l’observation des conditions de vie.
IFU: International federation of fruit juice producers.
OJ: Orange juice.
NOTES

*Corresponding author.