Food and Nutrition Sciences
Vol. 4 No. 9A1 (2013) , Article ID: 36104 , 8 pages DOI:10.4236/fns.2013.49A1005
Dynamic Molecular Behavior and Cluster Structure of Octanoic Acid in Its Liquid and CCl4 Solution
![]()
Department of Chemistry, School of Science, Kitasato University, Sagamihara, Japan.
Email: *makio-iwahashi@jcom.home.ne.jp
Copyright © 2013 Hideyo Matsuzawa et al. This is an open access article distributed under the Creative Commons Attribution License, which permits unrestricted use, distribution, and reproduction in any medium, provided the original work is properly cited.
Received May 15th, 2013; revised June 15th, 2013; accepted June 22nd, 2013
Keywords: Octanoic Acid; Oleic Acid; Stearic Acid; X-Ray Diffraction; Near-Infrared Spectroscopy; Self-Diffusion Coefficient; 13C-NMR Spin-Lattice Relaxation Time; 1H-NMR Chemical Shift
ABSTRACT
Fatty acids such as oleic and stearic acids having a long hydrocarbon chain are known to exist as dimers in their melt and even in a non-polar solvent. In their melt the dimers arrange longitudinally and alternately to form clusters which resemble a smectic liquid crystal. The clusters determine the liquid properties of the fatty acids such as density, viscosity and fluidity. Then, do the dimers of fatty acid having a moderate-length hydrocarbon chain construct such the clusters? In the present study the dynamic molecular behavior and assembly structure of octanoic acid in its melt and also in CCl4 solution have been investigated by the X-ray diffraction, near infrared spectroscopy, 1H-NMR chemical shift, self-diffusion coefficient and 13C-NMR spin-lattice relaxation time measurements. From these results it has been revealed that the clusters of octanoic acid exist in its melt and also in CCl4 and that the clusters in the melt disintegrate with an increase in temperature. The dissociation profile of dimers of octanoic acid into monomers in CCl4 also has been clarified.
1. Introduction
Fatty acids are used in many fields such as cosmetic, detergent, food and lubricant industries; they are characteristic and significant components of most lipids and play an important role in functions such as flexibility, fluidity and material transfer in biomembranes. The functions seem to be responsible to the aggregated structures of the fatty acid molecules. Thus, for various needs in the industries and also from the fundamental aspects, it is important to reveal the relationship between the functions and the aggregated structures of fatty acids.
In the previous study on the liquid structure of various fatty acids it has been clarified that these fatty acids exist mostly as dimers in their melt and even in a non-polar solvent. Namely, through the measurements of near-infrared spectroscopy (NIR) and vapor pressure osmosis it has been revealed that cis-9-octadecenoic acid (Iwahashi, Suzuki, Czarnecki and Ozaki, 1995 [1]) and several nfatty acids (C8-C11) (Iwahashi, Kasahara, Minami, Matsuzawa, Suzuki and Ozaki, 2002 [2]) in their liquid states exist as dimers even at 80˚C: the dimers are the units in intraor intermolecular movements.
Furthermore, the dynamic molecular aspects and the assembly structures of several fatty acids having 18 carbon atoms such as cis-6-octadecenoic, cis-9-octadecenoic, cis-11-octadecenoic, trans-9-octadecenoic, and octadecanoic acids in their pure liquids were also studied at various constant temperatures (Iwahashi et al., 2000 [3]). The dimers of these fatty acids, which are stable even at high temperature, aggregate also to form clusters possessing the structure of a quasi-smectic liquid crystal: The long-chained fatty acid dimers arrange longitudinally and alternately to make an interdigitated structure in the clusters. The alignment in the longitudinal direction for the acid molecules resembles that for the dodecanoic acid molecules in A-form crystal (Lomer, 1963 [4], Goto and Ashida, 1978 [5]) and the cis-9-octadecenoic acid molecules in β1-form crystal. (Kaneko et al., 1997 [6]).
The existence of the clusters most likely determines the liquid properties of fatty acids such as density and fluidity. For example, a discrepancy between self-diffusion coefficient and density among the above acids has been clearly resolved using the above cluster model (Iwahashi et al., 2000 [3]). Furthermore, effect of additives on the cluster structure of cis-9-octadecenoic acid also was studied (Iwahashi et al., 2007 [7]); it was found that cholesterol strengthens the interaction among the acid dimers in the cluster and makes the cluster structure stable, while ethanol and benzene weaken the cluster structure.
Then, do the dimers of fatty acid having a moderatelength hydrocarbon chain construct such the clusters in the melt or in a non-polar solvent? If so, are the clusters stable at high temperature or in a dilute solution? To solve these questions, we measured the X-ray diffraction, self-diffusion coefficient, 13C-NMR spin-lattice relaxation time, near-infrared (NIR) spectroscopy and 1H-NMR chemical shift for the samples of octanoic acid in its melt and in its CCl4 solution.
2. Experimental
2.1. Materials
Sample of octanoic acid (>99.9%) was kindly supplied from the Research Institute Biological Materials (Kyoto, Japan). Octanoyl chloride (98%) was purchased from Tokyo Kasei Co. They were used without further purification. Carbon tetrachloride (CCl4: 99.5% pure) purchased from Nacalai Tesque INC (Kyoto, Japan) was dried over 5 Å molecular sieves and distilled under an atmosphere of dried nitrogen. Samples for the 13C-NMR spin-lattice relaxation time T1 measurements were prepared after a 30-minite-argon gas passing, using a glove box under an atmosphere of nitrogen gas to prevent the absorption of oxygen, which would make the T1 shorter.
2.2. Measurements
2.2.1. X-Ray Diffraction
X-ray diffraction measurement for the sample of octanoic acid was carried out on a X-ray diffraction instrument (Rigaku model RU-300) using MoKα (wavelength λ = 0.7107 Å) radiation (40 kV × 240 mA) in the temperature range 303 - 473 K ± 0.2 K. Samples were set in glass capillary cells with 2-mm diameter and 1/100-mm thickness. Scanning intensities in the range from 0.06 to 4.603 Å−1 in s value (s = (4π/λ) sinθ, 2θ = scattering angle) were measured (Iwahashi et al., 2000 [3]). The intensities were corrected by the subtraction of the back ground intensity. Deconvolution of the diffraction signals was carried out by assuming a Lorentzian curve for each signal and determined the peak positions of the signals.
2.2.2. NIR Spectrum Measurements
NIR spectra of the samples of octanoic acid and octanoyl chloride in CCl4 were measured at resolution of 1.0 nm on Hitachi-3500 spectrophotometer in a temperature range (293 - 313) ± 0.01 K at interval of 5 K (Iwahashi, Kasahara, Minami, Matsuzawa, Suzuki and Ozaki, 2002 [2]). A quartz cell having a 0.5-cm path length was used. A Hitachi temperature-regulated cell holder (No. 131- 0030) was used to maintain the temperature of the sample.
2.2.3. NMR-Chemical Shift
The chemical shifts, δ, of the OH protons of octanoic acid samples in CCl4 were measured on a NMR spectrometer (Japan Electron Optics Laboratory (JEOL) Model EX-400), using 1%-tetramethylsilane (TMS) in DMSO-d6 contained in 1-mm inner tube as a chemical shift standard in a temperature range (303 - 323) ± 0.5 K at interval of 10 K.
2.2.4. Self-Diffusion Coefficient
The self-diffusion coefficient, D, was determined by means of the pulsed-field gradient NMR method (Farrar and Becher, 1971 [8]). All the measurements were made on protons at 399.65 MHz in a temperature range (303 - 323) ± 0.5 K at interval of 5 K on the same NMR spectrometer with a probe for the pulsed-field gradient NMR measurements.
2.2.5. 13C-NMR Spin-Lattice Relaxation Time
The 13C-NMR spin-lattice relaxation time, T1, for octanoic acid samples was obtained by the inversion recovery method (Hertz, 1967 [9]) employing a 180-τ-90˚ pulse sequence, using also the same NMR spectrometer at 313 ± 0.5 K.
3. Results and Discussion
3.1. Aggregation Structure of Octanic Acid in Its Melt
X-Ray Diffraction Measurements
Figure 1 shows the X-ray diffraction spectra for the liquid sample of octanoic acid in its melt at various temperatures. There are three individual signals at a constant temperature: A broad signal exists around 0.4 Å−1 in s value, a large and sharp signal, around 1.4 Å−1 and a broad one, around 2.7 Å−1. The signal around 2.7 Å−1 would be attributable to the second-order reflection to the signal at 1.4 Å−1. The peak position of the 0.4 Å−1 signal slightly decreases and that of the 1.4 Å−1 signal apparently decrease with an increase in temperature. The X-ray diffraction spectra resembles those of the liquid samples of fatty acids having a long hydrocarbon chain such as cis-octadecenoic (oleic), trans-octadecenoic (elaidic) and octadecanoic (stearic) acids (Iwahashi et al., 2000 [3]). As mentioned in introduction, these long-hydrocarbon chained fatty acids are known to exist as dimers in the melt; their dimers arrange longitudinally

Figure 1. Temperature dependence of the X-ray diffraction spectra for octanoic acid. Temperatures are: 303, 343, 383, 423, 463 and 473 K.
and alternately to form clusters resembling a smectic liquid crystal. From the analogy of the X-ray diffraction pattern of these fatty acids in the liquid state, the 0.4 and 1.4 Å−1 bands for the sample of octanoic acid are thought to be attributable to the long and short spacing of the cluster composed of octanoic acid dimers, respectively. Namely the small s value is attributable to the long distance between the planes made by the dimeric carboxylic groups of aligned dimers; the band around 1.4 Å−1 gives a measure of the distance between adjacent molecules.
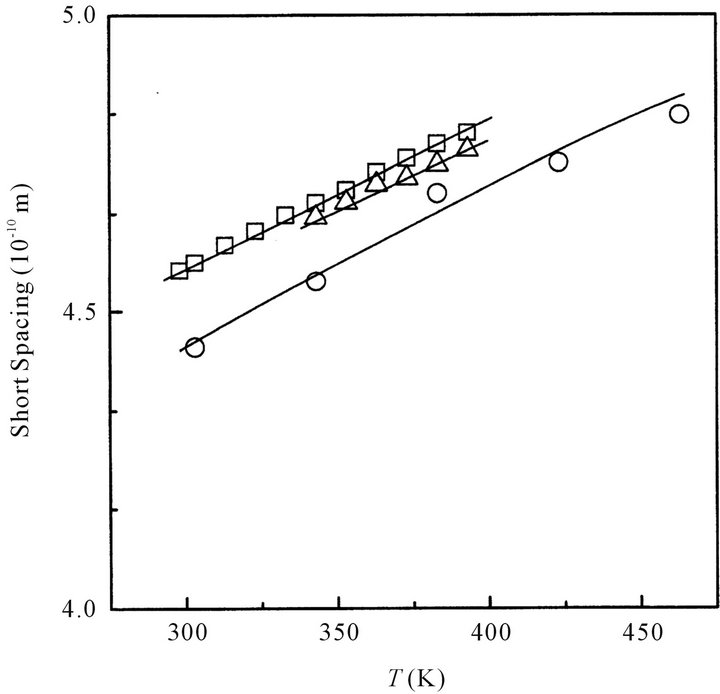
The short and long spacing of the cluster of octanoic acid in its melt is plotted in Figures 2(a) and (b), respectively, as a function of temperature. In the same Figures, those of oleic and stearic acids are also plotted.
Short spacing of octanoic, oleic or stearic acids increases with increasing temperature. This suggests that the distance between adjacent acid molecules increases with increasing temperature. Namely, at high temperature the dimers of the fatty acid tend to loosely pack together in the cluster.
Long spacing of octanoic acid slightly increases with increasing temperature, while those of oleic and stearic acids are almost constant irrespective of temperature. In the case of octanoic acid, the distance between the planes composed of dimeric carboxyl groups in the alternated interdigitated lameller structure would be gradually extended with increasing temperature. Namely the lamellar structure composed of the octanoic acid dimers seems to be not stable at high temperature: the clusters of octanoic acid are gradually disintegrated with increasing temperature. On the other hand, the clusters consist of oleic or stearic acid dimers having a long hydrocarbon chain would rigidly maintain the interdigated lamellar structure in the melt even at a high temperature.
As can be seen from Figure 2(b), at a relatively low constant temperature the long spacing of octanoic acid is
 (a)
(a)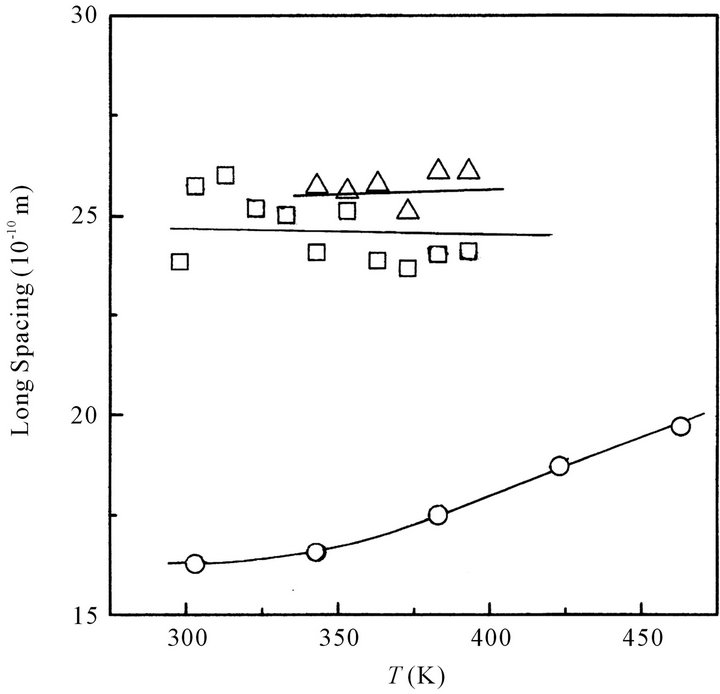 (b)
(b)
Figure 2. (a) Temperature dependence of the short spacing for octanoic (○), oleic (☐) and stearic acids (△), respectively; (b) Temperature dependence of the long spacing for octanoic (○), oleic (☐) and stearic acids (△), respectively.
larger than a half of that of the stearic acid, although the molecular length of octanoic acid is almost a half of that of stearic acid. Namely, octanoic acid dimers would arrange longitudinally and alternately to form an interdigitated lamellar structure (cluster) as like as stearic acid dimers do, however, the cluster structure of octanoic acid would be slightly different from that of stearic acid.
Figures 3(a) and (b) show the schematic drawings for the cluster structures of octanoic and stearic acids, respectively. The hydrogen-bonded dimeric carboxyl groups
 (a) (b)
Figure 3. Schematic drawings of the cluster structures of octanoic (a) and stearic acids (b) in their melts.
for octanoic acid exist in a same lateral plane as well as those for stearic acid, while the hydrocarbon parts of octanoic acid are aligned alternately but only partly interdigitated. On the other hand, as shown in Figure 3(b), those for stearic acid are completely interdigitated (Iwahashi et al., 2000 [3]).
Next, to reveal the molecular behaviors of octanoic acid in CCl4, we measured NIR spectroscopy of octanoic acid in CCl4 and estimated the degree of dissociation of octanoic acid dimer into monomers.
3.2. Dissociation of Dimer Molecules of Octanoic Acid into Monomer Species
3.2.1. NIR Spectroscopy
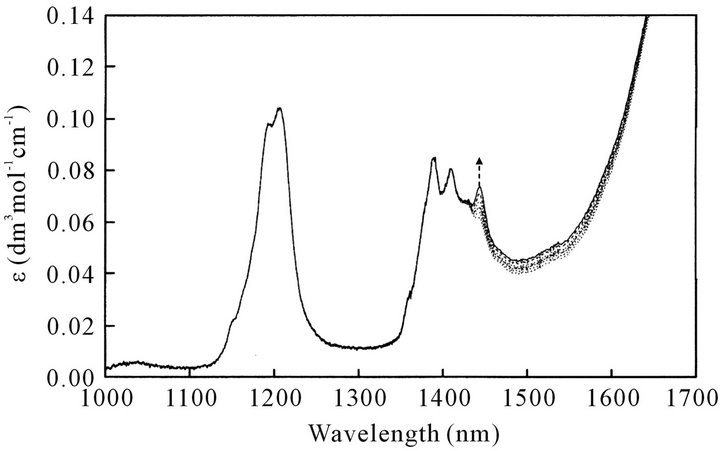
As a typical example, Figure 4(a) shows NIR spectrum for the neat sample of octanoic acid at various temperatures. The intensity of the absorption band is expressed in terms of molar absorptivity, ε. The spectrum for octanoic acid in melt has a band at 1445 nm being attributable to the OH vibration for free fatty acid (Iwahashi et al., 1993 [10]) which grows and becomes more intense with increasing temperature: that is, even in the melt of octanoic acid the acid dimers dissociate into monomers with an increase in temperature. However, as the band at 1445 nm is superimposed on the bands corresponding to the CH-vibration mode of the CH3 and CH2 groups, it is necessary to subtract all the contributions of the CH modes to obtain the net ε for the OH vibration mode. In the present work, we used octanoyl chloride, which does not contain OH group, to obtain difference spectra canceling the absorption band due to CH vibrations.
Figure 4(b) shows the NIR spectrum for the neat sample of octanoyl chloride. Normalization using 1200-nm CH-band height as a standard and subtraction of the spectrum of octanoyl chloride sample from that of the neat octanoic acid sample gave the difference spectrum,
 (a)
(a) (b)
(b) (c)
(c)
Figure 4. (a) Temperature dependence of NIR spectra of neat sample of octanoic acid. Temperatures are: 293, 298, 303, 308, 313, 318 K; (b) NIR spectra of neat sample of octanoyl chloride; (c) Difference NIR spectra of octanoic acid at various temperature: 293, 298, 303, 313 and 318 K. The 1445-nm band is attributable only to OH vibration of free octanoic acid monomer.
which provides the spectrum only for free OH group. Namely, as shown in Figure 4(c) the peak height of the 1445-nm band being attributable only to free-OH group increases with an increase in temperature.
Further NIR measurements were carried out for the various concentration samples of octanoic acid in CCl4 at various temperatures. From the analysis of the 1445 nm bands obtained for samples having various concentration, using 2.01 ± 0.14 dm3·mol−1·cm−1 (Iwahashi, Suzuki, Czarnecki and Ozaki, 1995 [1]) as the true molar absorption coefficient, ε0, of the completely free OH vibration of fatty acid, we determined the degree of dissociation, α, for octanoic acid dimer into monomers in CCl4, according to the procedure mentioned in the previous paper (Iwahashi, Suzuki, Czarnecki and Ozaki, 1995 [1]),
Figure 5 shows the concentration dependence of the degree of dissociation, α, in CCl4 at various temperatures. The α value increases with a decrease in concentration and with an increase in temperature. The α value, however, is not so large even in CCl4: Most octanoic acid molecules exist as dimers.
Interestingly at each constant temperature the α value steeply increases below 0.5 mole fraction (x) of octanoic acid. This indicates that the dissociation of octanoic acid dimer into monomers easily occurs below x = 0.5.
3.2.2. Self-Diffusion Coefficient
Figure 6 shows the concentration dependence of selfdiffusion coefficient, D, of octanoic acid in CCl4 at various temperatures. The D value also increases with a decrease in concentration and with an increase in temperature. Interestingly at each constant temperature the D value steeply increases below x = 0.5. As the D value for fatty acid monomer is thought to be larger than that of dimer, the dissociation of octanoic acid dimer would easily occur below x = 0.5.
3.2.3. Intramolecular Movements of Octanoic Acid Molecule
13C-NMR spin-lattice relaxation time T1 for the different carbon atoms along the hydrocarbon chain of octanoic
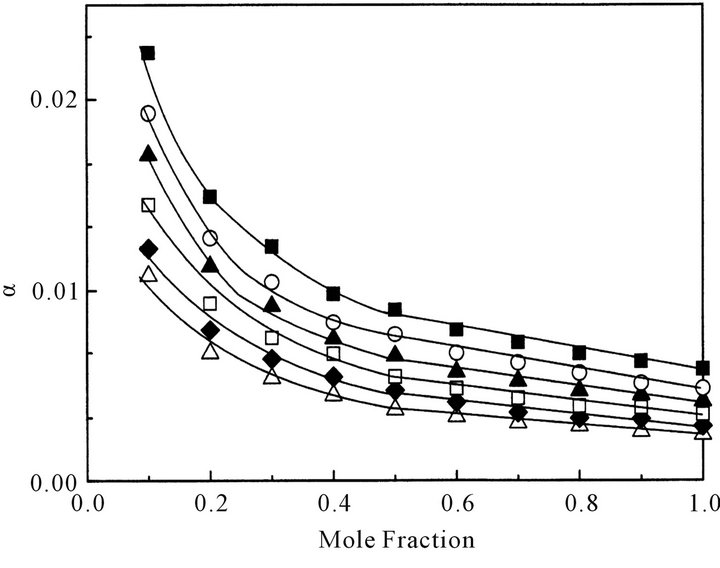
Figure 5. Concentration dependence of the degree of dissociation, α, of octanoic acid dimer in CCl4 into monomers at various temperatures: △ denotes 293 K; ◆, 298 K; ☐, 303 K; ▲, 308 K; ○, 313 K, respectively.
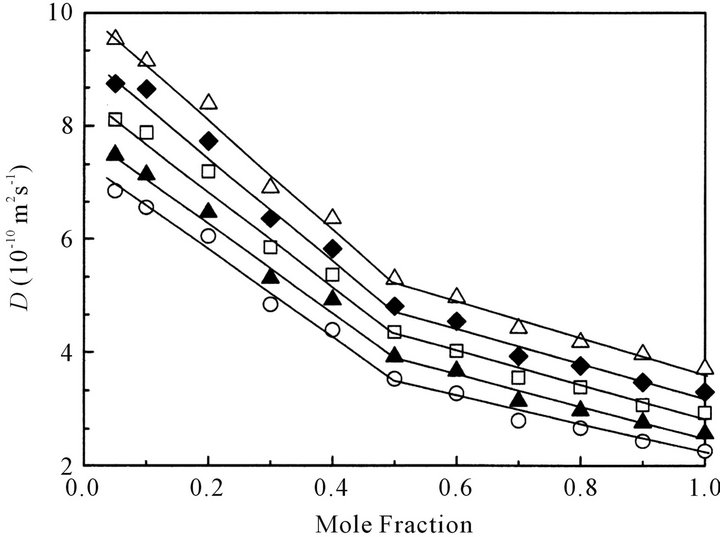
Figure 6. Concentration dependence of self-diffusion coefficient, D, of octanoic acid in CCl4 at various temperatures: ○ denotes 303 K; ▲, 308 K; ☐, 313 K; ◆, 318 K; △, 323 K, respectively.
acid in CCl4 at 313 K were measured at various concentrations. 13C-NMR spin-lattice relaxation of a protonated carbon is overwhelmingly dominated by dipole-dipole interactions with the attached protons; T1 for the carbon atom in a segment is related to the number of directly bonded hydrogen, N, and the effective correlation time, τc, for the rotational movement of the segments in the acid molecule (Hertz, 1967 [10]), that is, the reciprocal of τc represents the magnitude of the segmental movement of the carbon atom. T1 is given in terms of N and 1/τc
 (1)
(1)
where ħ (= h/2π) is Plank’s constant, and γc and γH are the gyromagnetic ratios of 13C and 1H, respectively. rCH is the C-H distance usually about 0.109 nm, and 1/τc represents the magnitude of the segmental motion of the carbon atom at different positions.
Figure 7 shows the relationship between segmental (intramolecular) movements of octanoic acid molecule, 1/τc, and the mole fraction of octanoic acid at 313 K. The 1/τc value for each carbon atom slightly increases with a decrease in concentration; the inclination of the 1/τc vs. mole fraction curve seems to be slightly steep especially below x = 0.5. Namely addition of CCl4 to octanoic acid seems to progress the dissociation of dimers and the segment movements especially below x = 0.5.
To make more clear the change in the 1/τc vs. mole fraction curve, we calculated the relative 1/τc value for the carbon atom at each position by using the 1/τc value for the neat sample of octanoic acid (x = 1) as a standard.
Figure 8 shows the relationship between the relative 1/τc and the position of each carbon atom at various concentrations at 313 K. Each relative 1/τc value of carbon atom at each position increases with a decrease in concentration. It should be noticed, however, that at x = 0.7
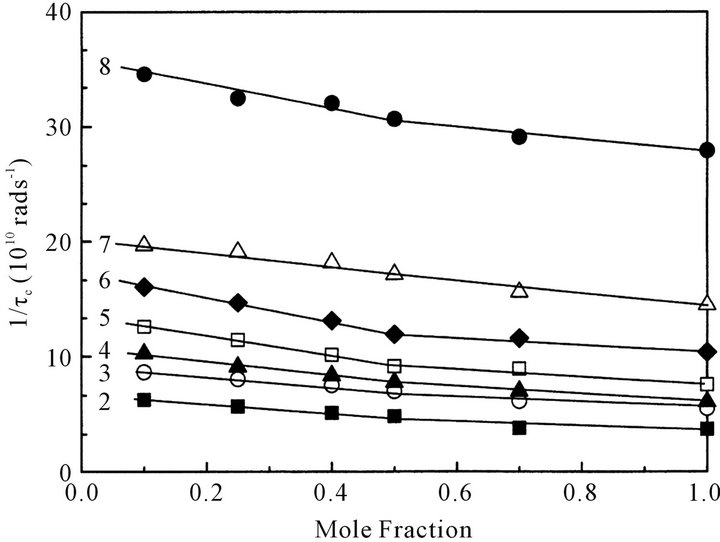
Figure 7. Concentration dependence of rotational reorientation (segmental movement), 1/τc, of carbon atoms at different position in octanoic acid in CCl4 at 313 K. The inserted number denotes the position of the carbon atom in octanoic acid molecule.
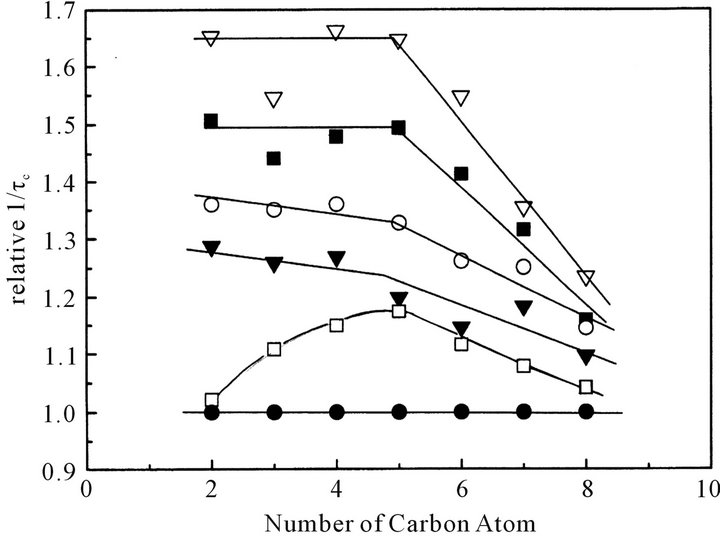
Figure 8. The relationship between relative 1/τc (relative rotational movement) and the position of carbon atom at various concentration at 313 K. ● denotes x (the mole fraction of octanoic acid) = 1; ☐, 0.7; ▼, 0.5; ○, 0.4; ■, 0.25; ▽, 0.1, respectively.
the 1/τc value of the carbon atom at the 2-position, which is close to dimeric carboxyl group, is almost same as that at x = 1 (pure liquid of octanoic acid); the 1/τc value of the carbon atom at the 2-position rapidly jumps up at and below x = 0.5.
Obviously CCl4 steeply progresses the dissociation of dimeric carboxyl groups below x = 0.5. Namely, below this concentration the disintegration of the clusters may occur, accompanied with a relatively high dissociation of octanoic acid dimers.
Consequently, the results of NIR spectra, self-diffusion coefficient and 13C-NMR spin-lattice relaxation time for octanoic acid in CCl4 at various concentrations clearly indicate that the dimers of octanoic acid gradually dissociate into monomers with a decrease in the mole fraction of octanoic acid up to x = 0.5 and largely, below x = 0.5.
It is generally known that an up-field shift of the 1HNMR signal of the carboxyl group of fatty acid means the increase in the dissociation of the fatty acid dimers into its monomers. Consequently the up-field shift of the 1H-NMR of the carboxyl group for octanoic acid should become larger below x = 0.5.
Thus, chemical shift of proton of carboxyl group of octanoic acid was measured at various concentrations and temperatures.
3.2.4. 1H-NMR Chemical Shift of COOH Group
Figure 9 shows the concentration dependence of 1HNMR chemical shift, δ, for COOH group of octanoic acid. The up-field shift of the 1H NMR signal is promoted with a decrease in the mole fraction of octanoic acid.
Contrary our expectation, however, the up-field shift steeply increases below not x = 0.5 but 0.2. This discrepancy can be explained as follows:
Clusters resembling a smectic liquid crystal composed of octanoic acid dimers would be maintained up to x = 0.5 in CCl4. Namely, the dissociation of dimers into monomers would be prevented up to this concentration. After the distortion of the above cluster, the dissociation would occur more easily.
However, even below x = 0.5, many free monomer OH groups would still exist in the deshielding region of neighboring C=O groups as shown in the upper schematic drawing of Figure 10. Below x = 0.2 free monomer OH groups would escape from the deshielding region of neighboring C=O groups as shown in the lower drawing in Figure 10. Thus, the true, large dissociation of dimer of octanoic acid into monomers is thought to

Figure 9. Concentration dependence of 1H-NMR chemical shift of OH proton of octanoic acid in CCl4 at various temperatures: ■ denotes 303 K; ☐, 313 K; △, 323 K, respectively.
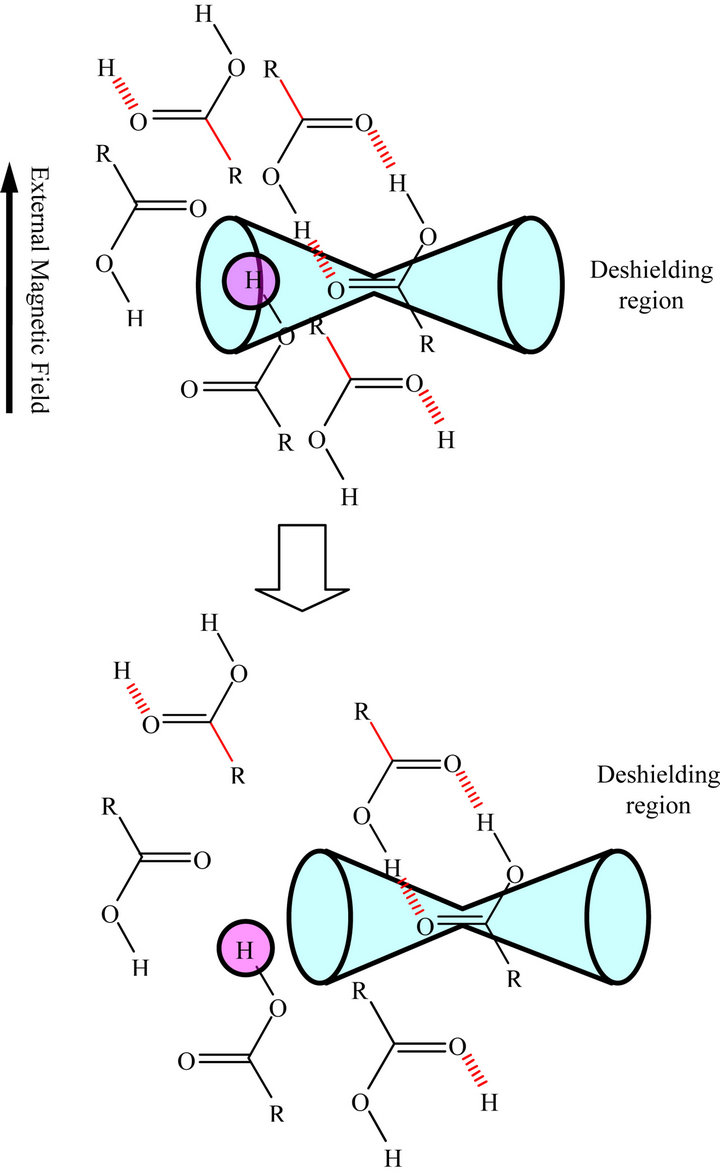
Figure 10. Schematic Drawings for the deshieling effect of a carbonyl group on the proton of neighboring octanoic acid molecule. Upper drawing denotes a situation of proton of free OH group of octanoic acid in a cluster at x = 0.5 and below one, below x = 0.2.
occur below x = 0.5.
4. Conclusions
The fatty acid exists as dimers in melt and even in nonpolar solvent such as CCl4. In melt and also in non-polar solvent the dimers arrange longitudinally and alternately to construct clusters resembling a smectic liquid crystal. The clusters of octanoic acid in melt are not so stable compared with those of long-chained fatty acids such as oleic and stearic acids.
NIR, self-diffusion coefficient and 13C-NMR spin-lattice relaxation time measurements suggested that the dimers of octanoic acid in CCl4 gradually dissociate into monomers with a decrease in concentration and steeply, below mole fraction x = 0.5. On the other hand, the up-field shift of the 1H NMR signal of the carboxyl group of octanoic acid steeply increases not x = 0.5 but 0.2. This discrepancy is explained by the deshielding effect of carbonyl group of neighboring fatty acid molecules on the proton of the free OH group. Consequently, the true, large dissociation of octanoic acid dimers into monomers in CCl4 occurs most probably below x = 0.5.
5. Acknowledgements
We express our thanks to Dr. Masao Suzuki of the Research Institute Biological Materials for the supply of the pure sample of oleic acid; also express our thanks to Dr. Yasutoshi Kasahara of Kitasato University, Dr. Kenji Nomura and Prof. Yukihiro Ozaki of Kwansei Gakuin University for the measurements and valuable discussions.
REFERENCES
- M. Iwahashi, M. Suzuki, M. A. Czarnecki and Y. Ozaki, “Near-IR Molar Absorption Coefficient for the OHStretching Mode of cis-9-Octadecenoic Acid and Dissociation of the Acid Dimers in the Pure Liquid State,” Journal of the Chemical Society, Faraday Transactions, Vol. 91, No. 4, 1995, pp. 697-701. doi:10.1039/ft9959100697
- M. Iwahashi, Y. Kasahara, H. Minami, H. Matsuzawa, M. Suzuki and Y. Ozaki, “Molecular Behaviors of n-Fatty Acids in Liquid State,” Journal of Oleo Science, Vol. 51, No. 3, 2002, pp. 157-164. doi:10.5650/jos.51.157
- M. Iwahashi, Y. Kasahara, H. Matsuzawa, K. Yagi, H. Nomura, H. Terauchi, Y. Ozaki and M. Suzuki, “SelfDiffusion, Dynamical Molecular Conformation and Liquid Structures of n-Saturated and Unsaturated Fatty Acids,” The Journal of Physical Chemistry B, Vol. 104, No. 26, 2000, pp. 6186-6194. doi:10.1021/jp000610l
- T. R. Lomer, “The Crystal and Molecular Structure of Lauric Acid (Form A1),” Acta Crystallographica, Vol. 16, 1963, pp. 984-988. doi:10.1107/S0365110X63002632
- M. Goto and E. Ashida, “The Crystal Structure of the A-Super Form of Lauric Acid,” Bulletin of the Chemical Society of Japan, Vol. 51, No. 1, 1978, pp. 70-74. doi:10.1246/bcsj.51.70
- F. Kaneko, K. Yamazaki, K. Kitagawa, T. Kikyo, M. Kobayashi, Y. Kitagawa, Y. Matsuura, K. Sato and M. Suzuki, “Structure and Crystallization Behavior of the β Phase of Oleic Acid,” The Journal of Physical Chemistry B, Vol. 101, No. 10, 1997, pp. 1803-1809. doi:10.1021/jp963400a
- M. Iwahashi, A. Umehara, K. Wakisaka, Y. Kasahara, H. Minami, H. Matsuzawa, H. Shinzawa, Y. Ozaki and M. Suzuki, “Effect of Cholesterol and Other Additives on Viscosity, Self-Diffusion Coefficient, and Intramolecular Movements of Oleic Acid,” The Journal of Physical Chemistry B, Vol. 111, No. 4, 2007, pp. 740-747. doi:10.1021/jp0619538
- T. C. Farrar and E. D. Becker, “Pulse and Fourier Transform NMR,” Academic Press, New York, 1971.
- H. G. Hertz, “The Problem of Intramolecular Rotation in Liquids and Nuclear Magnetic Relaxation,” Progress in Nuclear Magnetic Resonance Spectroscopy, Vol. 3, 1967, pp. 159-164. doi:10.1016/0079-6565(67)80015-3
- M. Iwahashi, N. Hachiya, Y. Hayashi, H. Matsuzawa, M. Suzuki, Y. Fujimoto and Y. Ozaki, “Dissociation of Dimeric cis-9-Octadecenoic Acid in Its Pure Liquid State as Observed by Near-Infrared Spectroscopic Measurement,” The Journal of Physical Chemistry, Vol. 97, No. 13, 1993, pp. 3129-3133. doi:10.1021/j100115a011
NOTES
*Corresponding author.