Food and Nutrition Sciences
Vol. 4 No. 9A2 (2013) , Article ID: 36155 , 9 pages DOI:10.4236/fns.2013.49A2005
Coconut Press Cake Alkaline Extract—Protein Solubility and Emulsification Properties
![]()
1Department of Chemical Engineering, Faculty of Engineering, Eduardo Mondlane University, Maputo, Mozambique; 2Department of Food Technology Engineering and Nutrition, Lund University, Lund, Sweden.
Email: *Borges.Chambale@food.lth.se, bjorn.bergenstahl@food.lth.se, Petr.dejmek@food.lth.se
Copyright © 2013 Borges Chambal et al. This is an open access article distributed under the Creative Commons Attribution License, which permits unrestricted use, distribution, and reproduction in any medium, provided the original work is properly cited.
Received May 2nd, 2013; revised June 2nd, 2013; accepted June 9th, 2013
Keywords: Coconut Proteins; Coconut Milk Press Cake; Alkaline Extraction; Oil-in-Water Emulsions; Solubility; SDS-PAGE Electrophoresis
ABSTRACT
The solubility and the emulsification properties of a crude freeze dried alkaline protein extract (APE), 30% protein, obtained from coconut milk press cake by one step extraction at pH 11, were characterized at pH 2 to 11, and the cream and subnatant fractions of the emulsion studied by SDS-PAGE electrophoresis. The protein solubility followed U profile, showing a minimum at pH 3 to 4, close to but not identical to reported iso-electric points of 4 - 5 for many coconut protein fractions. The extract showed good capacity to form oil-in-water emulsion outside the low solubility pH range. The bands that appeared to play a role in the emulsification were found at 32 and 42 kDa in SDS-PAGE electrophoresis, but the most predominant absorbed band was at 23 kDa.
1. Introduction
In a view of potentially increasing demand of food ingredients based on vegetable proteins [1-3], the coconut press cake, a by-product discharged as a waste in the coconut milk industry, appears to be one of the cheaper alternative source for protein in the coconut growing countries. FAO has estimated an overall coconut output of 61.7 million ton in 2009 [4], of which 25% is generally used for coconut milk [5]. Although the coconut press cake does not contain appreciable amounts of protein, when compared to other protein reach oil seeds, like as the lupine seeds (protein content 31% - 35%) [1], the huge amount of the press cake available at no cost still makes it of the practical interest. We have reported 3% - 4% protein in fresh press cake (37% moisture), obtained through mechanical pressing of the comminuted coconut endosperm [6].
A simple one step alkaline method for protein extraction has shown reasonable yields, of about half of the original press cake protein [6]. Therefore, the aim of this work was to evaluate the possible applications of the alkaline protein extract as a food emulsifier, by investigating some of its functional properties, namely the solubility and emulsifying capacity. The experiments were conducted in dilute systems in a wide range of pH conditions.
Proteins are among most common emulsifiers used in stabilizing oil in water (O/W) food emulsions, preventing them from coalescence through adsorption onto the oil droplet surfaces [7]. Proteins, as amphiphilic surfactants, have the advantage of being partially soluble in both oil and aqueous phase, thus providing a barrier for separating the oil droplets. They are natural, non-toxic, cheap food ingredients and widely available [8]. To stabilize the emulsion, the protein hydrophobic domain is ideally oriented towards the oil phase [9], following the protein structure rearrangement at interface [10]. Therefore, the extent to which the droplets are covered is determined by the protein surface hydrophobicity, charge and protein flexibility [11]. Long term stability of emulsions depends basically on the thickness and strength of the adsorbed protein film at the oil-water interface [12].
The emulsifying properties of different coconut proteins fractions, namely: the coconut cream protein concentrate, coconut milk insoluble protein, coconut skim milk protein isolates, obtained under different procedures have been reported and demonstrated that the emulsions are relatively of the large droplet size (d43 ≈ 10 μm), [13-17].
However, very little is known about the functional properties of coconut protein fraction obtained under alkaline conditions. The efficacy of a protein or a protein mixture in stabilizing emulsions cannot be easily predicted and thus we determined experimentally the properties of the alkaline press cake extract.
2. Materials and Methods
2.1. The Alkaline Protein Extract (APE)
The crude alkaline protein extract (APE) powder was produced according to the method described in our previous work (Chambal, B. et al., 2011). For this purpose, therefore, 1.2 kg of the coconut endosperm press cake were used to produce approximately 80 g of frieze dried APE. The extract contained 30% protein, (Kjeldahl, protein = N × 6.25), analyzed according to FOSS user man ual [18] and less than 1% moisture. The extraction wascarried out in a6 liter batch in a multi-purpose processing vessel (Electrolux, EBD-40, Sweden). The resulting slurry was coarsely filtered and the liquid extract freeze dried. The freeze dried extract powder was stored in the fridge, under cold and dry conditions, for subsequent use.
All the coconuts used for the press cake were collected in Inhambane Province, south of Mozambique and were of native taller varieties with an average size of 600 ± 50 g per unit.
2.2. Protein Solubility
The solubility of the APE powder was determined at different pH’s using Coomassie Blue G-250 (Serva, Feinbiochimica, Germany) as a dye and Bovine Serum Albumin (Sigma, USA) as the standard protein, according to the Bradford method [19]. The APE powder was dispersed by vortex at 3 concentrations levels: 0.1; 0.5 and 0.8% w/v in a buffer solution consisting of a mixture of (10 mM Na2CO3, 5 mM Imidazol, and 5 mM CH3COONa, initial pH = 10.7), to form 3 stock samples. Samples in the pH range from 2 to 11, were produced by diluting each stock solution 1:10 the buffer, previously adjusted to the desired pH by NaOH/HCl 5N, and centrifuging at 5000 g for 30 minutes (Beckman Coulter, Allegra X-15R centrifuge, USA). This resulted in a diluted concentration series: 0.01, 0.05 and 0.08% APE, adjusted to the pH 2 to 11. These series were used in all assays, namely: solubility profile, emulsification and SDS-PAGE electrophoresis.
The water used in all preparations was deionized and Millipore filtered and all the chemicals were of pro analysis grade.
The absorbance data, at 595 nm, were taken from the scan records, performed in a Varian Cary WinUV 50 spectrophotometer (Pleasantville, NY). The protein solubility was then expressed in terms of percentage of the soluble protein related to the original, in the APE powder on basis of BSA calibration curve content in the absorbance range of 0.027 - 0.27.
2.3. Emulsifying Capacity and Particle Size Distribution
The emulsifying capacity of the APE was evaluated by measuring the droplet size of the emulsions, using the mode values from the Mastersizer distribution (Mastersizer 2000, Malvern Instruments, Worcestershire, UK). The emulsions were prepared by dispersing 3% n-Hexadecane (99%, ACROS Organics, New Jersey, USA) in the APE centrifuged solutions, for all 3 diluted concentration series, in the range of pH 2 - 11 and stirred, at highest speed (6), in the ultraturax blender (UltraturaxYstral D-79282, Germany), for 1 minute, in a total volume of 15 ml suspension.
Aliquots of representative sample emulsions, previously gently homogenized, were loaded into the mastersizer 2000 and run according to the user manual. The Refractive indexes for n-Hexadecane and water were set to 1434 and 1330, respectively and the absorption to 0.01. 15% of the laser beam obscuration was used to control the amount of the sample added into the dispersion unit.
2.4. SDS-PAGE Electrophoresis
The samples for electrophoresis were split into 3 groups, as follow: 1) the initial APE solutions; 2) the emulsion subnatants, free from the droplets, and 3) the emulsion cream layers. This was aimed to analyse and distinguish the fractions with potential emulsifying capacity and those lost by aggregation and iso-precipitation.
To prepare creams and subnatants, the emulsion was centrifuged at low temperature (10˚C) 5000 g for 30 minutes for flocculation and solidification of the droplets on top of the centrifuge tubes, forming the cream layer 3), which was then separated. Initial solutions and subnatants (800 µl) were dried in a vacuum oven, at 50˚C, 30 in Hg (vacuum), for about 5 h. The vacuum dried samples were first rehydrated in 12 µl of a SDS-PAGE buffer (0.0625 M Tris-HCl, 2% SDS, 10% v/v glycerol, 0.1 M DTT and 0.01% bromophenol blue, pH 6.8), desalted in a Pierce Spin desalting column [20] and then followed the same treatment as 1) according to the manual [21].
The cream 3) separated from the subnatants were blotted in a filter paper to remove any subnatant undertaken during separation and placed in the Eppendorf tubes for extraction with the 1 ml SDS-PAGE buffer, at a room temperature, with shaking, for 6 hours. The SDS-PAGE extract was centrifuged and separated from the hexadecane and then concentrated in a 2 ml Eppendorf tubes with Molecular Weight Cut Off (MWCO) equal to 10 kDa. Approximately 800 μl of the buffer extract was used in concentration. At the end, the extract was resuspended again in the SDS-PAGE buffer in a 1:1 ratio. Subsequent treatment was the same for all samples. 1 DE, SDS-PAGE (1 Dimension, Sodium Dodecyl Sulfate—Polyacrylamide Gel Electrophoresis) was conducted in all samples, in a gradient 8% - 25% Tris-HCl mini gel, [21], according to the user manual. For all groups, 12 µl of the rehydrated samples were transferred to 1 ml Eppendorf tubes and then heated to 100˚C for 5 minutes, cooled down and shortly spinned out before loading (2 µl) into the Phasta separation unit.
The gels were stained with Coomassie dye binding solution (0.025% Coomassie Brilliant Blue R250, 40% v/v methanol, 7% v/v acetic acid), overnight and destained successively in destaining solutions 1 (40% v/v methanol, 7% v/v acetic acid) and 2 (7%v/v acetic acid, 5% v/v methanol), according to PhastSystemTM manual.
3. Results and Discussion
3.1. Protein Solubility
The solubility profile of the APE powder in the buffer was found to be affected by the pH, showing a minimum, at pH3, for all 3 concentration series, as illustrated in Figure 1. At this point almost 90% of the original soluble protein was iso-electrically precipitated, except that for the most diluted suspension, the 0.01% APE (or 0.003% protein), which was about 50%. These results differ slightly from those reported by Kwon and Samson for whom the iso-electric points (pI) were falling in the range of pH 4 - 5, working with coconut protein concentrates dispersed in water [22,23]. However, they also found that the iso-electric points were displaced toward the lower pH’s, as the ionic strength of the solvent was increased. Using 2% NaCl aqueous solution they reached a minimum solubility at pH around 3. Onsaard [14] also demonstrated that protein fractions obtained from coconut cream by iso-electric precipitation and freeze-thaw treatments were behaving slightly differently, regarding the pH effect and ionic strength. The solubility trends were of the U shaped curves, with a minimum at the pH 4 - 5 for all protein fractions, but the ionic strength (0 to 200 mM NaCl aqueous solution) was slightly increasing the solubility at the pH close to the iso-electric region, while decreasing at the pH values far from the pI. These effects were attributed to the screening effect of the electrostatic interactions between protein molecules. Similar trends were also observed when investigating the solubility profile of another protein fractions isolated from the coconut skim milk, by iso-electric precipitation and ultrafiltration concentration. However, for these fractions the ionic strength was only leading to an increase of solubility over all the pH’s outside of the isoelectric zone [13].
The effect of the ionic strength in the APE series was negligible, as the series were diluted systems. The slight changes of the ionic strength was only due to the buffer used in the production of the APE powder from the press cake, since that of the solvent used in the dispersion was kept constant, at 20 mM, for overall buffers. The buffer incorporated into the APE corresponded to 0.4 and 3 mM Na3PO4, depending on the concentration, and did not materially affect total ionic strength. The solubility agreed well for 0.05 and 0.08% protein, Figure 1. A small amount of protein could be apparently solubilized by other components of the extract even in the pH 3 - 4
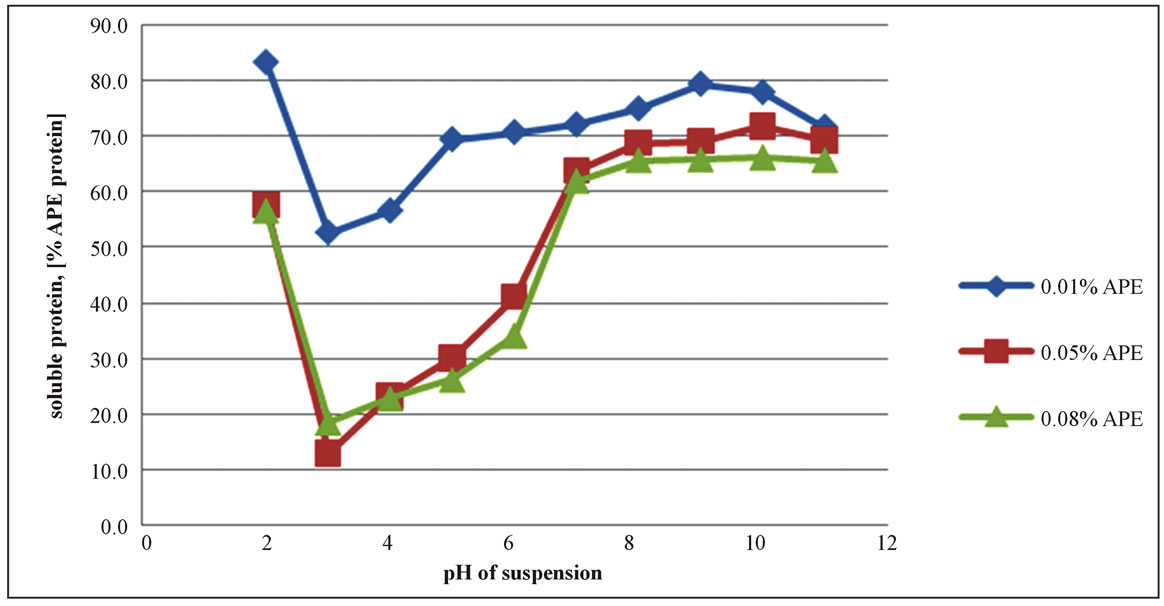
Figure 1. Apparent solubility profile of the alkaline protein extract (APE) as a function of pH.
range, as seen in the results for 0.01% protein.
The re-dispersion of the freeze dried APE powder in the buffer did not dissolve completely its protein, no matter how far from the iso-electric point the pH actually was. This is not unexpected. Coconut proteins are dominated by the globulins, which account for 80% of the total [24] and the fraction needs higher ionic strength (0.1 to 0.4 M NaCl solutions) for dissolution.
3.2. Emulsifying Capacity and Size Distribution
The 3 diluted APE series showed capacity to form oil-inwater (O/W) emulsions in the whole range of pH under analysis, except at pH 3 and 4. At these points no emulsion was observed. The dispersions were immediately collapsing into their original phases, as soon as the agitation ceased.
The emulsifying capacity of the protein determined by the droplet size, taken from mode values of the Mastersizer distribution is shown in Figure 2. In general emulsions are classified according to the dispersed oil droplet sizes and most food emulsions fall in range of 0.2 - 50 µm [25]. Therefore, the APE emulsions were within the normal food emulsion size range.
Surprisingly, even the lowest APE protein concentration, corresponding to oil/protein ration of 300 was sufficient to produce an emulsion at the neutral and alkaline pHs. As expected, the lowest concentration series gave larger oil droplets and therefore, more creaming and unstable emulsions, compared to those at the intermediate and higher concentration.
The environmental conditions seem to have had little effect on the emulsifying capacity of the protein, as the particle sizes did not change significantly in the whole range of the highest solubility pH (7 - 11). The profiles are more likely related to the protein solubility behavior, rather than the pH effect itself. However, at the pH2 the emulsions exhibited large droplet sizes, although the solubility was high. The net positive charge of the proteins below the iso-electric points may have affected their conformations, resulting in unfolding and inability to adsorb and cover effectively the oil droplets.
The volume size distribution of the APE emulsions was essentially monomodal for the higher concentrated series, although a second minor mode of the population of smaller particles in the range of 1 μm was becoming important for the diluted one, as illustrated in Figure 3.
Similar results were obtained by Onsaard [13], at similar oil/protein ratio, however, working with more concentrated emulsions (10% corn oil-in-water) stabilized by 0.2% coconut skim milk protein concentrates, at pH 7 and using high pressure homogenizers.
The emulsification behavior of the APE series may be affected by the fact that the extract was not a pure protein isolate, but rather, a crude protein extract containing also many other components, among which, e.g. saponified coconut fats that may have played a role as emulsifiers.
A number of different studies have shown that the pH influences indirectly the emulsifying capacity of the proteins by affecting their solubility. However, Mc Watters and Ramanatham [26,27] working with peanut proteins
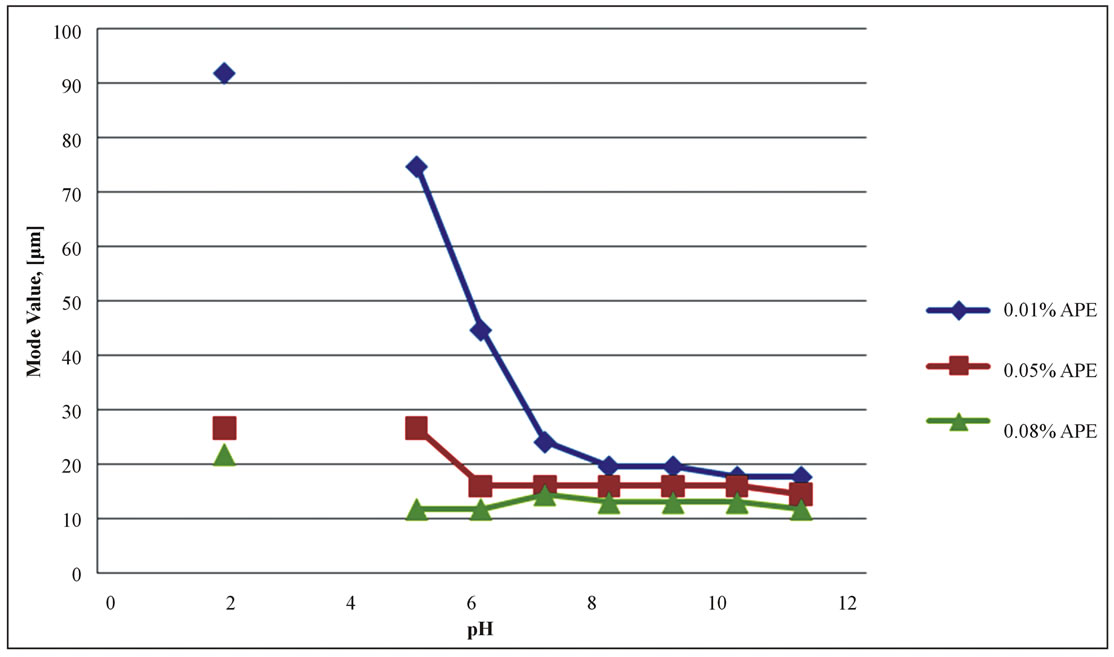
Figure 2. Mode values of the Mastersizer volume distribution as a function of pH. No emulsions were observed at the pHs 3 and 4.
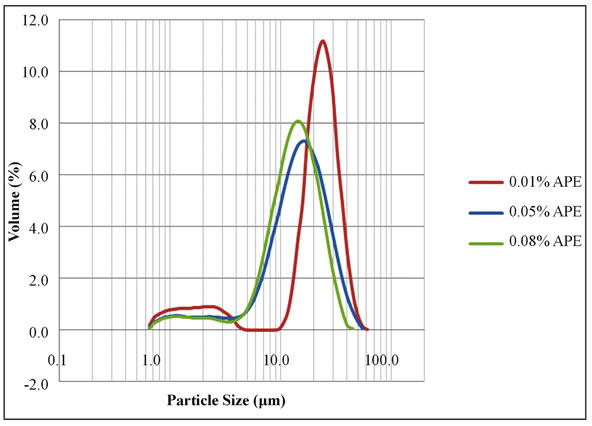
Figure 3. Size distribution of the APE emulsion droplets of 3% (v/v) n-Hexadecane in pH 7 buffer.
demonstrated that the emulsifying properties cannot be predicted solely on the basis of solubility level, as some proteins like egg white and gelatin perform well at their iso-electric points. Nakai [28] reported that the solubility, the surface hydrophobicity and molecular flexibility influence the emulsification behavior of globular proteins.
The amount of the protein adsorbed during emulsification as well as that in the “initial solutions” and “subnatants” are summarized in the Table 1.
The adsorption of the protein during emulsification was relatively higher at the intermediate pHs, above the minimum solubility range, pH 3 - 4 and up to around pH 9. But at the extreme acidic or alkaline conditions, where the proteins bear high net positive or negative charges the adsorption tended to decrease down to almost a half.
So, the limiting factor for the complete emulsification of the oil and hence, the entire surface coverage was not the lack of protein itself, since there was still some protein left after emulsification in almost all the cases. This suggests that factors other than the availability of protein might have played their role in the process. In fact, the table shows that even at the pH 3 - 4, dominated by small size proteins (see SDS-PAGE), there was adsorption, but with no effective stabilization. The electrophoresis results suggest that proteins of peaks B and C, absent in the pH 3 - 4 range (discussed in the next section) are the ones most responsible for emulsification.
3.3. SDS-PAGE Electrophoresis
To determine the proteins with potential ability to adsorb onto the emulsion droplets, SDS-PAGE electrophoresis was conducted on the intermediate series (0.05% APE). The density scans of the gels are shown in Figures 4-6. As detailed in the method description, 3 groups of sam-
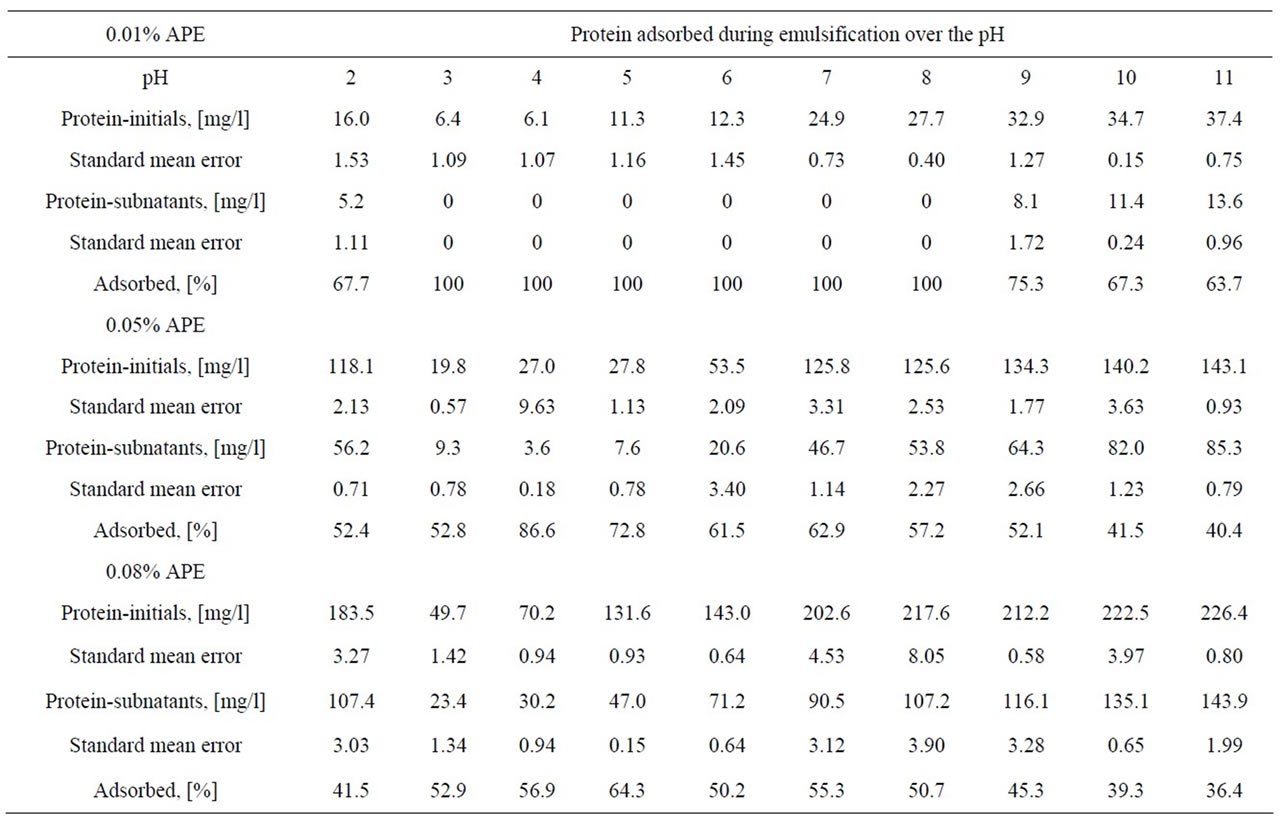
Table 1. Mean values of the protein adsorbed during the emulsification process, for the 3 APE concentration series. Triplicates were used for the protein determination along the pH.
 (a)
(a)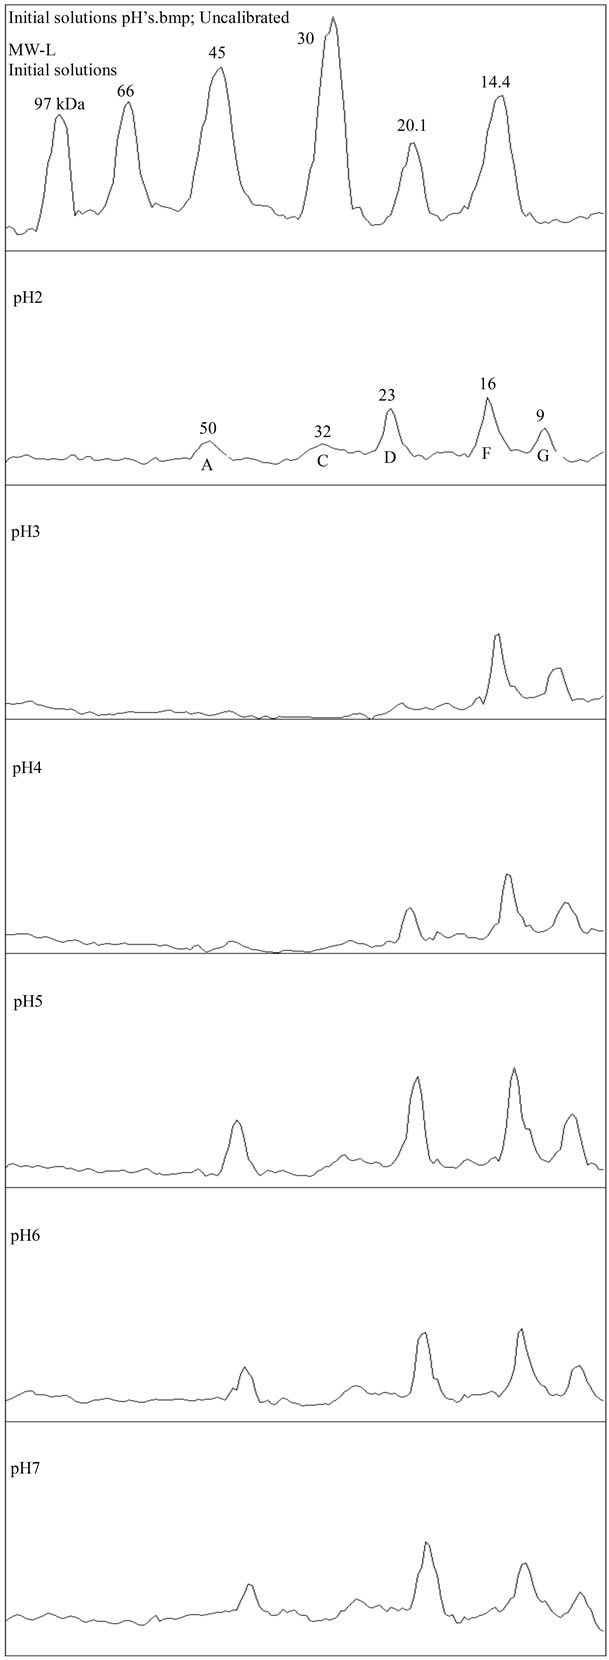 (b)
(b)
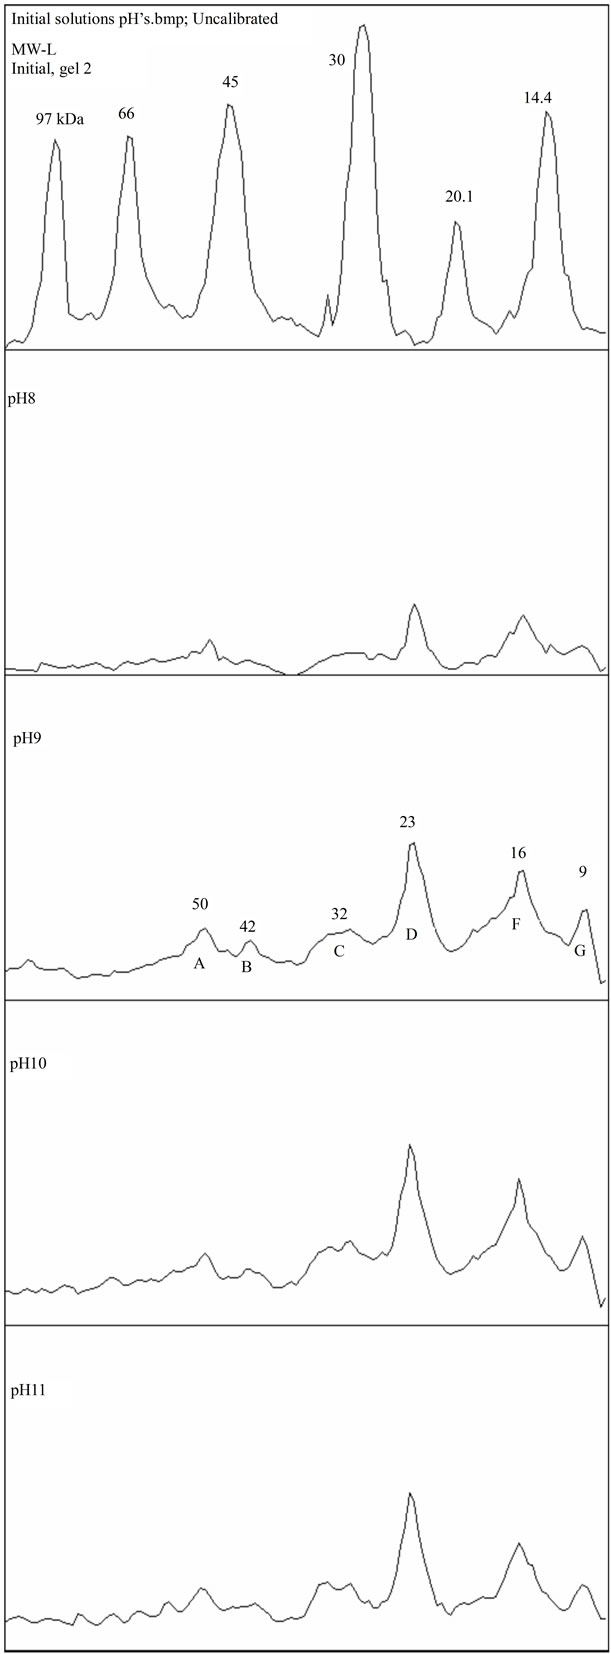
Figure 4. (a) and (b) SDS-PAGE density scan for initial solutions, pH 2 - 11.
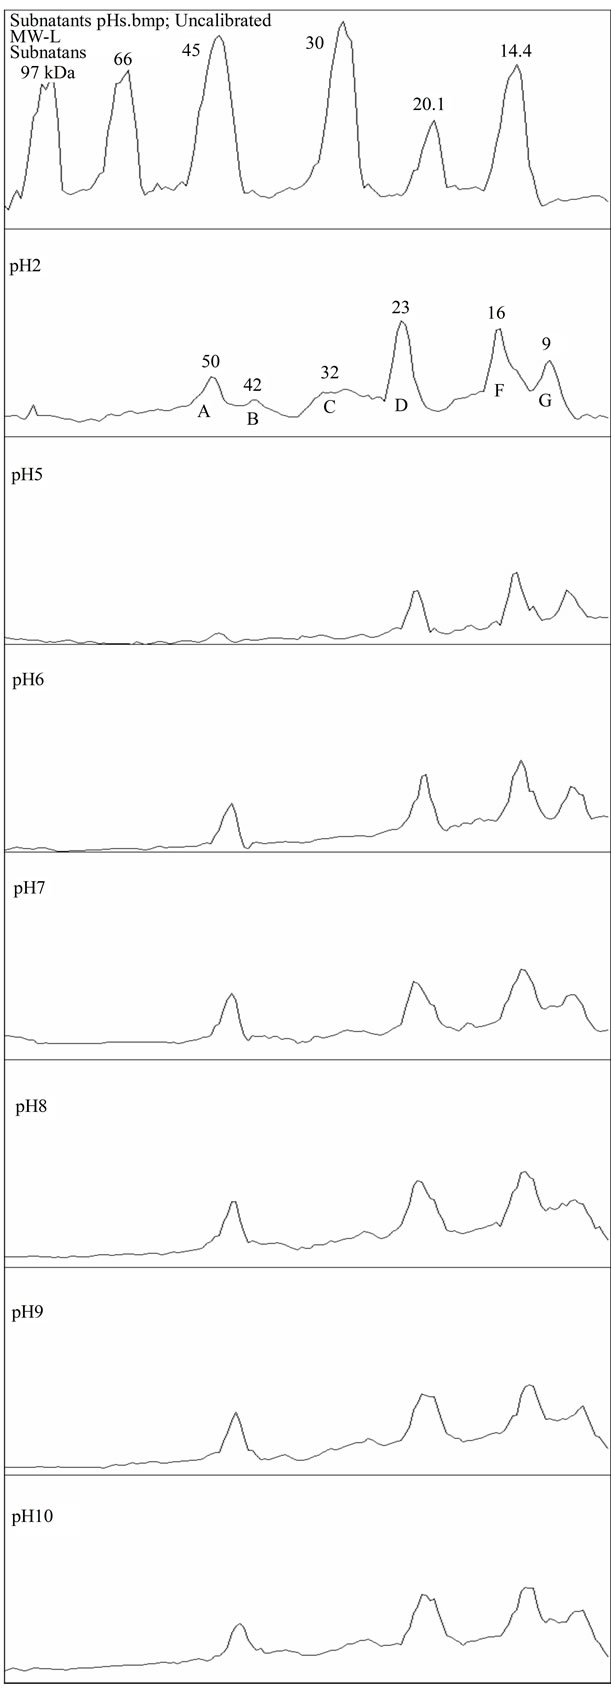
Figure 5. SDS PAGE density scan for subnatants.
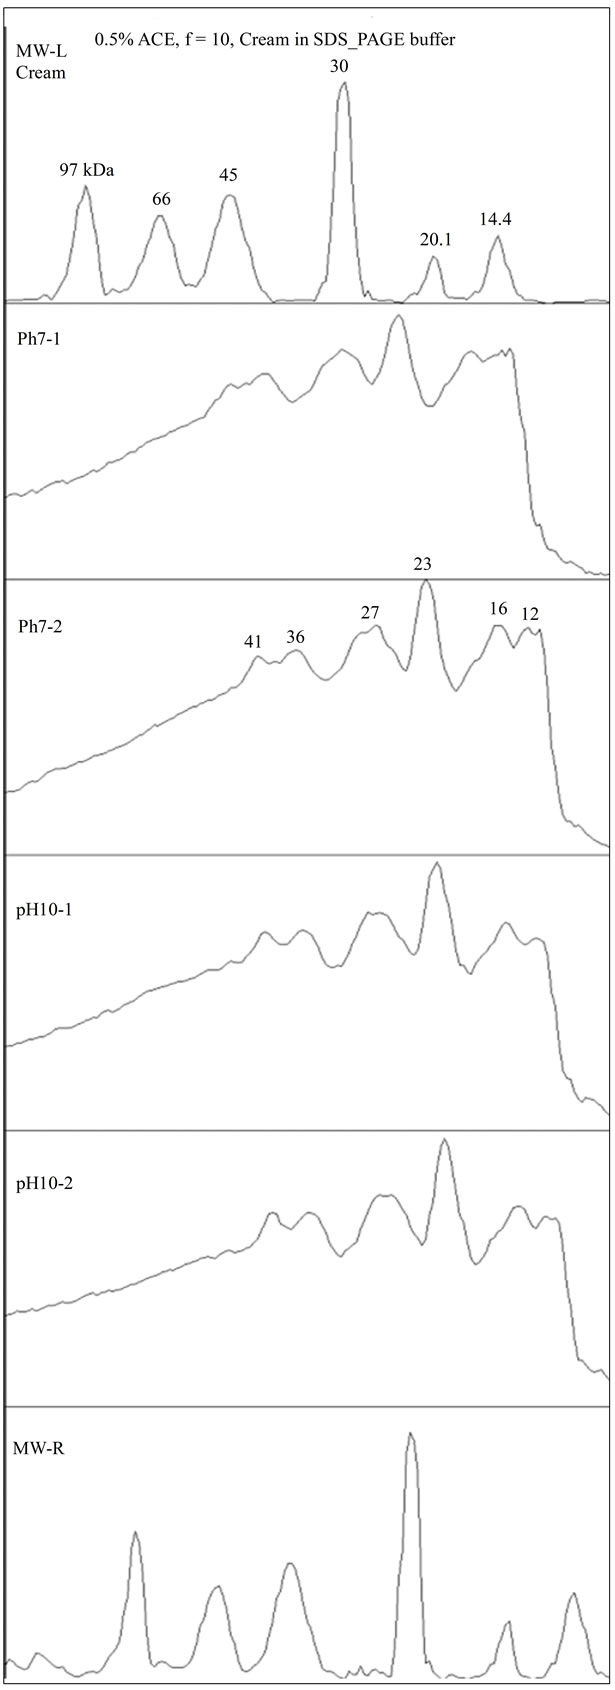
Figure 6. SDS-PAGE density scan for cream.
ples were investigated: the initial solutions, before emulsification, with all available proteins; the cream, consisting of the emulsion droplets carrying the adsorbed proteins and the subnatants, after emulsification, with those not adsorbed either because of excess amount or because of lack of surface hydrophobicity.
Proteins of bands A, B, C and D (approx. 50, 42, 32 and 23 kDa) present in the initial solutions showed to be very sensitive to pH 3 and 4, where they were selectively precipitated, as illustrated in Figures 4(a) and (b). This agrees well with the solubility profile. On the other hand, comparing these bands with the subnatants, Figure 5, it appears that the peaks B and C (42 and 32 kDa, respectively) missing in the subnatants, were the ones completely adsorbed during emulsification and therefore, controlled its extent and effectiveness in stabilizing the droplets. This is also supported by the fact that in the pH range where these proteins were not soluble, emulsification was impossible.
At the pH 2, the protein extract did not perform satisfactory as emulsifying agent. As seen from Figure 4(a)- pH 2, all the bands were present, including the B and C, but the net positive charge was not favorable for effective coverage of the emulsion droplets, as referred in the literature [10].
The analysis of the cream at pH 7 and pH 10, Figure 6, showed that all the bands of the initial solution were present, with the D, as the most prominent band at 23 kDa. However, it seems that this band was not the determinant for emulsification, as it was also available in the initial solution at pH 4, which emulsified poorly.
4. Conclusions
The crude alkaline extract from coconut milk press cake shows acceptable solubility in water, over a wide range of pH, except at the pH 3 - 4, in which approximately 90% of the soluble protein is precipitated.
In addition, even in trace amounts, the APE proteins were able to form O/W emulsion outside the low solubility pH range. Even if the 23 kDa protein was the most prominent in adsorption, the proteins of bands C and B, 32 and 42 kDa respectively, seem to be the most responsible for effective emulsification.
5. Acknowledgements
The author would like to thank SIDA (Swedish International Development Agency) for funding project as well as for the support provided by the Lund University. The project is part of the PhD training of his main author.
REFERENCES
- E. Sironi, F. Sessa and M. Duranti, “A Simple Procedure of Lupin Seed Protein Fractionation for Selective Food Applications,” European Food Research and Technology, Vol. 221, No. 1, 2005, pp. 145-150. doi:10.1007/s00217-005-1151-2
- D. Balasundaresan, R. Sugadev and M. N. Ponnuswamy, “Purification and Crystalization of Coconut Globulin from Cocosnucifera,” Biochimica et Biophysica Acta, Vol. 1601, No. 1, 2002, pp. 121-122. doi:10.1016/S1570-9639(02)00401-6
- A. Iqbal, I. A. Khalil, N. Ateeq and M. S. Khan, “Nutritional Quality of Important Food Legumes,” Food Chemistry, Vol. 97, No. 2, 2006, pp. 331-335. doi:10.1016/j.foodchem.2005.05.011
- FAO, “FAO Statistics,” UNCTAD, 1211 Geneva 10, Switzerland, 2009.
- C. C. Seow and C. N. Gwee, “Coconut Milk: Chemistry and Technology,” International Journal of Food Science and Technology, Vol. 32, No. 1, 1997, pp. 189-201. doi:10.1046/j.1365-2621.1997.00400.x
- B. Chambal, B. Bergensthål and P. Dejmek, “Edible Proteins from Coconut Milk Press Cake; One Step Alkaline Extraction and Characterization by Electrophoresis and Mass Spectrometry,” Food Research International, Vol. 47, No. 2, 2012, pp. 140-151. doi:10.1016/j.foodres.2011.04.036
- J. W. Goodwin, “Colloids and Interfaces with Surfactants and Polymers—An Introduction,” John Wiley & Sons, Ltd, Chichester, 2004. doi:10.1002/0470093919
- P. Wilde, F. Mackie, P. Gunning and V. Morris, “Proteins and Emulsifiers at Liquid Interfaces,” Advances in Colloid and Interface Science, Vol. 108-109, 2004, pp. 63- 71. doi:10.1016/j.cis.2003.10.011
- V. Cabra, R. Arreguin and A. Farres, “Emulsifying Properties of Proteins—Review,” Boletín de la Sociedad Quí- mica de México, Vol. 2, No. 2, 2008, pp. 80-89.
- E. Dickinson, B. S. Murray and G. Stainsby, “Protein Adsorption at Air-Water and Oil-Water Interfaces,” Advances in Food Emulsions and Foams, Elsevier Applied Science, London, 1988, p. 123.
- S. Nakai and E. Li-Chan, “Recent Advances in Structure and Function of Food Proteins: QSAR Approach,” Food Science & Nutrition, Vol. 33, No. 6, 1993, pp. 477-499.
- J. F. Zayas and C. S. Lin, “Emulsifying Properties of Corn Germ Proteins,” Cereal Chemistry, Vol. 66, No. 4, 1989, pp. 263-267.
- E. Onsaard, M. Vittayanont, S. Srigam and D. J. McClements, “Properties and Stability of Oil-in-Water Emulsions Stabilized by Coconut Skim Milk Proteins,” Journal of Agricultural and Food Chemistry, Vol. 53, No. 14, 2005, pp. 5747-5753. doi:10.1021/jf050312r
- E. Onsaard, M. Vittayanont, S. Srigam and D. J. McClements, “Comparison of Properties of Oil-in-Water Emulsions Stabilized by Coconut Cream Proteins with Those Stabilized by Whey Protein Isolate,” Food Research International, Vol. 39, No. 1, 2006, pp. 78-86. doi:10.1016/j.foodres.2005.06.003
- N. Tangsuphoom and J. N. Coupland, “Effect of SurfaceActive Stabilizers on the Microstructure and Stability of Coconut Milk Emulsions,” Food Hydrocolloids, Vol. 22, No. 7, 2008, pp. 1233-1242. doi:10.1016/j.foodhyd.2007.08.002
- N. Tangsuphoom and J. N. Coupland, “Effect of Thermal Treatments on the Properties of Coconut Milk Emulsions Prepared with Surface-Active Stabilizers,” Food Hydrocolloids, Vol. 23, No. 7, 2009, pp. 1792-1800. doi:10.1016/j.foodhyd.2008.12.001
- A. Naik, S. N. Raghavendra and K. S. M. S. Raghavarao, “Production of Coconut Protein Powder from Coconut Wet Processing Waste and Its Characterization,” Applied Biochemistry and Biotechnology, Vol. 167, No. 5, 2012, pp. 1290-1302. doi:10.1007/s12010-012-9632-9
- FOSS, “FOSS Analytical AB User Manual,” Box 70, SE- 263 21 Höganäs, Sweden, 2003.
- M. M. Bradford, “A Rapid and Sensitive Method for the Quantitation of Microgram Quantities of Protein Utilizing the Principle of Protein-Dye Binding,” Analytical Biochemistry, Vol. 72, 1976, pp. 248-254. doi:10.1016/0003-2697(76)90527-3
- PIERCE, PIERCE-©, “Thermo Fisher Scientific Inc,” 2010.
- PhastSystemTM, “User Manual,” 80-1320-15, AE Edition, Amersham Bioscience e AB, Sweden.
- K. S. Kwon and K. C. Rhee, “Emulsifying Capacity of Coconut Proteins as a Function of Salt, Phosphate, and Temperature,” Journal of the American Oil Chemists’ Society, Vol. 73, No. 12, 1996, pp. 1669-1673. doi:10.1007/BF02517970
- A. S. Samson, R. N. Khaund, C. M. Cater and K. F. Mattil, “Extractability of Coconut Proteins,” Journal of Food Science, Vol. 36, No. 5, 1971, pp. 725-728. doi:10.1111/j.1365-2621.1971.tb03289.x
- R. N. Garcia, R. V. Arocena and A. C. Laurena, “11S and 7S Globulins of Coconuts (Cocosnucifera L.). Purification and Characterization,” Journal of Agricultural and Food Chemistry, Vol. 53, No. 5, 2005, pp. 1734-1739. doi:10.1021/jf0402173
- K. P. Das and J. E. Kinsella, “Stability of Food Emulsions: Physicochemical Role of Proteins and Nonprotein Emulsifiers,” Advances in Food and Nutrition Research, Vol. 34, 1990, pp. 81-201. doi:10.1016/S1043-4526(08)60007-8
- K. H. McWatters and M. R. Holmes, “Salt Concentration, pH and Flour Concentration Effects on Nitrogen Solubility and Emulsifying Properties of Peanut Flour,” Journal of Food Science, Vol. 44, No. 3, 1979, pp. 765-769. doi:10.1111/j.1365-2621.1979.tb08496.x
- G. Ramanatham, L. H. Ran and L. N. Urs, “Emulsifying Properties of Groundnut Protein,” Journal of Food Science, Vol. 43, No. 4, 1978, pp. 1270-1273. doi:10.1111/j.1365-2621.1978.tb15285.x
- S. Nakai, L. Ho and A. Helbig, “Relationship between Hydrophobicity and Emulsifying Properties of Some Plant Proteins,” Canadian Institute of Food Science and Technology Journal, Vol. 13, No. 1, 1980, pp. 23-27. doi:10.1016/S0315-5463(80)73297-2
NOTES
*Corresponding author.