Food and Nutrition Sciences
Vol. 3 No. 11 (2012) , Article ID: 24479 , 9 pages DOI:10.4236/fns.2012.311195
Development of a Synbiotic Low-Calorie Beverage Made from Soy and Yacon Extracts
![]()
Department of Food and Nutrition, Faculty of Pharmaceutical Sciences, Sao Paulo State University, Rodovia Araraquara Jaú, Campus Universitário, São Paulo, Brazil.
Email: *cavallinidc@fcfar.unesp.br
Received August 21st, 2012; revised September 21st, 2012; accepted September 30th, 2012
Keywords: Fructooligosaccharides; Physicochemical Properties; Prebiotics; Probiotic Strain; Sensory Properties
ABSTRACT
The objective of this study was to develop a new low-calorie symbiotic beverage made from yacon (prebiotic source) and soy extracts, containing probiotic Bifidobacterium animalis ssp. lactis BB-12. The synbiotic beverage was first produced with a range of sucrose concentrations in order to determine ideal sweetness by an acceptance test using a “just-about-right scale”. Sucrose was then replaced by sucralose or aspartame to produce sugar-free beverages. Characteristics including viable cell numbers, physicochemical properties, sensorial characteristics and fructooligosaccharides content were investigated. The ideal sweetness of the beverages with sucrose, aspartame and sucralose were 7.28%, 0.0486% and 0.0167%, respectively. Sucralose exhibited higher scores in acceptance test and was used to replace sucrose in the low-calorie symbiotic beverage. The synbiotic beverage exhibited counts of Bifidobacterium spp. of 108 CFU·mL−1, sufficient condition to be considered probiotic. The chemical composition of the product was (g/100 g): 2.91 of protein, 1.41 of fat, 2.41 of total carbohydrate; 0.82 of FOS and 148.22 Kj of energy value. The synbiotic beverage developed in this study may be successful in health applications, due to their functional ingredients (soy, probiotic bacteria and yacon prebiotics) that can afford benefits to health or can present disease-preventing properties, beyond their inherent nutritional value. In addition this low-calorie beverage can be consumed by diabetic individuals and people concerned about the ingestion of calories.
1. Introduction
Changes in the present day consumer’s life style have led to a vital change in market trends in the food sector. Increasingly aware consumers are seeking products with greater health benefits [1].
Yacon (Smallanthus sonchifolius) was not widely consumed until the 1980s, when some peculiarities were discovered in its chemical composition that could be beneficial to human health. The sweet potato-like have a high water content, reduced energetic value and, unlikely most tuberous species, which store carbohydrates in the form of starch, yacon has fructooligosaccharide (FOS) as its main reserve carbohydrate, known for its bifidogenic activity [2]. Therefore, the potential uses of yacon for health have been under study, in view of its prebiotic properties [3]. Prebiotics is defined as “selectively fermented ingredients that allow specific changes, both in the composition and/or activity of the gastrointestinal microbiota, that confer benefits upon host well-being and health” [4].
FAO/WHO (2002) [5] recommends adoption of the definition of probiotics as “live microorganisms which when administered in adequate amounts confer a health benefit on the host.” Bifidobacterium spp. is used as a form of probiotic that is thought to have health-promoting properties in humans [6]. Their possible health effects include antimutagenic activity and stimulation of the immune system [7,8].
Prebiotics can be added to foods, or combined with a probiotic to make a synbiotic [9].
Recently it was reported that Lactobacillus acidophillus NRRL-1910, Lactobacillus plantarum NRRL B-4496, and Bifidobacterium bifidum ATCC 15696 were able to ferment yacon tuber FOS [10].
In the current study, yacon and soy extracts were used as the raw material to produce a new potentially synbiotic beverage containing Bifidobacterium animalis subsp. lactis BB-12. We investigated the effect of sweeteners on the acceptability of the new beverage. To this end, the ideal sweetness of sucrose and the artificial sweeteners aspartame and sucralose in the beverage was determined on a “just-about-right” scale. The chosen prototypes were then assessed by sensory analysis. The product considered the best was subjected to physicochemical analyses, viable cell count and assay of inulintype fructooligosaccharides content.
2. Methods
2.1. Beverage Preparation
The potentially synbiotic beverage, soy and yacon aqueous extracts were processed at UNISOJA (Development and Production Unit for Soybean Derivates) in the Food Nutrition Department of the School of Pharmaceutical Sciences, UNESP, Araraquara (SP, Brazil) as described in Rossi et al. [11]. Yacon root was purchased at a local market (Araraquara, São Paulo, Brazil) and yacon extract was prepared as described by Pauly-Silveira et al. [12]. A flow diagram of the beverage manufacturing process is shown in Figure 1.
The standard base consisted of 60% soy extract, 40% yacon extract, 0.14% stabilizer (Recondan-RS®, Minas Gerais, Brazil) and 0.3% gelatin powder (Royal, Kraft Foods, Brasil). The proportion of soy to yacon was based on a previous study carried out in our laboratory, in which response surface methodology was used [12]. Soy and yacon extracts were mixed with stabilizer homogenized for 3 min and heated. Sucrose (União®, Brazil) was added at 50˚C and gelatin powder at 80˚C. The mix was heated to 95˚C, held there for 5 min and left to cool. At 43˚C, a commercial probiotic culture (BB-12®-Probiotic culture-Probio-Tec®, Christian Hansen, São Paulo, Brazil) was added at 0.25 g·L−1. Coconut fruit flavor (83-257-06-7,
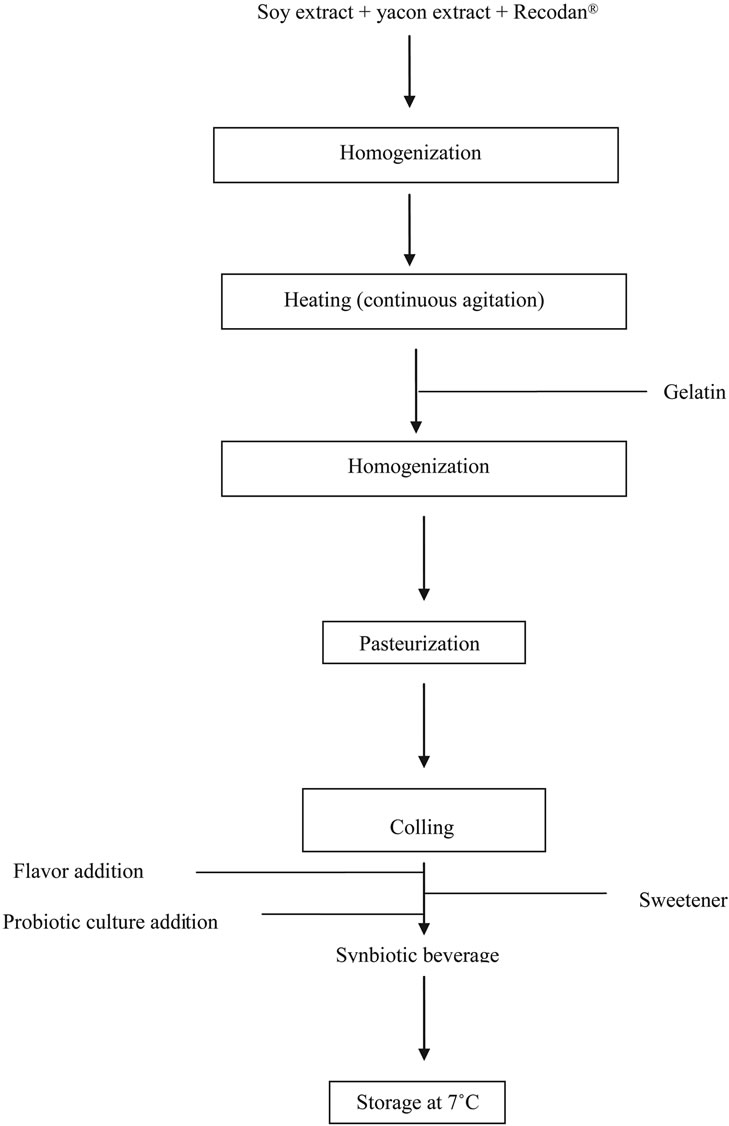
Figure 1. Flow diagram of the synbiotic beverage manufacturing process.
Duas Rodas®, Santa Catarina, Brazil) was added at 0.7 g·L−1. When artificial sweeteners were tested in place of sucrose, aspartame (Lowçucar®, Paraná, Brazil) and sucralose (Splenda®, Tovani Benzaquen, São Paulo, Brazil) were added before the probiotic culture. The inoculated mix was then stored at 7˚C.
2.2. Ideal Sweetness
To determine the ideal sweetness of sucrose, aspartame and sucralose in the beverage, a “just-about-right” scale test was carried out [13]. The samples were sweetened with sucrose at five concentrations (3.0%, 4.5%, 6.0%, 7.5% and 9.0%), with aspartame at six concentrations (0.0304%, 0.0254%, 0.0365%, 0.0438%, 0.0526% and 0.0631%) and with sucralose at six concentrations (0.0085%, 0.0102%, 0.0122%, 0.0147%, 0.0176%, 0.0211%), in order to determine the sweetness considered ideal by the consumers. The central sweetener concentrations tested were based on the ideal sweetness of sucrose and on the published sweetness potency of each sweetness (aspartame = 200; sucralose = 600), with a multiplication factor of 1.2 between the different concentrations [14].
In order to achieve similar conditions during ideal sweetness analysis, samples were prepared and maintained at refrigeration temperature (7˚C) during the sensory assessment. Each sample was coded with a three-digit random number and served randomly to the panelists in individual booths illuminated with incandescent light and maintained at 20˚C at the Sensory Analysis Laboratory at UNESP. Sample presentation was monadic in coded white disposable cups (30 mL) and panelists were also provided with mineral natural water for palate rinsing. Panelists (n = 40, untrained) were asked to rate each sample in terms of how near its sweetness was to ideal, using a nine-point category scale ranging from “extremely sweeter than the ideal” to “extremely less sweet than the ideal”. They were also motivated to express any criticisms on the score sheets used for the sensory evaluation.
Subjective data were transformed into numerical values that corresponded to categories on the scale, so that the category “extremely sweeter than the ideal” was represented by (+4), “extremely less sweet than the ideal” by (−4) and the ideal sweetness corresponded to the value 0. The results were analyzed by simple linear regression between hedonic values and respective sucrose, aspartame and sucralose concentrations. The optimal concentrations of each sweetener in the synbiotic beverage was based on the ideal point (value 0) calculated as the regression line intersection with the concentration axis.
The sweetener potency was defined as the number of times that the compound was sweeter than sucrose, based on the ideal concentrations in the synbiotic beverage.
2.3. Consumer Acceptance Testing
Consumer acceptance testing was conducted on the beverages with the participation of university staff and students (n = 60). The selection criterion was that subjects had to be regular consumers of soy products. The age composition of the panelists was 75% (21 - 35) and 25% (36 - 55), whereas the gender composition was 36% male and 64% female. Samples were presented in the same location as that used to determine the ideal sweetness and in a similar manner regarding the lighting, containers, rinsing water, sample code and presentation order. Consumers were asked to rate each sample in terms of aroma, color, texture, flavor and overall impression, using a nine-point hedonic scale [15]. The sensory scores included: Like extremely = 9, Like very much = 8, Like moderately = 7, Like slightly = 6, Neither like nor dislike = 5, Dislike slightly = 4, Dislike moderately = 3, Dislike very much = 2, Dislike extremely = 1. The panelists were also asked to make some comments/recommendations about the samples on the score sheets used for the sensory evaluation. The beverage that achieved the best level of acceptance in this sensory test was assessed for viable cell numbers, physicochemical properties, and inulin-type fructooligosaccharides (FOS) content. The research was reviewed and approved by the Research Ethics Committee of the Faculty of Pharmaceutical Sciences of Sao Paulo State University (protocol number 21/2007).
2.4. Characteristics of the Potentially Synbiotic Beverage
The number of viable cells of Bifidobacterium animalis subsp. lactis BB-12 per mL of beverage was estimated. Samples were tested before been served. The viable count was determined by plating serial dilutions on Bifidobacterium iodoacetate medium 25 (BIM-25, Probac®, São Paulo, Brasil) and incunbating plates anaerobically at 37˚C for 72 h (Probac®, São Paulo, Brazil) [16].
Beverage composition was analyzed. Moisture, ash, fat, protein, total solids and total carbohydrate were determined by AOAC [17] official methods. Crude protein was determined by the Kjeldahl method, using a conversion factor of 6.25. The FOS content was analyzed by high-performance liquid chromatography (HPLC). For HPLC tests synbiotic beverage (1 g) was diluted with water to 1˚ Brix. The mixture was centrifuged (Sorvall RC 5B Plus centrifuge, Mandel Scientific Company, Guelph, ON, Canada) at 12,879 g for 8 min at 25˚C. The supernatant was filtered through a 0.22 µm Millipore filter prior to being applied to the column. Analyses were performed with a Varian Pró Star 410 HPLC system equipped with two pumps coupled, to a photodiode array detector and autosampler. Samples were injected at room temperature (25˚C) onto a Shim-Pack CLCNH2 column (250 × 4.6 mm, particle size 5 µm). The mobile phase was acetonitrile:water (75:25), flowing at 1.0 mL/min. Glucose, fructose, sucrose, stachiose, raffinose, inulin from dahlia (Dahlia variabilis) and chicory (Cichorium intybus), lactose and maltose (Sigma Chemical Co., St. Louis-Missouri) were used as the standards at 1% (w/v) [18].
From the chemical composition, the energy content (kJ) of the beverage was calculated. Caloric value of the FOS was established as 6.300 kJ·kg−1 [19]. All measurements were carried out in triplicates. The caloric value was calculated using the expression:
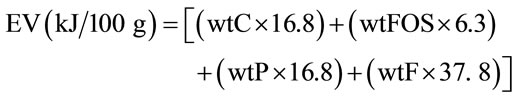
where: EV = Energy value of the synbiotic beverage; %C = percentage of carbohydrate; %FOS = percentage of fructooligosaccharides; %P = percentage of protein; %F = percentage of fat.
The apparent viscosities were determined at 4˚C [20]. With an axial viscometer (Model VT 02, Waake, Brazil). Apparent viscosity was determined on three cups of synbiotic beverage per replication. Three replications were done.
Consistency was measured as the distance (in cm) that the fluid (80 mL) flowed downhill in 10 s in a Bostwick consistometer [20].
The pH of the beverages was measured at 10˚C with a digital pH meter (model Orion 710 AT, Thermoelectro Corporation, USA), after calibrating it with pH 4.0 and 7.0 standard buffers.
2.5. Statistical Analysis
Product acceptability scores were analyzed by one-way analysis of variance (ANOVA), using Instat 3.0 for Windows 95 (GraphPad, San Diego, CA, USA, 1998). Statistical significance was set at p < 0.05.
3. Results and Discussion
3.1. Ideal Sweetness Determination
According to the results, the ideal sweetness of the beverage with sucrose accused at 7.28% sucrose (Figure 2(a)). In a similar study, an ideal sucrose concentration of 10.04% was found for peach nectar [21]. Researchers found an ideal sucrose concentration of 8.0% for reconstituted mango juice to be and 7.5% for mango juice prepared from a commercial pulp [22]. According to Cardoso and Bolini (2007), variations are expected and are probably due to interaction between the sweetener and the product components.
It is important to test sweeteners in different foods and beverages, in order to find the most adequate concentrations when developing “sugar-free” products [21]. From the linear equations for aspartame (Figure 2(b)) and sucralose (Figure 2(c)), the ideal concentrations of aspartame and sucralose in the synbiotic beverage were determined as 0.0486% and 0.0167%, respectively. The equi-sweet concentrations determined for aspartame and sucralose are within the concentration limits allowed by Brazilian legislation [23]. Cardoso and Bolini [21] determined equi-sweet concentrations of aspartame and sucralose in peach nectar equivalent to 10% sucrose, using Magnitude Estimation. They found that the ideal concentration of aspartame and sucralose in the peach nectar were 0.054% and 0.016%, respectively, which determined the that of aspartame as 185 times sweeter than sucrose and potency of sucralose as 629 times sweeter than sucrose. Our data showed that aspartame and sucralose were 150 and 436 times sweeter than sucrose, respectively (Table 1). According to FDA [14], aspartame is 200 times sweeter than sucrose and sucralose is 600 times sweeter than sucrose on average.
Differences in methods utilized to determine equisweet concentration may have influenced the results. This is an important factor: thus, the method using the “just-about-right” scale involved untrained panelists, while in the Magnitude Estimation method the subjects were selected by their discriminative ability and trained. On the other hand, it is important to consider that the sweeteners have particular flavor characteristics in different kinds of food and beverage and also can promote undesirable effects, such as bitterness or aftertastes, which influence the perception of sweetness and product acceptance [21].
As indicated in Figures 2(a)-(c), the linear equations for the sweetness were determined, with coefficients of determination (R2) of 0.9525, 0.9562 and 0.9408 for sucrose, aspartame and sucralose, respectively, which is considered very satisfactory.
3.2. Consumer Acceptance Testing
Knowledge of consumer attitude and preference pattens is required to develop a new product or to improve existing products [24]. For this reason, the new beverage made from yacon and soy extracts containing Bifidobacterium animalis subsp. lactis BB-12, with the addition of sucrose and artificial sweeteners at concentrations initially determined in the present study, was tested for consumer’s acceptability.
Table 2 shows the mean scores for aroma, color, texture, flavor and overall impression of beverages. Consumer testing showed that neither sucrose nor the artificial sweeteners (aspartame and sucralose) significantly affected then beverage aroma. Similar results were observed for color and texture. The samples that were
 (a)
(a)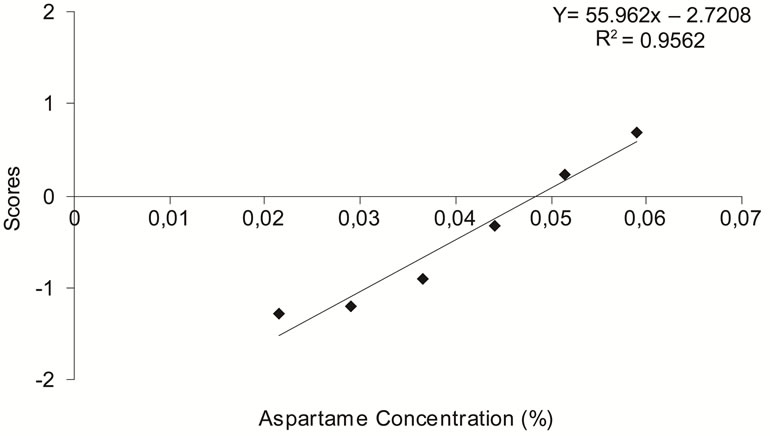 (b)
(b)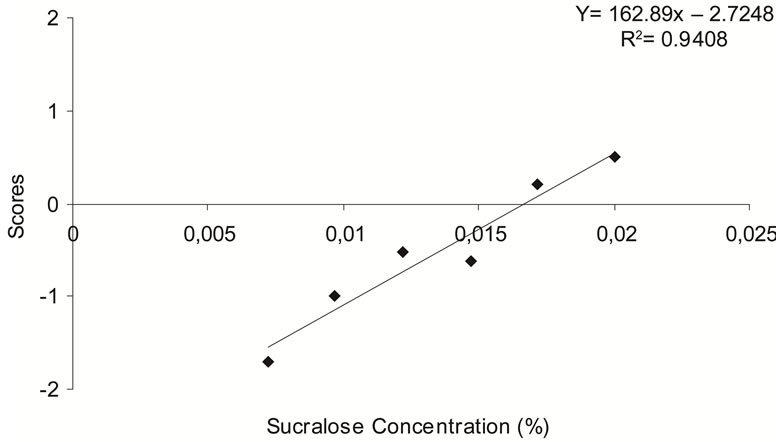 (c)
(c)
Figure 2. Determination of ideal sweetening in a synbiotic beverage, for (a) sucrose, (b) aspartame, (c) sucralose, from results of a panel test using a “just-about-right” scale plotted against concentration.
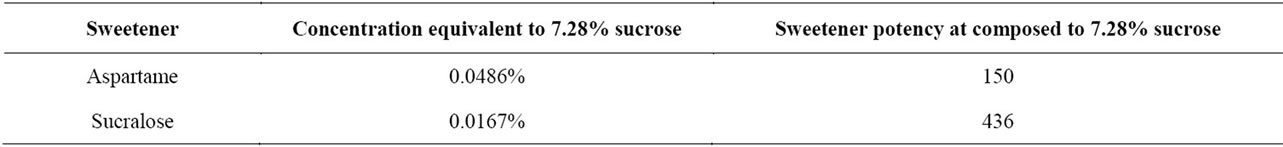
Table 1. Equi-sweet concentration and potency of the sweeteners, corresponding to the 7.28% sucrose concentration.
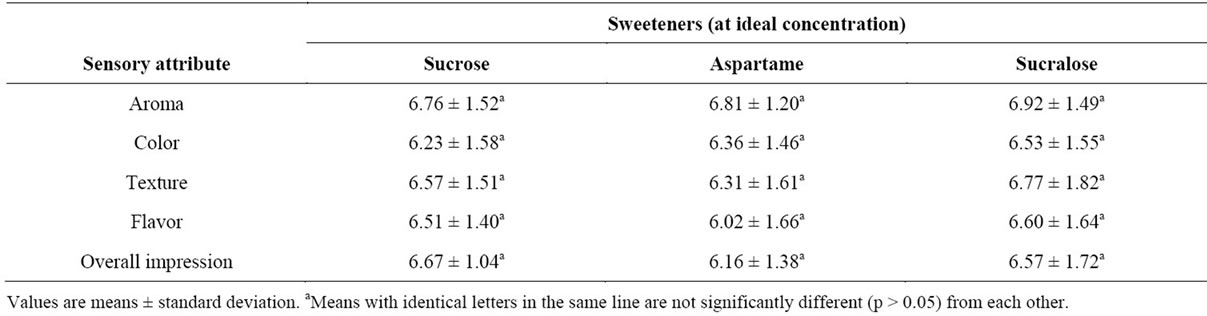
Table 2. Effects of sweeteners on the sensory acceptance.
sweetened with sucralose received the highest scores for flavor but were not significantly different from the samples with sucrose or aspartame. Beverage sweetened with aspartame was rated by 8% of the panelists as having “aftertaste attributes” (data not shown), but it seems that the aftertaste did not affect the overall impression of the beverage, since no differences (p > 0.05) existed among samples sweetened with sucrose, aspartame and sucralose. It should be noted that, although the scores attributed to the beverage sweetened with aspartame suggest that it was the least preferred, this sweetness had no clear effect on the sensory profile of the product demonstrating its inferiority.
Given that no sensory differences between sweeteners were noted in any of the samples, the beverage sweetened with sucralose was chosen for the detailed characterization. This choice has the advantage that sucralose has no calories, making this a sugar-free product.
3.3. Characteristics of the Synbiotic Beverage
The Bifidobacterium spp. count is reported in Table 3. The beverage exhibited counts of 108 CFU·mL−1 or 1010 CFU per 100 mL of product, which is a necessary condition for a product to be considered probiotic. It is reported that probiotic products demand a minimum of between 109 and 1010 CFU/100 mL of product for the intestinal counts to range between 106 and 107 CFU/g [25]. Although little is known about the effective dose for particular strains, high numbers of viable bacteria are recommended for efficacy of probiotic foods [26].
The beverage had a pH of 6.55. Saarelaa et al. [27] investigated the stability of freeze-dried Bifidobacterium animalis ssp. lactis BB-12 cells in fruit juice and low-fat milk and concluded that the acid pH (3.7) of fruit juice, compared to fairly neutral milk (6.6 - 6.7), was probably the most important determinant of the poor probiotic viability in the fruit juice. The authors argued that it is known that bifidobacteria are generally sensitive to pH values below 4.6, although B. animalis strains are clearly more acid resistant than the strains of other Bifidobacterium species. Thus, our results indicate that the neutral
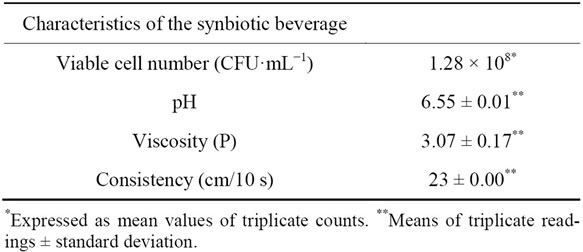
Table 3. Viability and physicochemical characteristics of the synbiotic beverage.
pH (6.55) of the beverage may prevent the decline of the bifidobacterial population.
In the present study, the rheological tests showed that the beverage exhibited a consistency of 23 cm/10 s and viscosity of 3.07 ± 0.17 P.
Chemical composition of the beverage is presented in Table 4. The product contained 92.9% of moisture and showed 7.2% of total solids. Protein and fat contents were 2.9% and 1.42%, respectively. The ingestion of 200 mL of the synbiotic product would be sufficient to provide 17.1% and 11.6% of the daily protein recommended for adults and children (7 - 10 years of age) [28].
Total carbohydrate was 2.4% and content of FOS was 0.82%. Hence the product under study, if consumed in a quantity of 200 mL/day, would provide, on average, 1.6 g of FOS, a value that, in principle, seems low compared with the recommendations of some researches. Thus, according to Douglas and Sanders [29], the daily dose for most health benefits ranges from 3 g for short-chain fructooligosaccharides to 8 g for mixed shortand longchain inulin. However, Bouhnik et al. [30] found that short-chain fructooligosaccharides, soybean oligosaccharides, galactooligosaccharides, and type III resistant starch measurably raised fecal counts of Bifidobacterium species at reasonable doses ranging from 2.5 to 5 g/day, within 7 days of administration.
By compiling currently available data in humans, Roberfroid [31] concluded that the daily dose of a prebiotic does not correlate with the magnitude of the bifidogenic response. Recently, the researcher proposed a
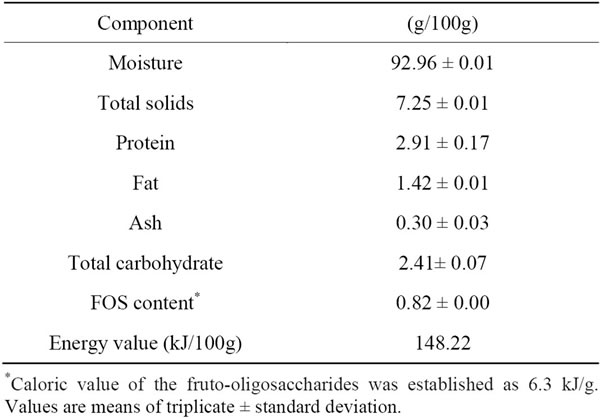
Table 4. Chemical composition of the synbiotic beverage.
“prebiotic index” defined as “the increase in bifidobacterias, expressed as the absolute number (N) of “new” CFU/g of feces (E), divided by the daily dose (in grams) of prebiotic ingested (A), suggesting that the daily dose of the prebiotic is not a determinant of the bifidogenic effect, but that the major factor that quantitatively controls the prebiotic effect is the number of bifidobacteria per gram of feces the individuals has before supplementation of the diet with the prebiotic begins [32]. Moreover, studies suggest that substrate specificity may be important in considering prebiotic products and dose levels [29]. On the other hand, it is noteworthy that, according to Brazilian legislation, when the portion of a needy-to-eat product provides at least 1.5 g of FOS, it is permitted to use the following claim: “The fructooligosaccharides—FOS help the balance of intestinal flora”, thought it should be emphasized: “When consumption is associated with a balanced diet and healthy living habits” [23]. It is also important to mention that studies with prebiotics usually deal with the addition of the isolated compound the diet (addition of FOS or inulin), whereas the proposal of this study is to provide a synbiotic food, in which the prebiotic is naturally raw material.
Based on the chemical composition, the energy value of the synbiotic beverage is presented in Table 4. The product was expected to be a low-calorie food source (134 kJ/100 g), since yacon has a low calorie content [33]. Moreover, beverage was sweetened with sucralose. The consumption of low-calorie food sources may have a beneficial effect on the control and prevention of obesity, which is rapidly become a worldwide epidemic and is a major contributor to the increased incidence of cardiovascular disease, diabetes, hypertension and certain forms of cancer [34-36].
4. Conclusion
In summary, results indicate that a beverage made from yacon and soy extracts can be considered a suitable food for the delivery of a probiotic strain of Bifidobacterium probiotic bacterial strain as well as being of interest as a source of prebiotic FOS (1.6 g/200 mL). The potentially synbiotic beverage had acceptable sensory characteristics and it is important to emphasize that thus beverage may provide the additional benefits of a sugar-free and low-calorie food source (1482.2 kJ·kg−1). Finally, such a synbiotic combination may be successful in health applications.
5. Acknowledgements
We would like to thank the Fundação de Amparo à Pesquisa do Estado de São Paulo (FAPESP) for financial support.
REFERENCES
- B. Renuka, S. G. Kulkarni, P. Vijayanand and S. G. Prapulla, “Fructooligosaccharide Fortification of Selected Fruit Juice Beverages: Effect on the Quality Characteristics,” Food Science and Technology, Vol. 42, No. 5, 2009, pp. 1031-1033.
- I. Santana and M. H. Cardoso. “Yacon Tuberous Root (Smallanthus sonchifolius): Cultivation Potentialities, Technological and Nutritional Aspects,” Ciência Rural, Vol. 38, No. 3, 2008, pp. 898-905. doi:10.1590/S0103-84782008000300050
- F. P. P. Alvarez, T. B. Jurado, C. M. Calixto, V. N. Incio and A. J. Silva, “Prebiotic Inulin/Oligofructose in Yacon Root (Smallanthus sonchifolius), Phytochemistry and Standardization as Basis for Clinical and Pre-Clinical Research,” Revista de Gastroenterología del Peru, Vol. 28, No. 1, 2008, pp.22-27.
- G. R. Gibson, H. M. Probert, J. Van Loo, R. A. Rastall and M. R. Roberfroid, “Dietary Modulation of the Human Colonic Microbiota: Updating the Concept of Prebiotics,” Nutrition Research Reviews, Vol. 17, No. 2, 2004, pp. 259-275. doi:10.1079/NRR200479
- FAO/WHO (Food and Agriculture Organization/World Health Organization), “Guidelines for the Evaluation of Probiotics in Food. Report of a Joint FAO/WHO Working Group on Drafting Guidelines for the Evaluation of Probiotics in Food,” London Ontario, 30 April-1 May 2002.
- I. Trebichavsky, V. Rada, A. Splichalova and I. Splichal, “Cross-Talk of Human Gut with Bifidobacteria,” Nutrition Reviews, Vol. 67, No. 2, 2009, pp. 77-82. doi:10.1111/j.1753-4887.2008.00141.x
- J. Ezendam, A. Klerk, E. R. Gremmer and H. Van Loveren, “Effects of Bifidobacterium animalis Administered during Lactation on Allergic and Autoimmune Responses in Rodents,” Clinical & Experimental Immunology, Vol. 154, No. 3, 2008, p. 424-443. doi:10.1111/j.1365-2249.2008.03788.x
- M.-L. Hsieh, P.-R. Lo, R.-C. Yu and C.-C. Chou, “Changes of Mutagenicity and Antimutagenicity of the Lactic Fermented Soymilk after Exposure to Acid, Bile Salt and Heating,” Journal of the Science of Food and Agriculture, Vol. 88, No. 11, 2008, pp. 900-1904. doi:10.1002/jsfa.3292
- J. M. T. Hamilton-Miller, “Probiotics and Prebiotics in the Elderly,” Postgraduated Medical Journal, Vol. 80, 2004, pp. 447-451. doi:10.1136/pgmj.2003.015339
- R. Pedreschi, D. Campos, G. Noratto, R. Chirinos, L. A. Cisneros-Zevallos, “Yacon Root (Smallanthus sonchifolius Poepp. Endl) Fructooligosaccharides as a Potencial Novel Source of Prebiotics,” Journal of Agricultural and Food Chemistry, Vol. 51, No. 18, 2003, pp. 5278-5284. doi:10.1021/jf0344744
- E. A. Rossi. “Development of a Novel Fermented Soymilk Product with Potential Probiotic Properties,” European Food Research and Technology, Vol. 209, No. 5, 1999, pp. 305-307. doi:10.1007/s002170050499
- N. D. Pauly-Silveira, R. Bedani, D. C. U. Cavallini, M. S. J. Manzoni, D. P. Miguel, D. Borsato and E. A. Rossi, “Optimization of a Synbiotic Formulation of Soy Yoghurt Containing Yacon Extract by Response Surface Methodology,” International Journal of Probiotics Prebiotics, Vol. 5, 2010, pp. 211-216.
- H. T. Lawless and H. Heymann, “Sensory Evaluation of Food,” Aspen Publitions,Gaythesburg, 1999, p. 827.
- FDA (Food and Drug Administration), “Artificial Sweeteners: No Calories ··· Sweet!” 2006. http://www.fda.gov/fdac/features/2006/406_sweeteners.html
- H. Stone and J. L. Sidel. “Sensory Evaluation Practices,” Academic Press Inc, New York, 1993.
- F. J. Muñoa and R. Pares, “Selective Medium for Isolation and Enumeration of Bifidobacterium spp.,” Applied and Environmental Microbiology, Vol. 54, No. 7, 1988, pp. 1715-1718.
- AOAC (Association of Official Analytical Chemists), “Official Methods of Analysis,” 17th Edition, AOAC, Arlington, 1995.
- C. Vidal-Valverde, J. Frias and S. Valverde, “Changes in Carbohydrate Composition of Legumes after Soaking and Cooking,” Journal of the American Dietetic Association, Vol. 93, No. 5, 1993, pp. 547-550. doi:10.1016/0002-8223(93)91814-7
- M. B. Roberfroid, “Caloric Value of Inulin and Oligofructose,” Journal of Nutrition, Vol. 129, No. 7, 1999, pp. 1436S-1437S.
- E. A. Rossi, J. B. Faria, D. Borsato and F. L. Baldochi, “Otimização de um Sistema Estabilizante Para o Iogurte de Soja,” Brazilian Journal of Food and Nutrition, Vol. 2, No. 1, 1990, pp. 83-92.
- J. M. P. Cardoso and H. M. A. Bolini, “Different Sweeteners in Peach Nectar: Ideal and Equivalent Sweetness,” Food Research International, Vol. 40, No. 10, 2007, pp. 1249-1253. doi:10.1016/j.foodres.2007.08.004
- D. C. U. Cavallini, D. C. Garcia and H. M. A. Bolini, “Measurement of the Relative Sweetness of Aspartame, Cyclamate/Sacharin Blend, Stevia, Extract and Sucralose as Compared to Sucrose at Different Concetrations in Mango Juice,” Alimentaria-Espanha, Vol. 368, 2005, pp. 106-110.
- ANVISA (Agência Nacional de Vigilância Sanitária), “Resolução—RDC No. 3 (2 January 2001): The Technical Rule that Approves the Addition of Sweetness to Foods and Regulates Their Maximum Legal Concentration,” 2011. http://www.anvisa.gov.br
- J. F. Meullenet, R. Xiong, M. A. Monsoor, T. Bellman-Homer, P. Dias, S. Zivanovic, H. Fromm and Z. Liu, “Preference Mapping of Commercial Toasted White Corn Tortilla Chips,” Journal of Food Science, Vol. 67, No. 5, 2002, pp. 1950-1957. doi:10.1111/j.1365-2621.2002.tb08751.x
- W. P. Charteris, P. M. Kelly, L. Morelli and J. K Collins, “Ingredient Selection Criteria for Probiotic Microorganisms in Functional Dairy Foods,” International Journal of Dairy Technology, Vol. 51, No. 4, 1998, pp. 123-136. doi:10.1111/j.1471-0307.1998.tb02516.x
- C. Stanton, R. P. Ross, G. F. Fitzgerald and D. V. Sinderen, “Fermented Functional Foods Based on Probiotics and Their Biogenic Metabolites,” Current Opinion Biotechnology, Vol. 16, No. 2, 2005, pp. 198-203. doi:10.1016/j.copbio.2005.02.008
- M. Saarelaa, I. Virkajärvia, H.-L. Alakomia, P. SigvartMattilab and J. Mättö, “Stability and Functionality of Freeze-Dried Probiotic Bifidobacterium Cells during Storage in Juice and Milk,” International Dairy Journal, Vol. 16, No. 12, 2006, pp. 1477-1482. doi:10.1016/j.idairyj.2005.12.007
- IOM (Institute of Medicine), “Food and Nutrition Board. Dietary Reference Intakes,” National Academic Press, Washington DC, 1999-2001.
- L. C. Douglas and M. E. Sanders, “Probiotics and Prebiotics in Dietetics Practice,” Journal of the American Dietetic Association, Vol. 108, No. 3, 2008, pp. 510-521. doi:10.1016/j.jada.2007.12.009
- Y. Bounik, L. Raskine, G. Simoneau, E. Vicaut, C. Neut, B. Flourie, F. Brouns and F. R. Bournet, “The Capacity of Nondigestible Carbohydrates to Stimulate Fecal Bifidobacteria in Healthy Humans: A Double-Blind, Randomized, Placebo-Controlled, Parallel-Group, Dose-Response Relation Study,” American Journal of Clinical Nutrition, Vol. 80, No. 6, 2004, pp.1658-1664.
- M. B. Roberfroid, “Introducing Inulin-Type Fructans,” British Journal of Nutrition, Vol. 93, Suppl. 1, 2005, pp. 13S-25S. doi:10.1079/BJN20041350
- M. B. Roberfroid, “Prebiotics: The Concept Revisited,” Journal of Nutrition, Vol. 137, No. 3, 2007, pp. 830S- 837S.
- M. Geyer, I. Manrique, L. Degen and C. Beglinger, “Effect of Yacon (Smallanthus sonchifolius) on Colonic Transit Time in Healthy Volunteers,” Digestion, Vol. 78, No. 1, 2008, pp. 30-33. doi:10.1159/000155214
- R. Brawer, N. Brisbon and J. Plumb, “Obesity and Cancer,” Prim Care: Clinics in Office Practice, Vol. 36, No. 3, 2009, pp. 509-531. doi:10.1016/j.pop.2009.04.005
- A. S. Greenberg and M. S. Obin, “Obesity and the Role of Adipose Tissue in Inflammation and Metabolism,” American Journal of Clinical Nutrition, Vol. 83, No. 2, 2006, pp. 461-465.
- H. M. Tan, A. L. Gundlach and M. J Morris, “Exaggerated Feeding Response to Central Galanin-Like Peptide Administration in Diet-Induced Obese Rats,” Neuropeptides, Vol. 39, No. 3, 2005, pp. 333-336. doi:10.1016/j.npep.2004.12.025
NOTES
*Corresponding author.