Food and Nutrition Sciences
Vol. 2 No. 8 (2011) , Article ID: 7884 , 6 pages DOI:10.4236/fns.2011.28113
Comparison of Fatty Acid Composition between Farmed and Wild Indian White Shrimps, Fenneropenaeus indicus
![]()
Department of Fisheries, Sari Agricultural Sciences and Natural Resources University, Sari, Iran.
Email: hoseinoraji@yahoo.com
Received June 28th, 2011; revised August 9th, 2011; accepted August 16th, 2011.
Keywords: Farmed Shrimp, Wild Shrimp, Fatty Acids, Composition, Fenneropenaeus indicus
ABSTRACT
The aim of this study is comparison of fatty acid profile between wild and farmed Indian white shrimps. According to the score-plot produced by the principle component analysis the wild Indian white shrimp showed a fatty acid composition clearly different from the farmed Indian white shrimp. In both groups, palmitic acid (16:0) and oleic acid (18: 1n-9) were the main SFA and MUFA, respectively. Based on results, the wild shrimp contained a higher level (P < 0.05) of n-3 poly unsaturated fatty acids, whereas farmed shrimp contained a high level of n-6 poly unsaturated fatty (P < 0.05). Arachidonic acid (20: 4n-6), eicosapentaenoic acid (20: 5n-3) and docosahexaenoic acid (22: 6n-3) were significantly higher in wild shrimps. The n-3/n-6 fatty acids ratio was significantly higher in wild shrimps (P < 0.05). The comparison demonstrated that the nutritional value of wild shrimps is better than farmed shrimp and fatty acid profile of commercial diets should be reformed in order to maintenance of farmed shrimps nutritional value.
1. Introduction
Seafood consumption has been increasing with global population growth. These foods not only can prevent cardiovascular diseases (CVD) and cancer [1], but also can develop nervous system and support brain activities because of their high levels of HUFA n-3 fatty acids[2]. Penaidae shrimps are very important in tropical and subtropical fisheries and aquaculture [3], According to FAO statistics, total shrimp global production was about 6.5 million tones which half of this achieved by capture [4]. To meet market demands shrimps culture must increase because natural resources has limited capacity and cannot supply global demands by itself any longer.
Fenneropenaeus indicus was the main species of penaidae shrimps which cultured in Islamic republic of Iran [5]. In culture condition, shrimps are mostly fed by formulated diets which are certainly different to natural foods. Fatty acid profile of shrimps muscle completely depends on food source and maintenance of the profile specially HUFA n-3 and their balance in muscle tissue is vital in shrimps feeding and then social health, So awareness about farmed shrimp fatty acid profile and its comparing with wild shrimps (as a natural criteria) would give us more information about shrimp’s nutrition. The aim of the study is detecting of fatty acid differences between wild and farmed Indian white shrimp, Fnneropenaeus indicus.
2. Material and Method
2.1. Samples Supply
Two populations of Fenneropenaeus indicus, farmed and wild, were used in this experiment. Farmed population, which were fed by routine formulated ration, was provided from Gomishan shrimp ponds (located in Golestan province, Iran) in September. The fatty acid profile of the formulated diet is given in Table 1. The average weight of provided shrimps was 14 ± 0.8 gram and Water temperature and pH were 28.5˚C ± 1˚C and 7.9 ± 0.2, respectively during capture time. Wild shrimps were captured from Persian Gulf (Hormozgan province) using trawl fishing method in September when the local water temperature was 30˚C ± 1˚C. Captured shrimps weight was 15 ± 1.1 gr.
2.2. Samples Preparing
After providing, samples immediately were washed by clean water, deheaded, peeled and transfer-red into Ice
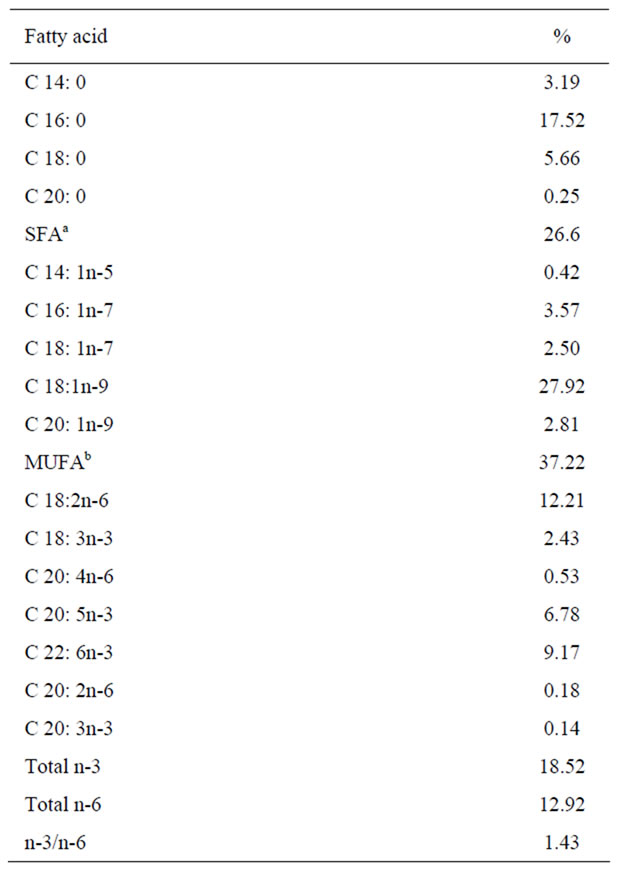
Table 1. Fatty acid composition (% of total fatty acids) of formulated feed used for farmed shrimp feeding.
bags to laboratory where they were stored at –20˚C freezers for a short time before starting fatty acid analysis.
2.3. Fatty Acid Analysis
In this study, seven replicates were set up at each treatment (population). Fatty acid analysis of shrimp muscle tissue was conducted using the direct methyl-esterification method [6]. In this method, material is prepared by homogenization and transmethylation followed by extraction of the methylesters of fatty acids as a combined single step. 500 mg of wet sample was placed into a 35 ml capped pyrex test tube and then 5 ml ethanol-toluene (3:2 v/v) was added. A 0.1 ml internal standard (containing 4.8 mg·ml–1 22:2n-6 fatty acid dissolved in isooctane) and 5 ml acetyl chloride-methanol (1:20, v/v) as an esterification agent were added to the aforementioned sample. The test tubes were sealed under nitrogen gas atmosphere. The solutions were then mixed using a vortex for 30s. Test tubes were placed in a water bath at 100˚C for 1 h with frequent shaking while keeping the caps tight. After cooling 5 ml distilled water and 5 ml hexane were added, then centrifuged at 3000 rpm for 5 min. The upper layer (hexane) in the test tube was withdrawn using a Pasteur pipette into a new test tube and the remainder was centrifuged twice more upon adding 3 ml hexane to ensure that all the fatty acids were completely extracted. The contents of each test tube were passed through sodium sulfate and transferred to a pre-weighted vessel. The solvent was separated at 35˚C under vacuum and a nitrogen gas atmosphere. The residual material was reweighed. The methyl esters in each tube had 0.5 ml isooctane added and were transferred into 2 ml vials and kept in a freezer (–30˚C). For gas chromatographic analysis, the sample was diluted with isooctane so that each final solution contained 2 ml methyl ester. A 0.4 µl of the above sample was injected to a gas chromatograph (DANI 1000, Milan, Italy) equipped with a split injecttor (split ratio 1:50) and a flame ionization detector. Finally the amount of fatty acid was estimated by compareing its peak area and that of the internal standard. A capillary gas chromatograph (DANI 1000, Milan, Italy) fitted with a fused-silica capillary column (Econo-Cap EC- 1000, Alltech, Deerfield, IL, USA; 30 m length, 0.25 mm internal diameter and 25 µm film thickness) with helium as a carrier gas. Injection and detector temperature were set at 250˚C and 280˚C, respectively the oven temperature was programmed to increase from an initial temperature of 15˚C at a rate of 30˚C·min–1, to 180˚C at 3˚C·min–1, then from 180˚C to 220˚C at 1˚C·min–1, and held at 220˚C for 10 min.
2.4. Statistical Analysis
All statistical analysis was conducted using SPSS program, version 14. Student’s t-test was performed to determine differences between treatments at a significant level of 0.05. Data are presented as mean ± standard deviation (SD). Principle component analysis (PCA) has been performed on fatty acids for differentiation between farmed and wild Indian white shrimp.
3. Results and Discussion
Principle component analysis (PCA) on the fatty acid data from the farmed and wild Indian white shrimp muscle produced two principal components, explaining 76.32% of the variance in the data matrix. According to the score-plot produced by the principal components (Figure 1) the wild Indian white shrimp showed a fatty acid composition clearly different from the farmed Indian white shrimp. The loading-plot (Figure 2) showed that the contents of 20:5n-3 and 22:6n-3 was important to distinguish the wild shrimp muscle fatty acids from the farmed shrimp muscle.
The fatty acid profile of muscle in farmed and wild Indian white shrimp are presented in Table 2. Results indicated that there are no significant differences between
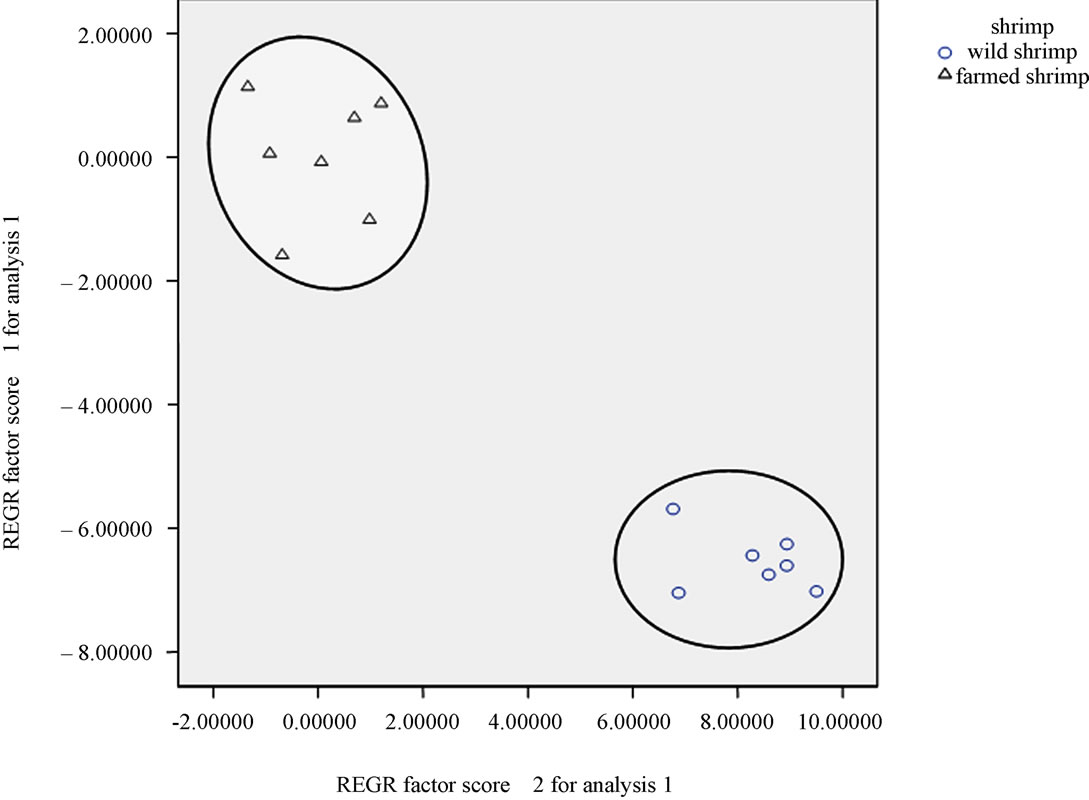
Figure 1. PC—plot of the wild and farmed Indian white shrimp based on their fatty acid composition.
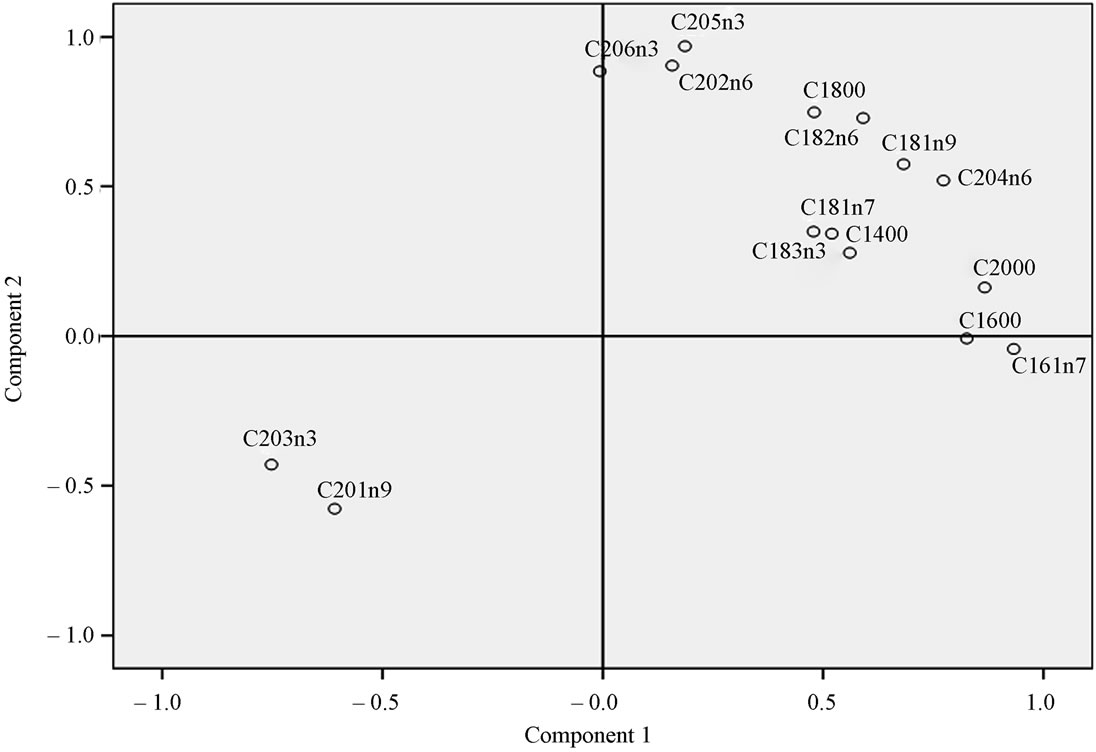
Figure 2. Loading-plot of the wild and farmed Indian white shrimp based on their fatty acid composition.
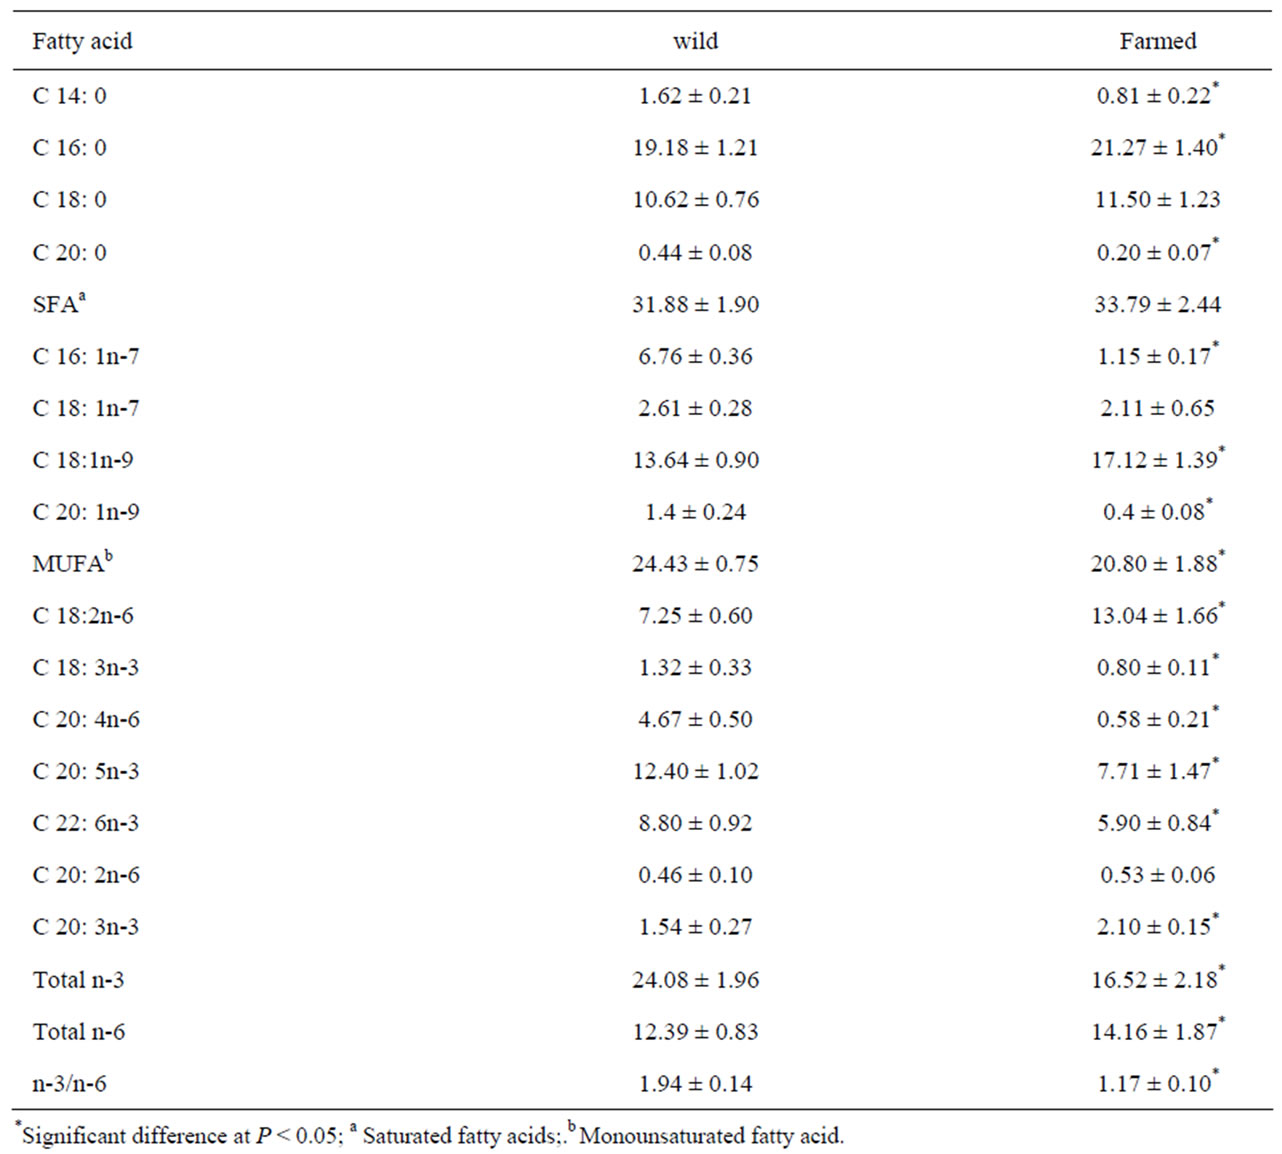
Table 2. Fatty acid composition (% of total fatty acids) in the lipid of shrimps muscle tissue from wild and farmed shrimps.
wild and farmed shrimps in 18:0, 18: 1n-7, 20: 2n-6 (P > 0.05). According to the results, in both groups, saturated fatty acids (SFA) percentage was higher than monounsaturated fatty acids (MUFA) and other fatty acids, and also palmitic acid (16:0) was the main SFA in both groups. SFA intake, which its main source is animal fats and red meat, increases CVD risk via increasing low density lipoprotein (LDL) cholesterol concentration [7-9]. In spite of this fact that SFA in farmed shrimps was higher than wild one but there was no significant difference between this two groups.
Oleic acid (18:1n-9) was the main MUFA in both groups but its amounts in farmed shrimps (17.12 ± 1.39) was more than wild shrimp (13.64 ± 0.90), other MUFA percentages in wild shrimps were higher than farmed shrimp. Based on results, the wild shrimp contained a higher level (P < 0.05) of n-3 poly unsaturated fatty acids (24.08 ± 1.96), whereas farmed shrimp contained a high level of n-6 poly unsaturated fatty (14.16 ± 1.87) (P < 0.05). Studies demonstrated that MUFAs as well as PUFAs cause reduction of total and LDL cholesterol [7,8], and result in positive reduction of blood pressure [9], but this effect in PUFAs is stronger than MUFAs [7]. According to this study nutritional value of wild shrimps, because of having more MUFAs and PUFAs, is higher than farmed shrimp and partially is useful in prevention of CVD.
Linoleic (LA): linolenic acid (ALA) ratio is very important in human diet. LA (18: 2n-6) and ALA (18: 3n-3) are the most important n-6 and n-3 PUFAs which can convert to 20 and 22 carbons fatty acids [10,11]. In human body, LA can convert to arachidonic acid (ARA) and also ALA to eicosapentaenoic acid (EPA) and docosahexaenoic acid (DHA). There is a competition between these two fatty acids on desaturase enzymes. Although desaturase enzymes prefer n-3 fatty acids, LA (n-6) intake can have a negative effect on ALA conversion [10]. In current study, farmed shrimps had large amount of LA as a compare with wild one, and LA: ALA ratio in farmed shrimps is much more than the other group which is not so recommended for human nutrition.
Highly unsaturated fatty acids (HUFA) levels including 20:4n-6 (ARA), 20:5n-3 (EPA) and 22:6n-3 (DHA), in wild shrimps (4.67 ± 0.50, 12.40 ± 1.02 and 8.80 ± 0.92, respectively) were significantly higher than farmed shrimps (P < 0.05), and also n-3/n-6 ratio is significantly higher in wild shrimps (1.94 ± 0.14) (P < 0.05). It seems linoleic acid (18:2n-6) in farmed shrimps (13.04 ± 1.66) and EPA (20:5n-3) in wild shrimps (12.40 ± 1.02) are the main polyunsaturated fatty acids (PUFA).
American heart association (AHA) recommended at least 2 serving consumption of oily fish (which is rich of HUFA n-3) per week and also consumption of at least 0.5 - 1.8 gram/day EPA+ DHA to heart patients [12]. National institute for health and clinical excellence (NICE) recommended miyocard infarction following patients should intake at least 7 gram n-3 FA via fishes per week [11]. Mentioned recommendations showed that seafood consumption is very useful. High unsaturated fatty acids (HUFAs) such as EPA, DHA (n-3) and ARA (n-6) play a key role in prevention of CVD and can develop nervous system (especially HUFA n-3) [2]. Because conversion process occurs too slow in human body, major part of this fatty acids must entered via daily diets. In current study, farmed shrimps because of low levels of EPA, DHA and total n-3 and high levels of n-6 fatty acids have less nutritional value in prevention of CVD than wild one.
In addition to HUFA n-3 another key factor in human nutrition is n-6/n-3 ratio. AHA recommends n-6/n-3 the ratio should be about 1 [12], but this ratio is about 16.74 in US and about 15 in UK and northern Europe but in some countries where seafood consumption is very high this ratio is about 4 [10], unfortunately authors could not collect any formal data to compare. In wild shrimps n-3 percentage was about two times more n-6’s and in farmed one this ratio was about 1. Wild shrimp consumption because of high levels of n-3 fatty acids can reduce this ratio and would be more suitable for human nutrition.
4. Conclusions and Comments
According to this study, wild shrimps, because of higher amounts of EPA, DHA, ARA and total n-3 fatty acids, have more nutritional value than farmed shrimps in terms of human health. Since shrimps muscle fatty acid profile depends on fatty acid profile of diets mentioned problems would easily be solved by providing more suitable diets and because Farmed shrimps have gradually been replacing wild shrimps, ration composition reforms in order to maintenance of nutritional value of shrimps for human health seems to be necessary.
5. Acknowledgements
We wish to thank Mr Khalili, Sari University for his helping in preparing samples. Our special thanks go to the director of Gomishan Aquaculture Center for providing farmed shrimp.
REFERENCES
- C. H. MacLean, S. J. Newberry, W. A. Mojica, P. Khanna, A. M. Issa, M. J. Suttorp, Y. W. Lim, S. B. Traina, L. Hilton, R. Garland and S. C. Morton, “Effects of Omega-3 Fatty Acids on Cancer. Risk: A Systematic Review,” Journal of the American Medical Association, Vol. 295, No. 4, 2006, pp. 403-415. doi:10.1001/jama.295.4.403
- E. B. Levitan, A. Wolk and M. A. Mittleman, “Fish Consumption, Marine Omega-3 Fatty Acids, and Incidence of Heart Failure: A Population-Based Prospective Study of Middle-Aged and Elderly Men,” European Heart Journal, Vol. 30, No. 12, 2009, pp. 1495-1500. doi:10.1093/eurheartj/ehp111
- H. Ouraji, A. M. Abedian Kenari, B. Shabanpour, A. Shabani, S. A. Nezami, M. Sodagar, K. J. khalili and S. Faghani, “Growth Response and Muscle Lipid Quality of Indian White Shrimp Fed Different Oils at Two Dietary Lipid Levels,” Journal of Food Quality, Vol. 33, No. 4, 2010, pp. 405-423. doi:10.1111/j.1745-4557.2010.00336.x
- “Food and Agriculture Organization,” Fishery and Aquaculture Statistics, Yearbook, Rome, 2010.
- H. Ouraji, B. Shabanpour, A. M. Abedian Kenari, A. Shabani, S. Nezami, M. Sudagar and S. Faghani, “Total Lipid, Fatty Acid Composition and Lipid Oxidation of Indian White Shrimp (Fenneropenaeus indicus) Fed Diets Containing Different Lipid Sources,” Journal of the Science of Food and Agriculture, Vol. 89, No. 6, 2009, pp. 993-997. doi:10.1002/jsfa.3545
- G. Lepage and C. C. Roy, “Direct Transesterification of All Classes of Lipids in a One-Step Reaction,” Journal of Lipid Research, Vol. 27, 1986, pp. 114-120.
- P. W. Siri-Tarino, Q. Sun, F. B. Hu and R. M. Krauss, “Saturated Fat, Carbohydrate, and Cardiovascular Disease,” American Journal of Clinical Nutrition, Vol. 91, No. 3, 2010, pp. 502-509. doi:10.3945/ajcn.2008.26285
- R. J. Nicolosi, T. A. Wilson, C. Lawton and G. J. Handelman, “Dietary Effects on Cardiovascular. Disease Risk Factors: Beyond Saturated Fatty Acids and Cholesterol,” Journal of the American College of Nutrition, Vol. 20, 2001, pp. 421-427.
- B. M. Rasmussen, B. Vessby, M. Uusitupa, L. Berglund, E. Pedersen, G. Riccardi, A. A. Rivellese, L. Tapsell and K. Hermansen, “Effects of Dietary Saturated, Monounsaturated, and n-3 Fatty Acids on Blood Pressure in Healthy Subjects,” American Journal of Clinical Nutrition, Vol. 83, No. 2, 2006, pp. 221-226.
- A. P. Simopoulos, “The Importance of the Omega-6/ Omega-3 Fatty Acid Ratio in CardiovascularDisease and Other Chronic Diseases,” Experimental Biology and Medicine, Vol. 233, No. 6, 2008, pp. 674-688. doi:10.3181/0711-MR-311
- N. Kandasamy, F. Joseph and N. Goenka, “The Role of Omega-3 Fatty Acids in Cardiovascular. Disease, Hypertriglyceridaemia and Diabetes Mellitus,” British Journal of Diabetes & Vascular Disease, Vol. 8, No. 3, 2008, pp. 121-128. doi:10.1177/14746514080080030301
- P. M. Kris-Etherton, W. S. Harris and L. J. Appel, “Fish Consumption, Fish Oil, Omega-3 Fatty. Acids, and Cardiovascular Disease,” Arteriosclerosis, Thrombosis, and Vascular Biology, Vol. 23, 2003, pp. 20-31. doi:10.1161/01.ATV.0000038493.65177.94