Graphene
Vol.05 No.02(2016), Article ID:65658,8 pages
10.4236/graphene.2016.52008
Tuning Optical Properties of Graphene Oxide under Compressive Strain Using Wet Ball Milling Method
M. Venkat Narayana, S. Narayana Jammalamadaka*
Magnetic Materials and Device Physics Laboratory, Department of Physics, Indian Institute of Technology Hyderabad, Hyderabad-502285, India

Copyright © 2016 by authors and Scientific Research Publishing Inc.
This work is licensed under the Creative Commons Attribution International License (CC BY).
http://creativecommons.org/licenses/by/4.0/


Received 4 February 2016; accepted 17 April 2016; published 20 April 2016
ABSTRACT
We report on the effect of compressive stress on the optical properties of graphene oxide using a wet ball milling technique. For this purpose, graphene oxide was prepared using the modified Hummer’s method and subsequently processed with wet ball milling. X-ray diffraction infers a peak at 9.655˚ which is the allowed reflection for the graphene oxide. The Williamson-Hall method is used to quantify the strain on the 10 hrs and 20 hrs ball milled graphene oxide samples and is found to be 4.2% and 4.8% respectively. Although we applied strain on the graphene oxide, it actually helped to reduce the defects which are confirmed by the intensity drop-off of D-peak in Raman spectroscopy. Indeed there exists a band gap alteration of 0.14 eV for an applied compressive strain of ~4.8%, hinting that the reduction in oxygen functional groups and the same is confirmed with the Fourier Transform Infrared Spectroscopy (FTIR). The present results would be helpful in developing graphene oxide based flexible memories and optoelectronic devices.
Keywords:
Graphene Oxide, Band Gap, Oxygen Functional Groups, Optical Properties

1. Introduction
Tuning the optical properties of various materials has been of great interest due to their potential applications in optoelectronic devices [1] . Among many optical materials, graphene oxide (GO) has gained intense interest due to its versatility in various devices such as flexible electronics [2] , solar cells [3] and chemical sensors [4] . In recent past, intense research has been carried out to understand the properties of GO and transform it as reduced GO (rGO) in order to utilize in aforesaid applications [5] [6] . Essentially, GO is a single layer of the graphite oxide and consists of several oxygenated functional groups on its basal plane and at the edges. Graphite Oxide and GO are chemically identical and the latter consists of many oxygenated functional groups such as hydroxyl, epoxide, carbonyl and carboxyl groups. Among them, carbonyl and carboxyl groups are arranged on the edges of GO and hydroxyl, epoxy groups exist on the basal plane [7] [8] . As a result of many functional groups, GO structure is still ambiguous. The stoichiometry and the conductance of GO change due to the fact that the oxygenated-type functional groups change with different synthesis conditions. This would allow one to tune the electronic structure of GO from insulator to semiconductor and hence to metal in nature. Various methods like chemical, thermal and mechanical methods have been used to control the band gap by controlling the electronic structure of GO [9] - [12] .
An attempt has been made to reduce the GO by removing oxygen functional groups using a dry ball mill in an inert atmosphere [13] . Essentially, ball milling process is advantageous to remove the functional groups and creates the defects in addition to in-plane defects [14] . In the present case, we strongly believe that a de-oxyge- nation phenomenon is helping in inducing defects via ball milling technique. At this juncture, in recent past, it has been believed that wet ball milling method is more efficient than dry milling in attaining low particle size distribution and in maintaining low temperatures [15] . It is also well know that using wet ball milling method one can maintain low particle size distribution and less temperature. In addition, wet ball milling is more economical compared with dry ball milling method. Hence, in the present study we would like to demonstrate our efforts in tuning the optical properties of the GO marginally using wet ball milling. Salient features of the present manuscript are 1) preparation of GO uses modified Hummer’s method and characterization of various ball milled GO samples for their structural and optical properties; 2) a change in the band gap value of ~0.14 eV is evident for an applied compressive strain of 4.8% (milling time of 20 hrs), hinting that the reduction in oxygen related functional groups and the same is consistent with the Fourier Transform Infrared Spectroscopy (FTIR) results; 3) upon ball milling, decrease in D peak intensity pertinent to Raman studies indicates the reduction in defects.
2. Experimental
GO was prepared via modified Hummer’s method [16] . In this processes 1g of graphite powder and 0.5 g of sodium nitrate were mixed together followed by the addition of 23 ml of concentrated sulfuric acid under constant stirring. After 1 hour, 3 g of potassium permanganate was added slowly to the above solution while keeping the beaker in ice bath. We made sure that the ice bath maintains the temperature less than 15˚C - 20˚C. Essentially, ice bath prevents overheating and explosion of solution. Resulting mixture was stirred at 35˚C for 12 hours and the solution was diluted by adding 500 ml of deionized water under vigorous stirring. After completion of this process the solution was treated with 30% H2O2 (5 ml). Then the mixture was washed with hydrochloric acid and deionized (DI) water respectively. Ultimately GO was obtained by filtration of the above solution and drying the resultant material [16] [17] . Obtained GO was ball milled in the presence of toluene (9 ml volume of toluene) using Retsch ball mill (Germany) with a rotation speed of 350 rpm. During this experiment the ball to powder ratio was maintained as 1:10. Weight and diameter of each ball were 0.207 g and 2 mm respectively. Test samples were taken at different time intervals say 0 hrs, 10 hrs and 20 hrs respectively. From now onwards we call 0 hour, 10 hour and 20 hour ball milled samples as 0 hr BMGO (0 hr ball milled GO), 10 hr BMGO (10 hrs ball milled GO) and 20 hr BMGO (20 hr ball milled GO) respectively. All samples were characterised for phase purity using BRUKER Pan analytical powder X-ray diffractometer (XRD) using CuKα radiation with a wavelength of 1.540 Å for about 1 hour and with a step size of 0.0170 Å. Morphological properties of the samples were performed using an atomic force microscopy (AFM). In order to get information about the phonon, bending and stretching modes, Raman spectrum was collected on all samples using BRUKER Raman spectrometer with an excitation wavelength of 532 nm. Fourier transform infrared spectroscopy (FTIR) (BRUKER alpha-p FTIR spectrometer) was performed to see the effect of compressive strain on various functional groups of GO such as C=O, C-O, defective OH group, bending OH group and stretching OH group. Thermal stability of GO and all BMGO samples was determined using thermo gravimetric analysis (temperature range 15˚C - 1000˚C, heating rate 10˚C/min) using Simultaneous Thermal Analyzer-8000 (PerkinElmer, (STA)-8000). Band gap values of various ball milled samples were determined using PerkinElmer UV/VIS/NIR Lambda 1050 spectrophotometer and by Tauc plots.
3. Results and Discussions
Figure 1 depicts the XRD patterns of parent and ball milled graphene oxide (GO). XRD infers a peak at 9.655˚ which is the allowed reflection for GO. It is to be noted that the peak intensity at 9.655˚ decreases which may be ascribed to decrease in oxygen related functional groups upon ball milling. We shall discuss more about this in subsequent sections. We also calculated inter planar spacing using Braggs law, which is given by 2dhklSinθ = nλ, where λ is X-ray wavelength, θ is the Bragg’s angle, n is the order of diffraction and dhkl is inter planar spacing. The value of dhkl is calculated as 0.915 nm (0 hr BMGO), 0.902 nm (10 hr BMGO) and 0.895 nm (20 hr BMGO) respectively.
Figure 2(a) shows the variation of inter planar spacing vs. ball milling time. It is clear that calculated inter planar spacing is found to decrease while the XRD peak position shifts to higher angles and such intriguing
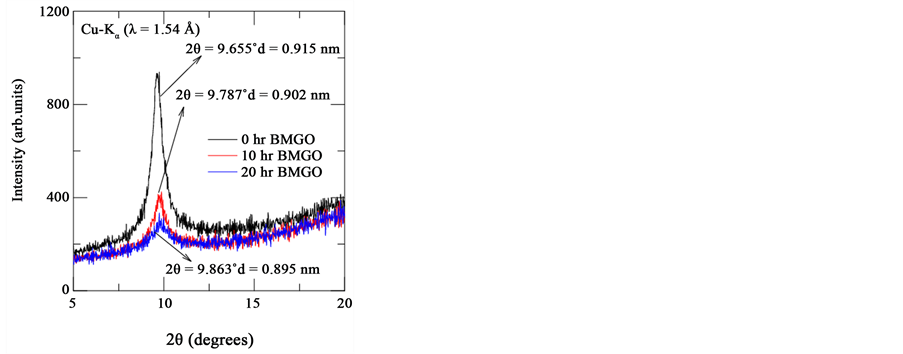
Figure 1. Powder X-ray diffraction pattern of all graphene oxide samples (0 hr, 10 hr and 20 hr). It is clear that inter planar spacing decreases with milling time while the peak shifts to higher angles.

Figure 2. (a) Milling time vs. Inter planar spacing for ball milled GO sample; (b) Strain and average crystallite size with different milling times for GO sample.
phenomena is consistent with the Bragg’s equation. Decrease in inter planar spacing upon ball milling time could be due to the compressive strain upon ball milling and may be due to removal of intercalated oxygen functional groups from the graphene oxide layers. The value of the d-spacing for the parent GO is consistent with the literature value [18] [19] . In order to have more insights on the strain that is applied, we also estimated the induced strain on GO using the Williamson-Hall method [20] and by using the strain equation:

where ε is the strain, β is the full width half maximum and θ is the Bragg angle; and it is found to be 4.2% (0.042) and 4.8% (0.048) respectively for 10 hr BMGO and 20 hr BMGO samples. The variation of strain percentage with milling time is shown in Figure 2(b). It is important to note that with the milling time, the strain on GO enhances. From XRD it is also evident that upon ball milling time, the intensity of the peak at 9.655˚ diminishes due to decrease in oxygen related functional groups, and broadens as a result of decrease in average crystal size upon ball milling. The average crystal size is calculated using Debye Scherer equation

where K is the shape factor, λ is the wavelength of the CuKα radiation, β is full width half maximum and θ is Bragg’s angle; and is found to be 9.51 nm and 8.43 nm for 10 hr BMGO and 20 hr BMGO respectively (Figure 2(b)). This may be one of the reasons why the intensity of XRD peak at 9.655˚ decreases.
The morphological properties of the ball milled samples were performed using an atomic force microscopy (AFM) and are shown in Figures 3(a)-(c). Drop casting method is used to prepare thin films of ball milled samples. We strongly believe that there might be aggregation of GO flakes due to which the thickness of film is ~100 nm. From the figure, it is clear that surface roughness of film decreases and the variation is plotted in Figure 3(d).
In order to understand the thermal stability and monitor mass loss or gain due to decomposition, oxidation or loss of volatiles, we have carried out the thermo-gravimetric analysis TGA on GO samples using STA 8000. TGA plots of all the GO samples are shown in Figure 4. From the graph it is evident that GO is thermally not a stable compound and can easily decomposes or loses the weight even at temperatures below 100˚C. Interestingly, the significant weight loss around at 200˚C is due to the fact that the thermal decomposition of the easily altered functional groups, which are related to carbon monoxide (CO), carbon dioxide (CO2) and steam or water absorbed by the graphene oxide molecules from the air [21] . In addition to the above, as a result of removal of more stable oxygen functional groups, indeed there exists a weight loss in the temperature range 400˚C - 950˚C. This loss is slower than the previous one at 200˚C [22] . As shown in Figure 4, it is evident that the weight loss of 0 hr BMGO, 10 hr BMGO and 20 hr BMGO are 54.02%, 51.02% and 47.22% respectively around 320˚C. Indeed there exists marginal change in the thermal stability of GO after ball milling.
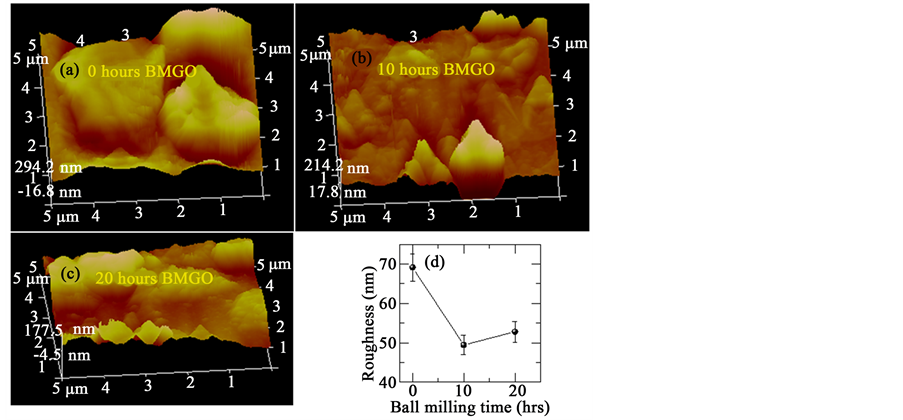
Figure 3. (a)-(c) 3D AFM Images and (d) shows the roughness of GO with respect to milling time.

Figure 4. TGA plots of all graphene oxide samples.
Now we discuss the effect of wet ball milling on different modes of Raman spectrum. The main bands of Raman spectrum for carbon based materials are D-band, G-band, 2D-band and D + G band, these can be measured non-destructively by Raman spectroscopy. Figure 5 depicts the well-defined peaks at the wavenumbers 1350 cm−1 and 1580 cm−1 respectively, which demonstrates the D-band and G-band respectively. G band is the characteristic peak of sp2 hybridized carbon network which arises from the doubly degenerate optical E2g phonon mode of Brillouin zone centre and bond stretching of sp2 carbon pairs in both chains and rings. The D-peak corresponds to the breathing mode of aromatic rings and which arises from the structural defects in the sample, the intensity of the D peak measures the degree of the disorder. It is evident from the Figure 5 that the intensity of D peak diminishes with applied compressive stress, hinting that the compressive stress helped in decreasing the disorder in GO. The peak at 2696 cm−1 represents the 2D peak and is the overtone of the D band which provides the information about the number of graphene layers. Since we have done Raman measurements with powder samples where random orientations are possible, we observed only a small peak. Earlier Mondal et al. [13] have observed very small peak due to random orientations of GO. The origin of such 2D peak is from double resonance transitions resulting in production of two phonons with opposite momentum [23] . Inset of Figure 5 shows the intensity ratio of the D band to G band, which essentially gives the information about the oxidation degree. It is evident that ID/IG ratio decreases with milling time which is due to decrease in oxygen related groups in GO. In order to confirm and get more insights pertinent to the presence of various oxygen related functional groups in parent and BMGO samples, FTIR measurements were carried out.
Figure 6(a) represents the FTIR spectra of parent GO and various BMGO samples. Obtained characteristic peaks of graphene oxide by FTIR spectroscopy are consistent with the existing literature [18] [23] . Figures 6(b)-(f) represent various oxygen related groups say C=O (1725 cm−1), C-O (1065 cm−1), defective OH group (1390 cm−1), bending OH group (652 cm−1) and stretching OH group (3406 cm−1) respectively. From the figure it is evident that the peak intensity of aforementioned groups diminishes with the applied compressive stress. It is believed that band gap of GO (2 - 5 eV) varies depending on the oxygen groups that are present. As we stated above, decrease in oxygen related groups may allow engineering the band gap values with the applied compressive stress. In order to look into above aspect, wavelength versus absorption spectrum was recorded by UV Vis NIR Spectrometer in the UV VIS region (200 nm to 800 nm). 1.2 mg of GO (0 hr BMGO) sample was dissolved in 25 ml of DI water and the same is followed for other samples (10 hr BMGO and 20 hr BMGO) in order to obtain absorption spectra.
Figure 7(a) shows the normalized absorbance vs. wavelength spectrum for all the ball milled GO samples. It is evident that the maximum absorption peak prevails around 230 nm due to π-π* transition of the aromatic carbon-carbon (C=C) bonds and shoulder peak nearly at 301 nm obtained due to n-π* transitions of epoxide (C-O-C) bonds [24] [25] . It is also evident from inset of the figure that peak position shifts to higher wavelengths, hinting a reduction in band gap upon milling time. The relation between incident photon energy and absorption coefficient can be defined as

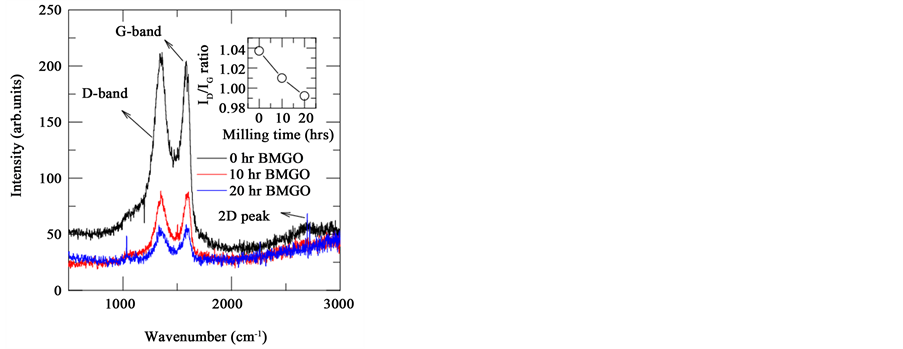
Figure 5. Raman spectrum of all BMGO (0 hr, 10 hr and 20 hr) samples. Inset shows the variation of ID/IG ratio of BMGO samples with ball milling time.

Figure 6. (a) FTIR plots of all graphene oxide samples; (b)-(f) represents the peaks and their behaviour of various oxygen related groups say C=O (1725 cm−1), C-O (1065 cm−1), defective OH group (1390 cm−1), bending OH group (652 cm−1) and stretching OH group (3406 cm−1), respectively.
where A is the constant, Eg is the band gap of the material and n is the exponent depend on the type of transition. As GO consists direct band gap values, we used n = 1/2. Using the above relation and Tauc plots [26] [27] , we extracted the band gap values by extrapolating the linear region of E vs. (αE)2 to the energy axis. As shown in inset of Figure 7(b), the band gap decreases with the applied compressive stress and this result is consistent with our FTIR measurements. From the measurements of Raman spectra, FTIR and UV-Vis-NIR measurements we believe that indeed there exists a marginal variation of optical properties upon wet ball milling due to decrease in oxygen related groups. The variation of band gap value from 4.06 eV (0 hrs) to 3.92 eV (20 hrs) can be attributed to the de-oxidation compared with the parent compound upon ball milling.
4. Conclusion
In summary, we have demonstrated the effect of compressive stress on the structural and optical properties of graphene oxide through wet ball milling technique. Williamson-Hall method infers a decrease in average crystallite size upon ball milling. Raman studies infer decrease in defects of GO sample upon wet ball milling. In
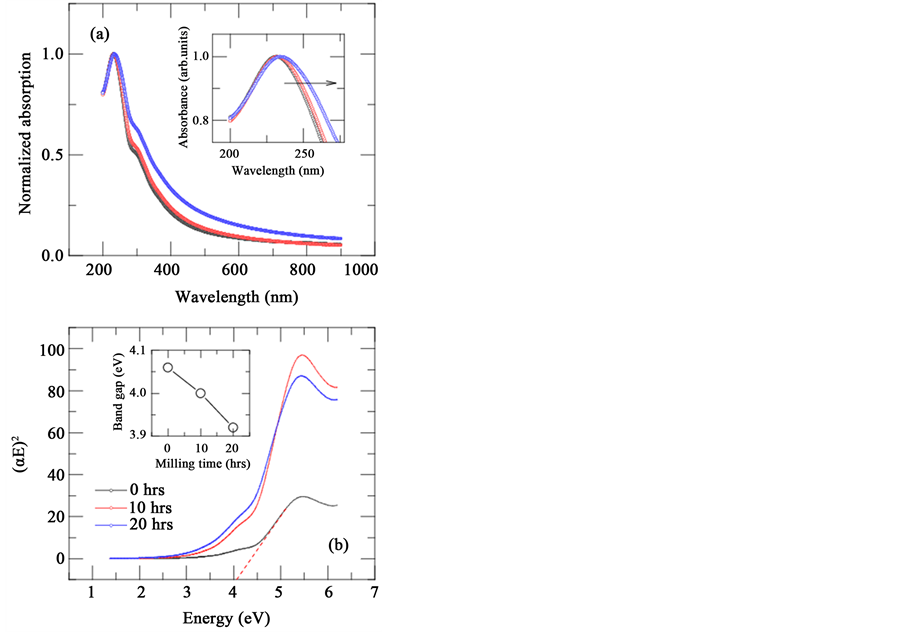
Figure 7. (a) Wavelength vs normalized absorption spectrum of all graphene oxide samples. Inset shows clear shift of absorption spectrum towards higher wavelengths; (b) Tauc plots of all graphene oxide samples. Inset shows variation of band gap with ball milling time.
addition to Raman spectra, FTIR and UV-Vis-NIR measurements together support the fact of reduction in oxygen functional groups in GO during wet ball milling. The shift in absorbance peak to higher wavelength values upon ball milling indicates a decrease in band gap. From the Tauc plots it is evident that there exists a marginal variation of band gap value from 4.06 eV (0 hr BMGO) to 3.92 eV (20 hr BMGO). Such variation is due to de-oxidation of GO. From the above, it can be understood that indeed there exists a complex interplay between reduction in average crystallite size and decrease in oxygen related functional groups which results in a marginal change in optical properties. The present results would indeed be helpful in developing GO based optoelectronic devices and sensors for biological applications.
Acknowledgements
We acknowledge Indian Institute of Technology Hyderabad for the financial support.
Cite this paper
M. Venkat Narayana,S. Narayana Jammalamadaka, (2016) Tuning Optical Properties of Graphene Oxide under Compressive Strain Using Wet Ball Milling Method. Graphene,05,73-80. doi: 10.4236/graphene.2016.52008
References
- 1. Bonaccorso, F., Sun, Z., Hasan, T. and Ferrari, A.C. (2010) Graphene Photonics and Optoelectronics. Nature Photonics, 4, 611-622. http://dx.doi.org/10.1038/nphoton.2010.186
- 2. Rogala, M., Wlasny, I., Dabrowski, P., Kowalczyk, P.J., Busiakiewicz, A., Kozlowski, W., Lipinska, L., et al. (2015) Graphene Oxide Overprints for Flexible and Transparent Electronics. Applied Physics Letters, 106, Article ID: 041901. http://dx.doi.org/10.1063/1.4906593
- 3. Kim, H.P., bin Mohd Yusoff, A.R. and Jang, J. (2013) Organic Solar Cells Using a Reduced Graphene Oxide Anode Bu?er Layer. Solar Energy Materials and Solar Cells, 110, 87-93. http://dx.doi.org/10.1016/j.solmat.2012.12.001
- 4. Borini, S., White, R., Wei, D., Astley, M., Haque, S., Spigone, E., Harris, N., Kivioja, J. and Ryhanen, T. (2013) Ultrafast Graphene Oxide Humidity Sensors. ACS Nano, 7, 11166-11173. http://dx.doi.org/10.1021/nn404889b
- 5. Geim, A.K. and Novoselov, K.S. (2007) The Rise of Graphene. Nature Materials, 6, 183-191. http://dx.doi.org/10.1038/nmat1849
- 6. Saxena, S. and Tyson, T.A. (2010) Interacting Quasi-Two-Dimensional Sheets of Interlinked Carbon Nanotubes: A High-Pressure Phase of Carbon. ACS Nano, 4, 3515-3521. http://dx.doi.org/10.1021/nn100626z
- 7. Krishnamoorthy, K., Veerapandian, M., Yun, K. and Kim, S.-J. (2013) The Chemical and Structural Analysis of Graphene Oxide with Different Degrees of Oxidation. Carbon, 53, 38-49. http://dx.doi.org/10.1016/j.carbon.2012.10.013
- 8. Lerf, A., He, H.Y., Forster, M. and Klinowski, J. (1998) Structure of Graphite Oxide Revisited. The Journal of Physical Chemistry B, 102, 4477-4482. http://dx.doi.org/10.1021/jp9731821
- 9. Hunt, A., Kurmaev, E.Z. and Moewes, A. (2014) Band Gap Engineering of Graphene Oxide by Chemical Modification. Carbon, 75, 366-371. http://dx.doi.org/10.1016/j.carbon.2014.04.015
- 10. Acik, M. and Chabal, Y.J. (2013) A Review on Thermal Exfoliation of Graphene Oxide. Journal of Materials Science Research, 2, 101-112.
- 11. Lian, K.-Y., Ji, Y.-F., Li, X.-F., Jin, M.-X., Ding, D.-J. and Luo, Y. (2013) Big Bandgap in Highly Reduced Graphene Oxides. The Journal of Physical Chemistry C, 117, 6049-6054. http://dx.doi.org/10.1021/jp3118067
- 12. Loh, K.P., Bao, Q., Eda, G. and Chhowalla, M. (2010) Graphene Oxide as a Chemically Tunable Platform for Optical Applications. Nature Chemistry, 2, 1015-1024. http://dx.doi.org/10.1038/nchem.907
- 13. Mondal, O., Mitra, S., Pal, M., Datta, A., Dhara, S. and Chakravorty, D. (2015) Reduced Graphene Oxide Synthesis by High Energy Ball Milling. Materials Chemistry and Physics, 161, 123-129. http://dx.doi.org/10.1016/j.matchemphys.2015.05.023
- 14. Yue, X., Wang, H., Wang, S., Zhang, F. and Zhang, R. (2010) In-Plane Defects Produced by Ball-Milling of Expanded Graphite. Journal of Alloys and Compounds, 505, 286-290. http://dx.doi.org/10.1016/j.jallcom.2010.06.048
- 15. Kotake, N., Kuboki, M., Kiya, S. and Kanda, Y. (2011) Influence of Dry and Wet Grinding Conditions on Fineness and Shape of Particle Size Distribution of Product in a Ball Mill. Advanced Powder Technology, 22, 86-92. http://dx.doi.org/10.1016/j.apt.2010.03.015
- 16. Hummers, W.S. and Offeman, R.E. (1958) Preparation of Graphitic Oxide. Journal of the American Chemical Society, 80, 1339-1339. http://dx.doi.org/10.1021/ja01539a017
- 17. Shahriary, L. and Athawale, A.A. (2014) Graphene Oxide Synthesized by Using Modified Hummers Approach. International Journal of Revolution in Electrical and Electronic Engineering, 2, 58-63.
- 18. Mu, S.-J., Su, Y.-C., Xiao, L.-H., Liu, S.-D., Hu, T. and Tang, H.-B. (2013) X-Ray Difraction Pattern of Graphite Oxide. Chinese Physics Letters, 30, Article ID: 096101. http://dx.doi.org/10.1088/0256-307X/30/9/096101
- 19. Marcano, D.C., Kosynkin, D.V., Berlin, J.M., Sinitskii, A., Sun, Z., Slesarev, A., Alemany, L.B., Lu, W. and Tour, J.M. (2010) Improved Synthesis of Graphene Oxide. ACS Nano, 4, 4806-4814. http://dx.doi.org/10.1021/nn1006368
- 20. Mote, V.D., Purushotham, Y. and Dole, B.N. (2012) Williamson-Hall Analysis in Estimation of Lattice Strain in Nanometer-Sized ZnO Particles. Journal of Theoretical and Applied Physics, 6, 6. http://dx.doi.org/10.1186/2251-7235-6-6
- 21. Shen, J., Hu, Y., Shi, M., Lu, X., Qin, C., Li, C. and Ye, M. (2009) Fast and Facile Preparation of Graphene Oxide and Reduced Graphene Oxide Nanoplatelets. Chemistry of Materials, 21, 3514-3520. http://dx.doi.org/10.1021/cm901247t
- 22. Stankovich, S., Dikin, D.A., Piner, R.D., Kohlhaas, K.A., Kleinhammes, A., Jia, Y., Wu, Y., Nguyen, S.T. and Ruoff, R.S. (2007) Synthesis of Graphene-Based Nanosheets via Chemical Reduction of Exfoliated Graphite Oxide. Carbon, 45, 1558-1565. http://dx.doi.org/10.1016/j.carbon.2007.02.034
- 23. Zhao, J., Liu, L. and Li, F. (2015) Graphene Oxide: Physics and Applications. Springer, Berlin.
- 24. Saxena, S., Tyson, T.A., Shukla, S., Negusse, E., Chen, H. and Bai, J. (2011) Investigation of Structural and Electronic Properties of Graphene Oxide. Applied Physics Letters, 99, Article ID: 013104. http://dx.doi.org/10.1063/1.3607305
- 25. Xu, S., Yong, L. and Wu, P. (2013) One-Pot, Green, Rapid Synthesis of Flowerlike Gold Nanoparticles/Reduced Graphene Oxide Composite with Regenerated Silk Fibroin as Efficient Oxygen Reduction Electrocatalysts. ACS Applied Materials & Interfaces, 5, 654-662. http://dx.doi.org/10.1021/am302076x
- 26. Pathak, C.S., Mishra, D.D., Agarwala, V. and Mandal, M.K. (2013) Optical Properties of ZnS Nanoparticles Prepared by High Energy Ball Milling. Materials Science in Semiconductor Processing, 16, 525-529. http://dx.doi.org/10.1016/j.mssp.2012.10.005
- 27. Hsu, H.-C., Shown, I., Wei, H.-Y., Chang, Y.-C., Du, H.-Y., Lin, Y.-G., Tseng, C.-A., et al. (2013) Graphene Oxide as a Promising Photocatalyst for CO2 to Methanol Conversion. Nanoscale, 5, 262-268. http://dx.doi.org/10.1039/C2NR31718D
NOTES

*Corresponding author.