International Journal of Medical Physics, Clinical Engineering and Radiation Oncology
Vol. 1 No. 3 (2012) , Article ID: 24913 , 10 pages DOI:10.4236/ijmpcero.2012.13013
Hypoxia Imaging of Rodent Xenografts with 18F-Fluoromisonidazole: Comparison of Dynamic and Static PET Imaging
1Department of Radiation Oncology, University of Miami, Coral Gables, USA
2Philips Technologie GmbH Forschungslaboratorien, Aachen, Germany
3Department of Medical Physics, Memorial Sloan-Kettering Cancer Center, New York, USA
4Philips Research North America, Briarcliff Manor, New York, USA
5Toshiba Medical Research Institute, Vernon Hill, USA
6Department of Radiology, Memorial Sloan-Kettering Cancer Center, New York, USA
7Varian Medical Systems, Inc., Palo Alto, USA
Email: kwang1@med.miami.edu, hummj@mskcc.org
Received September 6, 2012; revised October 7, 2012; accepted October 17, 2012
Keywords: Tumor Hypoxia; Dynamic Image; Compartmental Modeling; 18F-FMISO PET
ABSTRACT
Purpose: To generate parametric images of tumor hypoxia in a tumor-bearing rat model using voxel-based compartmental analysis of dynamic fluorine-18 labeled misonidazole (18F-FMISO) microPET™ images, and to compare the parametric images thus derived with static “late” 18F-FMISO microPET™ images for the detection of tumor hypoxia. Materials and Methods: Nude rats bearing HT-29 colorectal carcinoma xenografts (≈1.5 - 2 cm in diameter) in the right hind limb were positioned in a custom-fabricated, animal-specific foam mold. Animals were injected via the tail vein with ≈55.5 MBq 18F-FMISO and continuously imaged for either 60 or 120 minutes, with additional late static images up to 3 hour post-injection. The raw list-mode data was reconstructed into 37 - 64 frames with earlier frames of shorter time durations (12 - 15 seconds) and later frames of longer durations (up to 300 seconds). Time activity curves (TACs) were generated over regions encompassing the tumor as well as an artery, the latter for use as an input function. A beta version of a compartmental modeling package (BioGuide™, Philips Healthcare) was used to generate parametric images of k3 and Ki, rate constants of entrapment and flux of 18F-FMISO, respectively. Results: Data for 7 HT-29 tumor xenografts were presented, 6 of which yielded clear areas of tumor hypoxia as defined by Ki/k3 maps. Importantly, intratumoral foci with high 18F-FMISO uptakes on the late images did not always exhibit high Ki/k3 values and may therefore represent false-positives for radiobiologically significant hypoxia. Conclusions: This study attempts to quantify tumor hypoxia using compartmental analysis of dynamic 18F-FMISO PET images in rodent xenograft tumor models. The results demonstrate feasibility of the approach in small-animal imaging studies, and provide evidence for the possible unreliability of late-time static imaging of 18F-FMISO PET in identifying tumor hypoxia.
1. Introduction
There are now compelling evidences for the importance of hypoxia as an independent prognosticator of therapeutic outcome regardless of treatment modality [1-3]. A consequence of this has been a strong interest in methods to reliably quantify the distribution of tumor hypoxia and to potentially delineate radio-resistant hypoxic foci as intra-tumoral targets for intensity modulated radiation therapy (IMRT) [4-7]. Multiple methods were developed to detect hypoxia. These include direct measurements with interstitial PO2 probes [8,9], immunohistochemistry
[10], and in vivo imaging [11]. Of widest clinical applicability, however, is the imaging approach because of its noninvasive nature and potential to provide hypoxia images of the whole tumor, thereby avoiding “sampling” errors potentially associated with the first two methods. The most widely investigated ones for the non-invasive imaging approaches to detect tumor hypoxia are the nuclear methods using SPECT and PET. A number of hypoxia radiotracers have been developed and evaluated for this purpose. Those which have been used clinically include the single-photon emitter Iodine-124 labeled iodoazomycin arabinoside (124I-IAZA) [12] and the positron emitter Fluorine-18 labeled misonidazole (18F-FMISO) [13-15], Copper-60 and Copper-64 labeled Cu-diacetyl-bis(N4-methylthiosemicarbazone) (Cu-ATSM) [16], 18F-labeld fluoroerythronitroimidazole (18F-FETNIM) [17], 18F-labeled azomycin arabinoside (18F-FAZA) [18] and 18F-labeled 2-(2-nitro-(1)H-imidazol-1-yl)-N-(2,2,3,3,3- pentafluoropropyl)-acetamide (18F-EF5) [19].
18F-FMISO was among the first hypoxia radiotracers proposed [11] and has been the most extensively investigated one to date. 18F-FMISO is a 2-nitroimidazole that undergoes irreversible electron reduction and eventual metabolic trapping at low PO2, i.e., at radiobiologically significant oxygen tensions of 5 mm Hg or less. Under such conditions, the radiotracer becomes bound to proteins or other macromolecules. At higher oxygen concentrations, oxidation readily occurs and the 18F-FMISO reverts to its diffusible form and thus does not accumulate in normoxic tissues.
Because of its relatively short physical half-life of 110 min, PET scans of 18F-labeled radiotracers generally must be performed within about 3 hours of administration in order to obtain statistically reliable numbers of counts. Clinically, therefore, static PET scans of 18F labeled hypoxia tracers have most commonly been performed between 90 - 180 minutes post injection. The imaging time point represents a compromise among the available imaging signal (i.e., count statistics), which decreases with time, and the contrast between hypoxic and normoxic foci, which increases with time. The hypoxia-to-normoxia contrast increases over time because the amount of unfixed activity (i.e., activity not associated with hypoxia) decreases and therefore imaging at later times post-injection should more specifically identify hypoxic foci.
The practical advantages of single-time point imaging are the convenience and similarity to routine 18F-FDG PET. However, the identification of regions of hypoxia on single-time point images requires a criterion for 18FFMISO PET image segmentation. The group at the University of Washington, who pioneered 18F-FMISO PET imaging, has suggested that voxels whose intensities are 1.3 times higher than that of blood correspond to hypoxia [20]. This threshold value was based upon the finding that fewer than 5% of normal tissue voxels at late time point imaging exceeded this value. Thus contiguous intra-tumor 18F-FMISO PET voxel values greater than 1.3 may identify tumor hypoxia [21].
However, recent kinetic studies showed that the rate and amount of 18F-FMISO uptake may vary among tumors and therefore a single hypoxia segmentation criterion may not unambiguously identify tumor hypoxia [22]. To quantitatively differentiate hypoxic from non-hypoxic tissue in tumors, and to determine if late PET images reliably identify tumor hypoxia, we performed either 2-hour dynamic 18F-FMISO PET studies or 1-hour dynamic images followed by sequential 5-minute images at 90, 120, 150 and 180 minutes post-injection on rodent xenografts. A static “late” 18F-FMISO PET image could be considered as the last scan of the sequential post-injection scans which constructing a dynamic study. These dynamic data were analyzed by compartmental modeling on a voxel-by-voxel basis to derive parametric maps of the rate of 18F-FMISO trapping in tissue and these maps were compared to the static “late” 18F-FMISO PET images.
2. Material and Methods
2.1. Animal Handling
Nude rats were injected subcutaneously with 5 × 10⁶ HT- 29 colorectal carcinoma cells to establish a tumor in the right hind limb. After 5 weeks, tumors reached a size of ≈2 cm in diameter. This site for the tumor xenograft was selected to minimize the effects of respiration and potential tumor motion during the dynamic scan. In addition, each anesthetized animals (with 1.5% isoflurane/ compressed air) were immobilized in a custom-fabricated rapid-setting foam mold [23]. These molds maintained the animal’s position for the duration of the microPET™ scan as well as to facilitate accurate repositioning in serial scans. This animal protocol was approved by the Institutional Animal Care and Use Committees (IACUC) of Memorial-Sloan Kettering Cancer Center (MSKCC).
2.2. MicroPET™ Imaging Protocol and Data Handling
The fluorine-18 radioisotopes were produced in MSKCC in-house cyclotron (EBCO Technologies, Inc., Vancouver, Canada) by irradiating an enriched 18O-water target inside a titanium chamber with accelerated proton beams. 18F-FMISO was synthesized accordingly as reported [24, 25].
A total of 7 nude rats were scanned on a Focus 120 microPET™ scanner (Concorde Microsystems, Knoxville, TN) following tail vein injection of ≈55.5 MBq 18F-FMISO. The animals were imaged using two differrent scanning protocols as depicted below.
Five animals were imaged continuously for 2 hours starting at the time of injection. The list-mode data was divided into 40 - 50 durations, of 12 - 15 seconds for the first-minutes, and 300 second subsequently. Two animals were continuously scanned for 1 hour, and then for 5-min at 90, 120, 150 and 180 min post-injection. After each scan, the animal was returned to its cage (animals will be in very bad condition during the 3-hour scan without recovery between scans) after removal of anesthetic. For every subsequent scan the animal was re-anesthetized and carefully repositioned in its custom mold before the scan. Similar to those 5 animals above, the 60-minute list-mode data was divided into 20 - 30 consecutive images of similar time durations, the 4 later scans were separated into 2 image frames, each of 300 seconds durations. The image sets for the later 90 - 180 minute time points were co-registered using external fiduciary marker-based registration. With each fiduciary rod occupying several voxels in an image, the uncertainty of registration is less than 1 voxel (data not shown). The co-registered scans were then combined to yield a temporal sequence of data spanning from the time of injection to 3 hours post-injection. Studies of the accuracy in repositioning animal into the foam mold have been reported by Zhang et al. [26].
The list-mode data were sorted into two-dimensional temporally sorted sonograms by Fourier re-binning and transverse images reconstructed in a 128 × 128 × 96 matrix (voxel size 0.87 × 0.87 × 0.80 mm3) by filtered backprojection (FBP) using a ramp filter with a cutoff frequency equal to the Nyquist frequency. Although no attenuation, scatter, or partial-volume correction was applied, the reconstructed images were expressed in quantitative terms (the activity per unit volume, Bq/ml, decay-corrected to the time of injection) using a system calibration factor measured by imaging a rat-size waterfilled cylinder containing a known concentration of 18F. However, absolute quantification of 18F-FMISO was not required for this study, but rather relative changes over time.
2.3. Compartmental Modeling
The idea of compartmental modeling was first proposed for epidemiology analysis by Kermack & McKendrick in 1937 [27], and was later applied to pharmacokinetics, including that in cancer studies [28]. Pharmacokinetic analysis of dynamic 18F-FMISO data was first performed using a simplified compartmental model by Casciari et al. in 1995 [29], and was adopted in this study (Figure 1).
The time-dependent activity concentration (Bq/ml) in a given region of interest (ROI) was extracted from the sequential image frames and used to generate a time activity curve (TAC). A volume of interest (VOI) was used
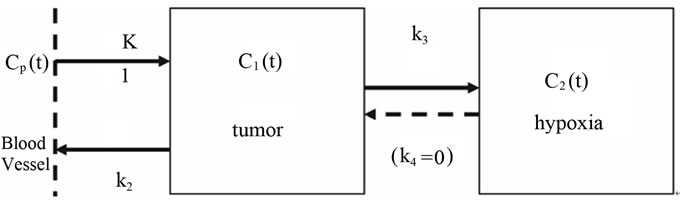
Figure 1. A conceptual 2-compartment model for 18FFMISO uptake in tumor hypoxia. In this model the transfer rate constant k4 from C2(t) →C1(t) is set to zero.
for the tumor and a region of interest (ROI) at the coronal section was used for the input function Cp(t). The vessel was readily discernible in the early frames (i.e. within the first minute post-injection) and its TAC exhibited a welldefined peak within the first one to two frames. The rate of metabolism (breakdown) of 18F-FMISO is slow in vivo (4% - 8% in 90 minutes [30]), and therefore metabolite correction of the input function was not considered in our analysis.
The simplified 3-compartment 2-tissue model [29] can be described by the following partial differential equations:
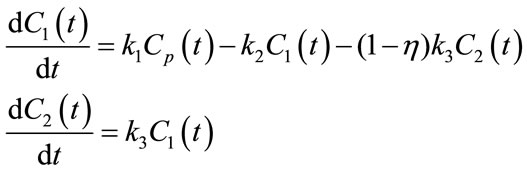 (1)
(1)
Here η is the fraction of the tissue volume occupied by extracellular space. The observed activity concentration for a given ROI is a linear combination of Cp(t), C1(t) and C2(t):
 (2)
(2)
in which V is the observed volume and β fractional blood volume. By solving (1), Cobs(t) can be rewritten as a convolution of input function Cp(t):
 (3)
(3)
in which:
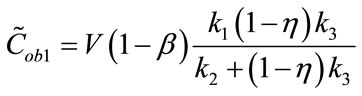 (4)
(4)
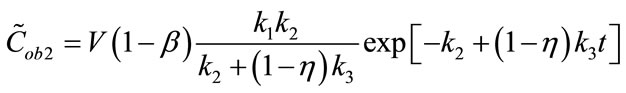 (5)
(5)
The first term of Equation (3), representing the “trapped contribution”, models the progressive hypoxia-related accumulation of tracer over time, the second represents the “diffusible contribution” for normoxic tumor tissue, and the third the vascular contribution, with the trapped component presumably reflecting the degree of hypoxia.
We define the flux Ki as follows:
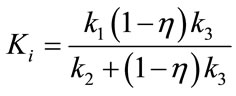 (6)
(6)
Ki represents the flux, or overall “trapping rate,” of 18F-FMISO in hypoxic tissue. Both Ki and k3 are indicators of hypoxia, where Ki ≈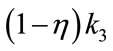 when
when  The extra-cellular fraction h and V were kept fixed at typical values reported in the literature (h = 0.5, V = 1) [29], and the optimization scheme fitted the free parameters of the model namely, k1, k2, k3 and b.
2.4. Parametric Images Verse Late-Time Image for Tumor Hypoxia
As results of pharmacokinetic analysis, parametric images (Ki and k3) are deemed more convincing hypoxia indicators in theory than late-time 18F-FMISO microPET images [29]. To conduct compartmental modeling for microPET images, sequential scans are taken at different time spots within 2 - 3 hrs post-injection period in order to acquire differential uptake information of 18F-FMISO in hypoxia, thus the “late” 18F-FMISO microPET scan is actually the last scan of the entire dynamic sequential scans. Consequently, parametric images Ki and k3 are based on much more imaging information and hence more reliable than the late-time image.
The 18F-FMISO uptake in the “late” scan is the outcome of the entire post-injection 18F-FMISO uptake history. In addition to hypoxia uptake, late-time microPET images may reveal 18F-FMISO concentration caused by other factors, such as temporary high-blood flow, or necrosis trapping 18F-FMISO in the early time that has much longer residual time. Parametric images Ki or k3, however, may filter out those “noises” against hypoxia uptake with compartmental modeling.
2.5. The BioGuide( Software Toolkit
Kinetic analysis was performed using the proprietary BioGuideÔ software package (Philips Healthcare) which provides the capability of performing compartmental modeling on a voxel-by-voxel basis as well as for conven tional ROIs. The BioGuideÔ software package is part of the research version of Pinnacle3Ô, the radiotherapy treatment planning program marketed by Philips Healthcare.
After fitting a TAC to blood time-activity data (derived by dynamic imaging or radio-assay of serial blood samples) the software optimizes the model parameters defined above in order to minimize the summed χ2 be tween the model fit and the measured data on a voxel by voxel basis. The Levenberg-Marquardt algorithm is used for the optimization. The results are generated as a set of voxel-by-voxel parameter maps.
2.6. Regions of Interest Definition for Arterial Input Function
The artery was contoured using a summed image of the first minute of acquisition post injection (Figure 2). To define the contours for tumor regions, the last 10 minutes of the acquisition (120 min post-injection) was used. Since 18F-FMISO targets hypoxic tissues, there is no clear contrast between normoxic tissues in tumor and surrounding normal tissue in 18F-FMISO PET images, thus regions of higher uptake in the late-time images were contoured as they were assumed to correspond to hypoxic foci. In addition, a much larger box containing the hypoxic foci in the 3D-image was also extracted as the volumes of interest (VOIs). These regions were then copied to the individual image time frames in order to generate the TAC data. Compartmental modeling was then applied to all voxels within an ROI corresponding to the whole tumor for each animal constrained within the physiological boundary conditions. The goodness of fit was evaluated using the χ2 test.
3. Results and Discussions
3.1. Validation of BioGuide( Software
The precision and accuracy for BioGuideÔ software which implements the irreversible one-plasma two-tissue compartmental model on simulated dynamic PET scans for hypoxic and normal tissue regions were validated to provide “ground truth” k1, k2 and k3 parameter constants and tissue activity curves i.e. input function. The initial dynamic dataset was produced without noise to determine the accuracy of parameter estimation. The addition of Gaussian noise to this data was used to test the precision of BioGuideÔ under realistic PET noise levels. Furthermore, the impact of the sharpness, amplitude and bias of the arterial input function peak on the kinetic parameter estimation was also studied.
This study (Wang et al. [31]) showed that at a 15% image noise level, the standard deviation in the voxel based 18F-FMISO-trapping rate constant k3 was 13.5%, but only about 5% for the influx rate constant Ki. The peak-to-tail affect the estimation precision of k3 and Ki. Simulation of high (18:1) and low (4.5:1) peak-to-tail input function
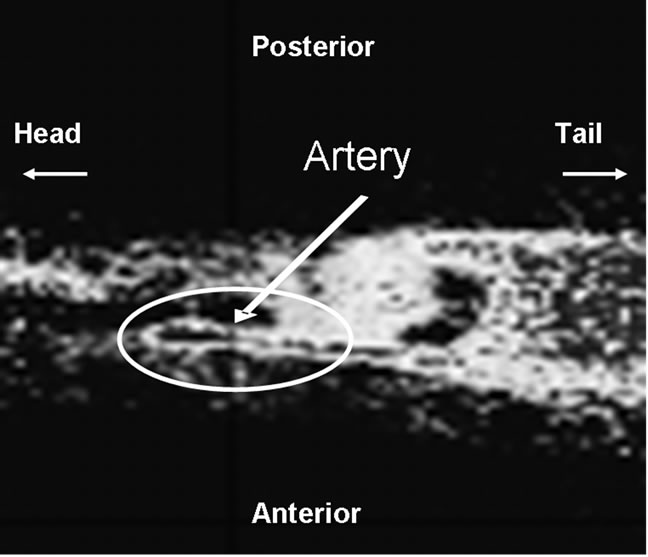
Figure 2. A sagittal microPET image of an animal summed over the first minute post injection with 18F-FMISO. The hottest voxels, corresponding to linear structure within the circle is the artery. The arterial TAC derived from the counts within this region serves as the reference input of compartmental modeling.
resulted in a change in the percent standard deviation from 9% to 20% for k3. The error for the more robust parameter Ki increased from 6% to 9% between the high and low peaked input functions.
3.2. Tissue Activity Concentration Profiles and Parametric Maps of Tumor Hypoxia
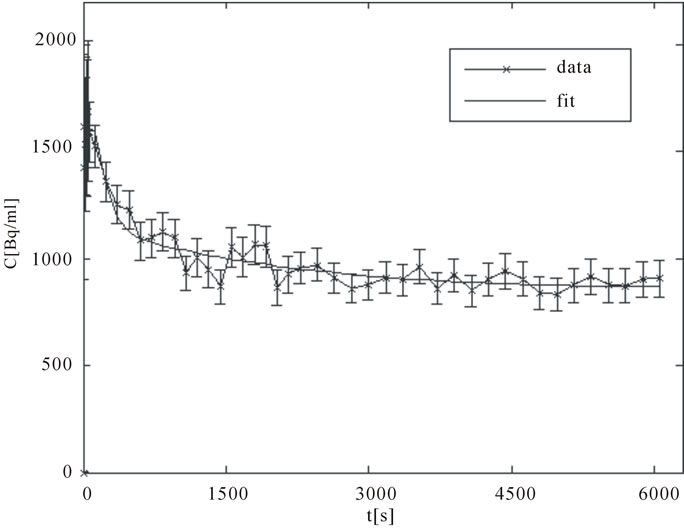
A good arterial TAC, Cp(t), is characterized by a sharp bolus injection peak followed by rapid wash out clearance. The TAC, Cobs(t), for an intra-tumor region of high “late” uptake, presumably corresponding to an hypoxic focus, is characterized by an initial rapid uptake over the several minutes followed by a more gradual but progressive accumulation. In contrast, normoxic tumor areas exhibit an initial rapid uptake corresponding to the initial arterial bolus and diffusion into well-perfused tissue followed by a gradual clearance. Sample TACs corresponding to artery and a hypoxic tumor area are displayed in Figures 3(a) and (b).
By optimizing the model parameters k1, k2, k3 and β, BioGuide™ fits the model to the observed TAC, Cobs(t), resulting in voxelwise k3 and Ki maps. These maps may be displayed as parametric images in which each pixel or voxel intensity represents the magnitude of the respective rate constant. This analysis was conducted for 4 microPET tumor slices, selected from the regions of highest 18F-FMISO uptake, for 7 tumor bearing rats.
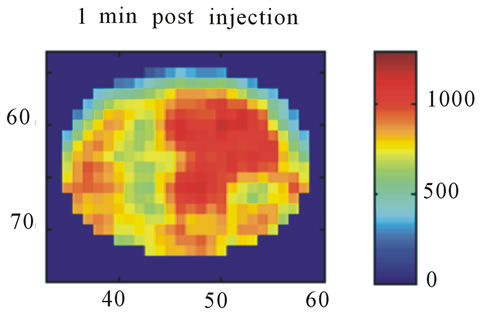
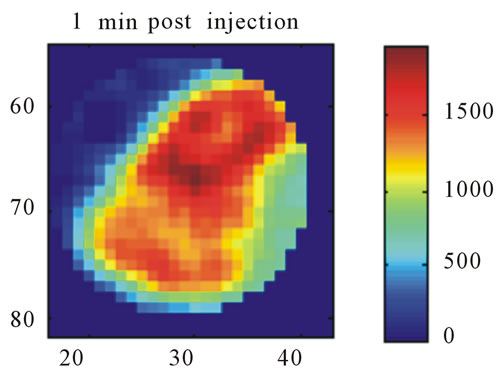
Images resulting from the analysis of the first rat (ID#1) are shown in Figure 4. This figure contains 4 different panels of the same transaxial image plane: 1) the reconstructed microPET™ image of 18F-FMISO at 1 minute post-injection; 2) the reconstructed microPET™ image at 3 hour post injection; 3) the k3 parametric image depicting the rate tracer entrapment; and 4) the parametric image of the flux parameter Ki.
The microPET™ 3-hour post injection image (deemed to represent tumor hypoxia) is complementary to the 1- minute post-injection image which depicts initial 18FFMISO transport into tissue from the vasculature. Both k3 and in particular Ki correspond closely with the distribution of 18F-FMISO in the late 3-hour image for this particular animal tumor. Thus for this tumor, the late 18F-FMISO image provides a good representation of the location of tumor hypoxia relative to the model based parameters k3 and Ki. This is further analyzed in the form of scatter plots (Figure 5) in which the late-time pixel intensity is plotted on the originate verse the estimated k3 and Ki value plotted on the abscissa. Voxel intensities of the late-time image correlate well to both Ki and k3 with a Pearson correlation coefficient rp(k3) = 0.960 and rp(Ki) = 0.971. The Pearson correlation coefficients are above 0.9 for all 4 tumor-slices analyzed (Table 1).
For the second tumor bearing rat (ID#2), there was also close agreement between the late microPET™ images of 18F-FMISO distribution with rp(k3) and rp(Ki) > 0.9 for all central tumor slices. For this tumor the hottest k3 and Ki voxel intensities corresponded to the 18F-FMISO voxels of highest signal.
Figure 6 shows a corresponding 4 panel image display for tumor for rat (ID#3) to that shown in Figure 4 for rat (ID#1). For this tumor neither of the parametric images of Ki nor k3 is similar to the late 3-hour post-injection microPET™ image. In this case, the rate of tracer entrapment determined from the compartmental model is lower, suggestive of a lower level of hypoxia. The appearance of the voxel-wise scatter plots between the parametric rate parameters k3 and Ki and the late time point 18F-FMISO microPET™ image intensities for this tumor are shown in Figure 7. This scatter plot contains a broader dispersion of the data and poorer correlation coefficients ranging for rp(k3) from 0.507 to 0.714 and for rp(Ki) from 0.732 to 0.875 (Table 1). The study of the
 (a)
(a)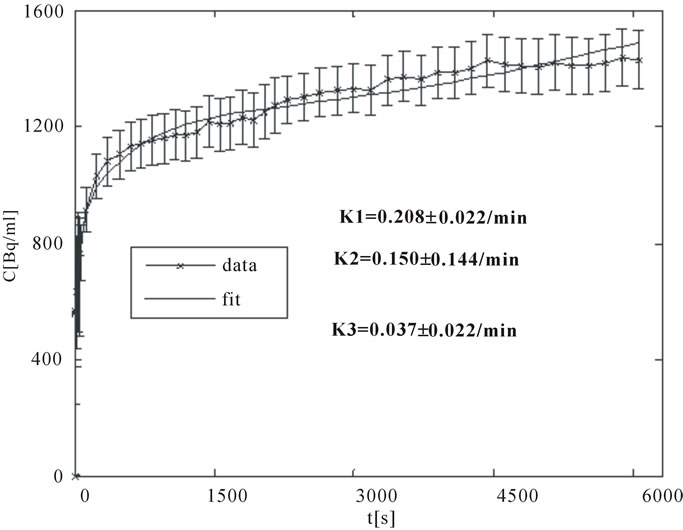 (b)
(b)
Figure 3. (a) A typical TAC for an ROI drawn over an artery (input function); (b) A typical TAC for an expected presumably hypoxic tumor region.
 (a)
(a)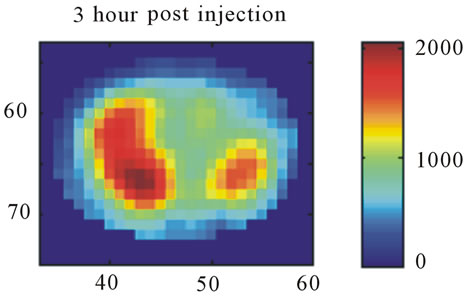 (b)
(b)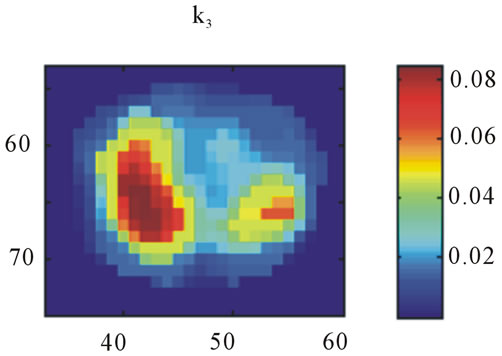 (c)
(c)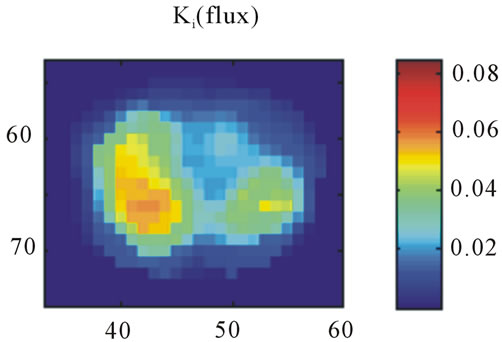 (d)
(d)
Figure 4. A transaxial image plane through the tumor for a selected case showing agreement between late time 18FFMISO image and parametric images. (a) The one-minute data of post injection; (b) The last 10-minutes imaging acquired at 3-hour post-injection (representing the late imaging time point); (c) The k3 parametric map; and (d) The Ki parametric map. The integer values on the abscissa and ordinate represent the voxel location and the intensity scale bars are in units of Bq/ml ((a) and (b)) and s−1 ((c) and (d)).
TAC for tumor voxels corresponding to high image intensity on the late microPET™ images, but with low k3 and Ki values, suggests a clearance profile consistent
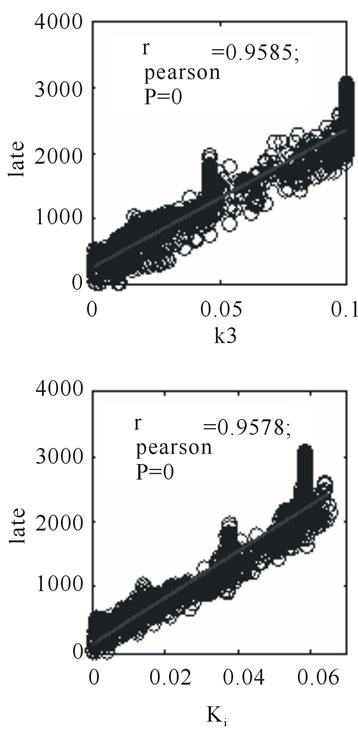
Figure 5. Scatter plots for 3-hour post injection image voxel intensity versus k3 and Ki, respectively, for the same tumor section shown as in Figure 4.
with regions of initial high blood pool activity.
The tumor from rat #4 and #5 also display discordance between the parametric images of tumor hypoxia and the late 18F-FMISO images. Similar to tumor #3, both result in residual regions of high 18F-FMISO uptake on the late microPET™ images which do not appear on the k3 and Ki parametric maps. Tumors #6 showed closer agreement between the parametric k3 and Ki images and the late 18F-FMISO microPET™ images. Tumor #7 exhibited close agreement between the late images and k3 but with a less good correlation with Ki.
The data for all 7 tumors is summarized in Table 1. The mean values of Ki (columns 4) and k3 (column 5) are presented for the tumor ROIs for 4 selected contiguous tumor slices. The Pearson correlation coefficients (rp1 and rp2) between the calculated voxel based estimates for Ki and k3 versus the late 18F-FMISO microPET™ image intensity for the corresponding voxels are given in columns 6 and 7. In columns 8 and 9, the coefficient of variation of Ki and k3 are provided for each of the tumor ROIs (again for 4 tumor slices). In the final tenth column, the coefficient of variation is given for the intensities from the late microPET™ image within the defined tumor ROI. One final observation is that the coefficientof variation for the microPET™ image data is smaller than for the derived parametric images and for some of the tumor considerably smaller.
In summary, 4 of the 7 tumors resulted in spatial agreement between the late 18F-FMISO PET images and the derived parametric maps of k3 and Ki, and 3 showed a
 (a)
(a)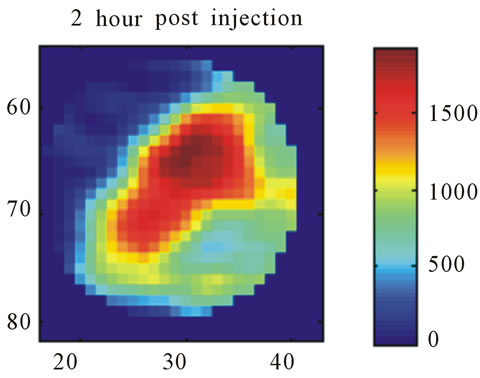 (b)
(b)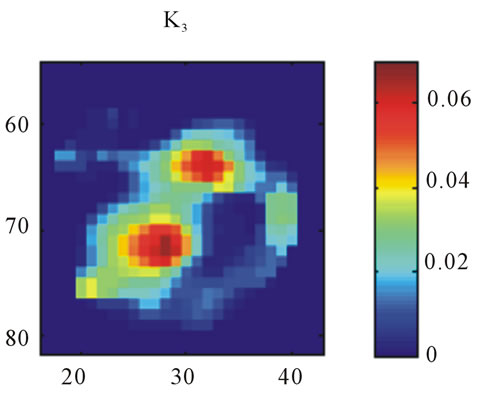 (c)
(c)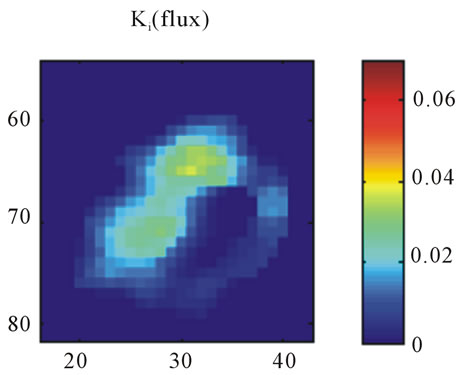 (d)
(d)
Figure 6. A transaxial image plane through the tumor for a selected case in which there is disagreement between late time 18F-FMISO image and parametric images. (a) The one-minute data of post injection; (b) The last 10-minutes imaging acquired at 2-hour post-injection (representing the late imaging time point); (c) The k3 parametric map; and (d) The Ki parametric map.
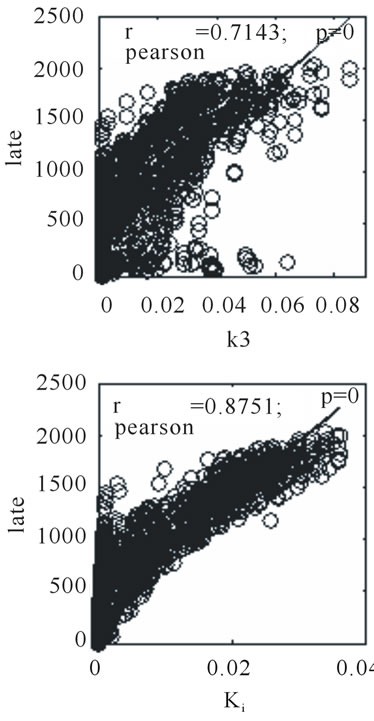
Figure 7. Scatter plots for 2-hour post injection image versus k3 and Ki respectively, for the same tumor section shown as Figure 6.
mismatch between the late 18F-FMISO PET images and the parametric images of k3 and Ki. In the animal studies, only those tumors that exhibit the highest k3 and Ki values result in the closest agreement with the late 18F-FMISO PET images. For tumors with a smaller hypoxia fraction (higher blood flow) exhibiting a longer residual blood pool activity, there are distinctive mismatch between late 18F-FMISO PET image and Ki/k3 maps in animal tumor models.
4. Conclusions
This study contrasted early and late post-injection 18FFMISO microPET images with k3 and Ki parametric maps that define 18F-FMISO trapping rates in tumors as derived by compartmental modeling using the BioGuide™ software package (Philips Healthcare). This study showed a difference in regions of marked hypoxic between compartmental modeling and late post-injection images evaluation. This difference is a potential short-coming of the reliability of late time point imaging of 18F-FMISO for the determination of tumor hypoxia. Our confidence in the parametric image data, in spite of the high noise present in these images as reflected by the greater standard deviation of Table 1, arises from a study of the tumor time activity curves, which exhibit variable clearance slopes. Some regions of high activity on the late 18FFMISO imaging scans appear to represent characteristic blood clearance curves.
A recent study by Bartlett et al. [32] showed an improved correspondence between parametric k3 values and
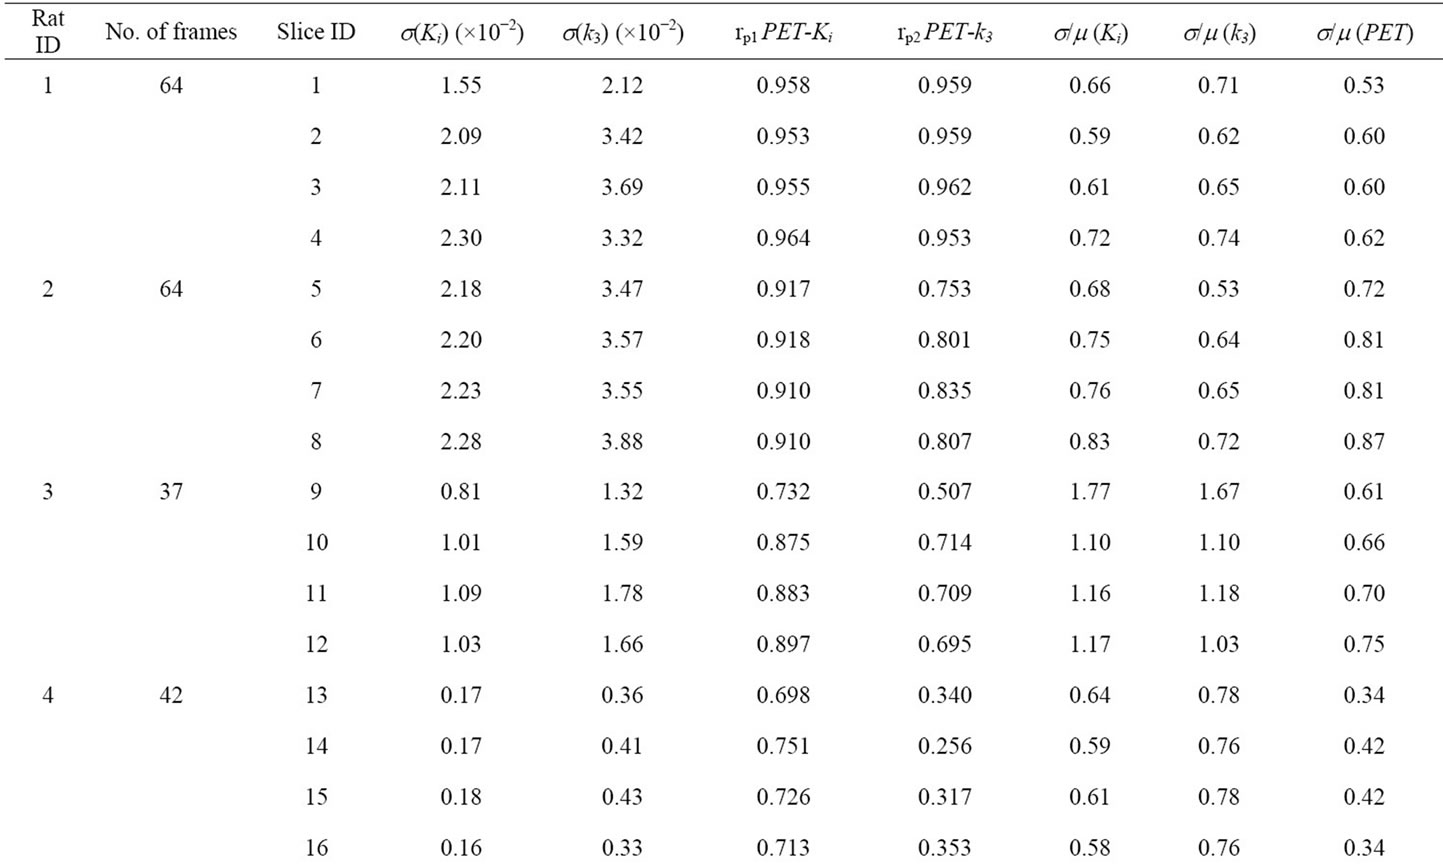
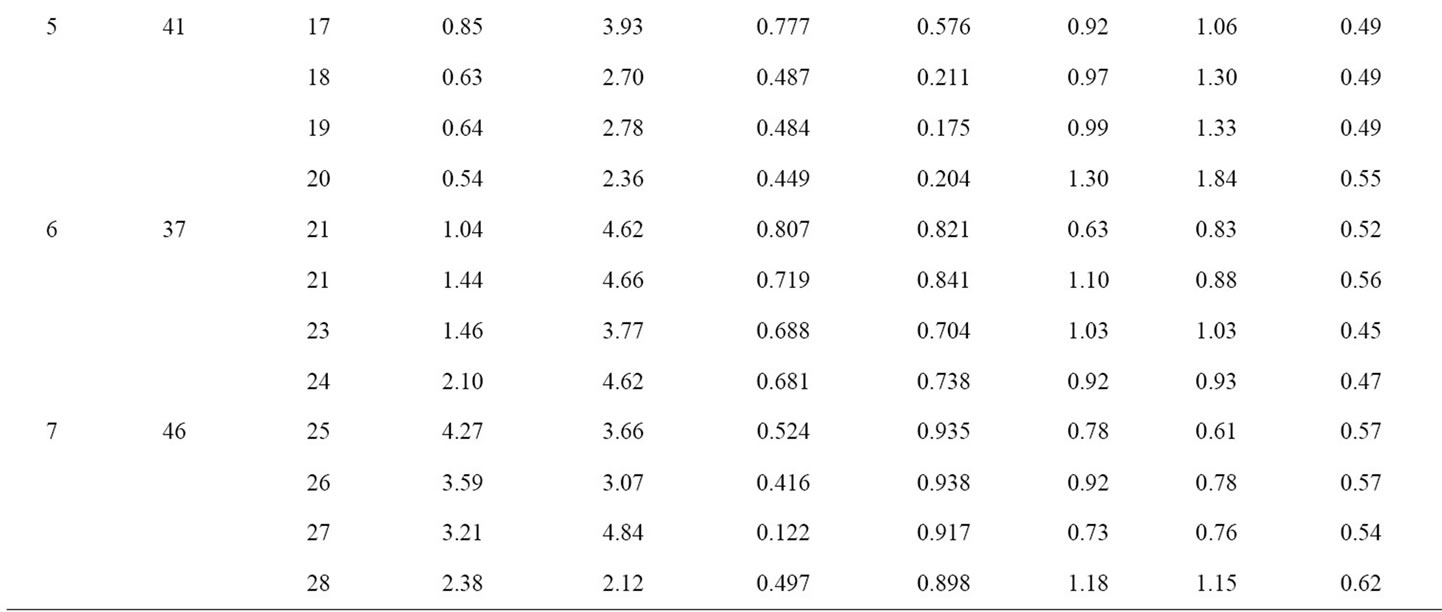
Table 1. Compartmental modeling results for all 7 animals. For each animal, the 4 slices with the highest 18F-FMISO activity were chosen for analysis. Column 1 contains the Rat ID#, column 2 is the number of frame durations (time bins) used for the compartmental analysis and column 3 is the microPET slice number for each tumor. In the table, s(Ki) and s(k3) are the standard deviation of Ki and k3, for the tumor ROI on 4 contiguous slices; rp1 and rp2 are the Pearson correlation coefficients between the voxel-based late 18F-FMISO microPET image intensity and either the corresponding Ki or k3 parametric image map. The final three columns represent the calculated coefficients of variation for Ki, k3, and the late microPET image.
direct PO2 measurements rather than late 18F-FMISO PET image voxel intensities, which provides further support of the significance of parametric hypoxia maps derived from compartmental analysis relative to single time point imaging.
A further conclusion of this study is that “late” time point imaging should be as late as possible post injection consistent with statistically adequate counts for a PET image i.e. 3 hours is definitely to be preferred vis-à-vis 2 hours. This is based on the observation that the two rats imaged out to 3 hour (ID #1 and #2) demonstrated the best agreement with the parametric hypoxia image map. However, visualization of the TAC for the respective regions suggest that also the 2 hour data would have exhibited consistency with the parametric images.
5. Acknowledgements
This work was supported in part by the following NIH grants: P01 CA115675 on Hypoxia Imaging (primary investigator: C. C. Ling), Grant No R24 CA83084 SmallAnimal Imaging Research Program (SAIRP) (primary investigator J. A. Koutcher) and NIH Center Grant No P30 CA08748 (primary investigator: H. Varmus).
REFERENCES
- M. Höckel, C. Knoop, K. Schlenger, B. Vorndran, E. Baussmann, M. Mitze, P. G. Knapstein and P. Vaupel, “Intratumoral PO2 Predicts Survival in Advanced Cancer of the Uterine Cervix,” Radiotherapy & Oncology, Vol. 26, No. 1, 1993, pp. 45-50. doi:10.1016/0167-8140(93)90025-4
- M. Höckel and P. Vaupel, “Biological Consequences of Tumor Hypoxia,” Seminars in Oncology, Vol. 28, No. 2, 2001, pp. 36-41. doi:10.1016/S0093-7754(01)90211-8
- B. Movsas, J. D. Chapman, A. L. Hanlon, E. M. Horwitz, R. E. Greenberg, C. Stobbe, G. E. Hanks and A. Pollack, “Hypoxic Prostate/Muscle PO2 Ratio Predicts for Biochemical Failure in Patients with Prostate Cancer: Preliminary Findings,” Urology, Vol. 60, No. 4, 2002, pp. 634-639. doi:10.1016/S0090-4295(02)01858-7
- W. Choi, S. W. Lee, S. H. Park, J. S. Ryu, S. J. Oh, K. C. Im, E. K. Choi, J. H. Kim, S. H. Jung, S. Kim and S. D. Ahn, “Planning Study for Available Dose of Hypoxic Tumor Volume Using Fluorine-18-Labeled Fluoromisonidazole Positron Emission Tomography for Treatment of the Head and Neck Cancer,” Radiotherapy & Oncology, Vol. 97, No. 2, 2010, pp. 176-182. doi:10.1016/j.radonc.2010.04.012
- I. Toma-Dasu, J. Uhrdin, L. Antonovic, A. Dasu, S. Nuyts, P. Dirix, K. Haustermans and A. Brahme, “Dose Prescription and Treatment Planning Based on FMISOPET Hypoxia,” Acta Oncologica, Vol. 51, No. 2, 2012, pp. 222-230. doi:10.3109/0284186X.2011.599815
- K. Hendrickson, M. Phillips, W. Smith, L. Peterson, K. Krohn and J. Rajendran, “Hypoxia Imaging with [F-18] FMISO-PET in Head and Neck Cancer: Potential for Guiding Intensity Modulated Radiation Therapy in Overcoming Hypoxia-Induced Treatment Resistance,” Radiotherapy & Oncology, Vol. 101, No. 3, 2011, pp. 369-375. doi:10.1016/j.radonc.2011.07.029
- V. Askoxylakis, J. Dinkel, M. Eichinger, B. Stieltjes, G. Sommer, L. G. Strauss, A. Dimitrakopoulou-Strauss, A. Kopp-Schneider, U. Haberkorn, P. E. Huber, M. Bischof, J. Debus and C. Thieke, “Multimodal Hypoxia Imaging and Intensity Modulated Radiation Therapy for Unresectable Non-Small-Cell Lung Cancer: The HIL Trial,” Radiotherapy & Oncology, Vol. 7, No. 1, 2012, p. 157. doi:10.1186/1748-717X-7-157
- B. Wen, M. Urano, J. A. O’Donoghue and C. C. Ling, “Measurements of Partial Oxygen Pressure PO2 Using the OxyLite System in R3327-AT Tumors under Isoflurane Anesthesia,” Radiation Research, Vol. 166, 2006, pp. 512-518. doi:10.1667/RR3602.1
- B. Wen, M. Urano, J. L. Humm, V. E. Seshan, G. C. Li and C. C. Ling, “Comparison of Helzel and OxyLite Systems in the Measurements of Tumor Partial Oxygen Pressure (PO2),” Radiation Research, Vol. 169, No. 1, 2008, pp. 67-75. doi:10.1667/RR0888.1
- J. Bussink, J. H. Kaanders and A. J. van der Kogel, “Tumor Hypoxia at the Micro-Regional Level: Clinical Relevance and Predictive Value of Exogenous and Endogenous Hypoxia Cell Markers,” Radiotherapy & Oncology, Vol. 67, No. 1, 2003, pp. 3-15. doi:10.1016/S0167-8140(03)00011-2
- C. J. Mathias, M. J. Welch, M. R. Kilbourn, P. A. Jerabek, T. B. Patrick, M. E. Raichle, K. A. Krohn, J. S. Rasey and D. W. Shaw, “Radiolabeled Hypoxia Cell Sensitizers: Tracers for Assessment of Ischemia,” Life Sciences, Vol. 41, No. 2, 1987, pp. 199-206. doi:10.1016/0024-3205(87)90494-2
- D. Stypinski, L. I. Wiebe, A. J. McEwan, R. P. Schmidt, Y. K. Tam and J. R. Mercer, “Clinical Pharmacokinetics of 123I-IAZA in Healthy Volunteers,” Nuclear Medicine Communications, Vol. 20, No. 6, 1999, pp. 559-567. doi:10.1097/00006231-199906000-00011
- P. E. Volk, C. A. Mathis, M. D. Prados, J. C. Gilbert and T. F. Budinger, “Hypoxia in Human Gliomas: Demonstration by PET with Fluorine-18-Fluoromisonidazole,” Journal of Nuclear Medicine, Vol. 33, No. 12, 1992, pp. 2133-2137.
- J. S. Rasey, W. J. Koh, M. L. Evans, L. M. Peterson, T. K. Lewellen, M. M. Graham and K. A. Krohn, “Quanfifying Regional Hypoxia in Human Tumors with Positron Emission Tomography of [18F]Fluoromisonidazole: A Pretherapy Study of 37 Patients,” International Journal of Radiation Oncology * Biology * Physics, Vol. 36, No. 2, 1996, pp. 417-428. doi:10.1016/S0360-3016(96)00325-2
- J. G. Rajendran, D. C. Wilson, E. U. Conrad, L. M. Peterson, J. D. Bruckner, J. S. Rasey, L. K. Chin, P. D. Hofstrand, J. R. Grierson, J. F. Eary and K. A. Krohn, “[(18)F]FMISO and [(18)F]FDG PET Imaging in Soft Tissue Sarcomas: Correlation of Hypoxia, Metabolism and VEGF Expression,” European Journal of Nuclear Medicine and Molecular Imaging, Vol. 30, No. 5, 2003, pp. 695-704. doi:10.1007/s00259-002-1096-7
- F. Dehdashti, P. W. Grigsby, M. A. Mintun, J. S. Lewis, B. A. Siegel and M. J. Welch, “Assessing Tumor Hypoxia in Cervical Cancer by Positron Emission Tomography with 60Cu-ATSM: Relationship to Therapeutic Response—A Preliminary Report,” International Journal of Radiation Oncology * Biology * Physics, Vol. 55, No. 5, 2003, pp. 1233-1238. doi:10.1016/S0360-3016(02)04477-2
- K. Lehtiö, V. Oikonen, S. Nyman, T. Grönroos, A. Roivainen, O. Eskola and H. Minn, “Quantifying Tumor Hypoxia with Fluorine-18 Fluoroerythronitroimidazole ([18F]FETNIM) and PET Using the Tumor to Plasma Ratio,” European Journal of Nuclear Medicine and Molecular Imaging, Vol. 30, No. 1, 2003, pp. 101-108. doi:10.1007/s00259-002-1016-x
- R. Beck, B. Röper, J. M. Carlsen, M. C. Huisman, J. A. Lebschi, N. Andratschke, M. Picchio, M. Souvatzoglou, H. J. Machulla and M. Piert, “Pretreatment 18F-FAZA PET Predicts Success of Hypoxia-Directed Radiochemotherapy Using Tirapazamine,” Journal of Nuclear Medicine, Vol. 48, No. 6, 2007, pp. 973-980. doi:10.2967/jnumed.106.038570
- L. S. Ziemer, S. M. Evans, A. V. Kachur, A. L. Shuman, C. A. Cardi, W. T. Jenkins, J. S. Karp, A. Alavi, W. R. Jr. Dolbier and C. J. Koch, “Noninvasive Imaging of Tumor Hypoxia in Rats Using the 2-Nitroimidazole 18F-EF5,” European Journal of Nuclear Medicine and Molecular Imaging, Vol. 34, No. 10, 2007, pp.1566-1575.
- J. G. Rajendran, D. A. Mankoff, F. O’Sullivan, L. M. Peterson, D. L. Schwartz, E. U. Conrad, A. M. Spence, M. Muzi, D. G. Farwell and K. A. Krohn, “Hypoxia and Glucose Metabolism in Malignant Tumors: Evaluation by FMISO and FDG Positron Emission Tomography Imaging,” Clinical Cancer Research, Vol. 10, No. 7, 2004, pp. 2245-2252. doi:10.1158/1078-0432.CCR-0688-3
- W. J. Koh, J. S. Rasey, M. L. Evans, J. R. Grierson, T. K. Lewellen, M. M. Graham, K. A. Krohn and T. W. Griffin, “Imaging of Hypoxia in Human Tumors with [F-18]Fluoromisonidazole,” International Journal of Radiation Oncology * Biology * Physics, Vol. 22, No. 1, 1992, pp. 199- 212. doi:10.1016/0360-3016(92)91001-4
- D. Thorwarth, S. M. Eschmann, F. Paulsen and M. Alber, “A Kinetic Model for Dynamic [18F]-Fmiso PET Data to Analyze Tumor Hypoxia,” Physics in Medicine and Biology, Vol. 50, No. 10, 2005, pp. 2209-2224. doi:10.1088/0031-9155/50/10/002
- P. Zanzonico, J. Campa, D. Polycarpe-Holman, G. Froster, R. Finn, S. Larson, J. Humm and C. Ling, “AnimalSpecific Positioning Molds for Registration of Repeat Imaging Studies: Comparative microPET Imaging of F18- Labeled Fluoro-Deoxyglucose and Fluoro-Misonidazole in Rodent Tumors,” Nuclear Medicine and Biology, Vol. 33, No. 1, 2006, pp. 65-70. doi:10.1016/j.nucmedbio.2005.07.011
- A. Cherif, D. J. Yang, W. Tansey, E. E. Kim and S. Wallace, “Rapid Synthesis of 3-[18F]Fluoro-1-9-(2’-nitro-1’- imidazolyl)-2-propanol([18F]fluoromisonidazole),” Pharmaceutical Research, Vol. 11, No. 3, 1994, pp. 466-469. doi:10.1023/A:1018937709835
- D. J. Yang, S. Wallace, A. Cherif, C. Li, M. B. Gretzer, E. E. Kim and D. A. Podoloff, “Development of F-18- Labled Fluoroerythronitroimidazole as a PET Agent for Imaging Tumor Hypoxia,” Radiology, Vol. 194, No. 3, pp. 795-800.
- M. Zhang, M. Huang, C. Le, P. B. Zanzonico, F. Claus, K. S. Kolbert, K. Martin, C. C. Ling, J. A. Koutcher and J. L. Humm, “Accuracy and Reproducibility of Tumor Positioning during Prolonged and Multi-Modality Animal Imaging Studies,” Physics in Medicine and Biology, Vol. 53, No. 20, 2008, pp. 5867-5882. doi:10.1088/0031-9155/53/20/021
- W. O. Kermack and A. G. McKendrick, “Contributions to the Mathematical Theory oF Epidemics: IV. Analysis of Experimental Epidemics of the Virus Disease Mouse Ectromelia,” Journal of Hygiene, Vol. 37, No. 2, 1937, pp. 172-187. doi:10.1017/S0022172400034902
- R. K. Jain and L. E. Gerlowski, “Extravascular Transport in Normal and Tumor Tissues,” Critical Reviews in Oncology/Hematology, Vol. 5, No. 2, 1986, pp. 115-170. doi:10.1016/S1040-8428(86)80023-3
- J. J. Casciari, M. M. Graham and J. S. Rasey, “A Modeling Approach for Quantifying Tumor Hypoxia with [F- 18]Fluoromisonidazole PET Time-Activity Data, Medical Physics, Vol. 22, No. 7, 1995, pp. 112-139. doi:10.1118/1.597506
- M. Bruehlmeier, U. Roelcke, P. A. Schubiger and S. M. Ametamey, “Assessment of Hypoxia and Perfusion in Human Brain Tumors Using PET with 18F-Fluoromisonidazole and 15O-H2O,” Journal of Nuclear Medicine, Vol. 45, No. 11, 2004, pp. 1851-1859.
- W. Wang, J. C. Georgi, S. A. Nehmeh, M. Narayanan, T. Paulus, M., Bal, J. A. O’Donoghue, P. B. Zanzonico, C. R. Schmidtlein, N. Y. Lee and J. L. Humm, “Evaluation of a Compartmental Model for Estimating Tumor Hypoxia via FMISO Dynamic PET Imaging,” Physics in Medicine and Biology, Vol. 54, No. 10, 2009, pp. 3083-3099. doi:10.1088/0031-9155/54/10/008
- R. M. Bartlett, B. J. Beattie, M. Naryanan, J. C. Georgi, Q. Chen, S. D. Carlin, G. Roble, P. B. Zanzonico, M. Gonen, J. O’Donoghue, A. Fischer, J. L. Humm, “Image-Guided PO2 Probe Measurements Correlated with Parametric Images Derived from 18F-Fluoromisonidazole Small-Animal PET Data in Rats,” Journal of Nuclear Medicine, Vol. 53, No. 10, 2012.