Advances in Remote Sensing
Vol.2 No.1(2013), Article ID:28973,9 pages DOI:10.4236/ars.2013.21005
Land Cover Map Delineation, for Agriculture Development, Case Study in North Sinai, Egypt Using SPOT4 Data and Geographic Information System
National Authority for Remote Sensing and Space Sciences (NARSS), El-Nozha El-Gedida, Cairo, Egypt
Email: *nasser@narss.sci.eg, mohamed.aboelghar@gmail.com
Received November 26, 2012; revised January 2, 2013; accepted January 12, 2013
Keywords: SPOT Data; Land Cover Mapping; LCCS System
ABSTRACT
Land cover map for a part of North Sinai was produced using the FAO—Land Cover Classification System (LCCS) of 2004. The standard FAO classification scheme provides a standardized system of classification that can be used to analyze spatial and temporal land cover variability in the study area. This approach also has the advantage of facilitating the integration of Sinai land cover mapping products to be included with the regional and global land cover datasets. The total study area is 7450 km2 (1,773,842) feddans. The landscape classification was performed on SPOT4 data acquired in 2011 using combined multi-spectral bands of 20 meter spatial resolution. Geographic Information System (GIS) was used to edit the classification result in order to reach the maximum possible accuracy. GIS was also used to include all necessary information. The identified vegetative land cover classes of the study area are irrigated herbaceous crops, irrigated tree crops and rain fed tree crops. The non-vegetated land covers in the study area include: bare rock, bare soil, bare soil stony, bare soil very stony, bare soil salt crusts, loose and shifting sands and sand dunes. The water bodies were classified as artificial perennial water bodies (fish ponds and irrigated canals) and natural perennial water bodies as lakes (standing) and rivers (flowing). Artificial surfaces in the study area include linear and non-linear. The produced maps and the statistics of the different land covers are included in the following sub-sections.
1. Introduction
Development of Sinai Peninsula is the core of the national developing strategy. Sinai has various natural resources and economic potentials such as soil that is suitable for many cropping compositions, natural vegetation with rich and various floristic compositions, surface and ground water and relatively high annual precipitation, exotic places and mineral stocks. Till now, most of Sinai natural resources have not yet used in the proper way which calls for an effective decision support system (DSS) for land use planning in the whole of Sinai peninsula. This system will help all levels of decision taking process to establish the most effective development management policies. The inputs of this system will be different geospatial layers and one of these layers is the current land cover map in Sinai that is the focus of this work. Also, the dynamic situation of land covers in Sinai calls for annual land cover mapping process to support developing plans. Many research studies of land cover mapping were carried out in many parts of Egypt including Sinai; however, these studies did not follow an international standardization. A standardized and up-to-date land cover dataset is required to; assess the condition of the natural resource base, land use plans, modeling water quality, soil erosion, soil health and the sustainable production of food and fiber.
Because of the high need for standardization and compatibility between the different land cover data sets and for the possibility to map, evaluate and monitor wide areas, in 1993, UNEP and FAO organized a meeting to perform actions towards harmonization of data collection and management and to take a first step towards an internationally agreed reference base for land cover and land use [1]. The main objective of the initiative for definition of a reference classification is to respond to the need for standardization and to develop a common integrated approach to all aspects of land cover. This implies a methodology that is applicable at any scale, and which is comprehensive in the sense that any land cover identified anywhere in the world can be readily accommodated. Data generation must be conducted to satisfy the logical approaches of standard land cover classification systems to compare with multi-temporal inter-state and international data. Here, the priori Land Cover Classification System (LCCS) adopted by the FAO can be used as the standard to build a local land cover classification system for Egypt starting from Sinai Peninsula. The FAO LCCS system is applicable in any region of the world regardless of the economic conditions and data source. FAO classification is considered as a concept based on visual classification, which uses the directly visible and knowledge based components on the ground. The FAO document defines the land according to its contribution to productivity. The main resource controlling primary productivity for terrestrial ecosystems can be defined in terms of land: the area of land available, land quality and the soil moisture characteristics [2].
Many studies observed land cover mapping and land cover change detection in Egypt and other arid or semiarid and agricultural productive lands [3]. used ten years of NOAA-AVHRR data to assess and analyze land cover changes in the African continent between 1982 to 1991. The study showed that continuous unidirectional change process affected less than 4% of Sub-Saharan regions during the study period. [4] Studied land cover changes in lake regions of central/south Ethiopia using aerial photographs dated 1972 and 1994 Land sat TM image [5]. Combined black and white aerial photographs with fieldwork and GIS to monitor land cover changes covering 56 years (1940-1996) in parts of Bogota, Colombia [6]. Used Landsat TM data to explore the impacts of land management policies on vegetation structure in two study areas in southern Kalahari Desert in South Africa in the period from 1989 to 1994. [7] Studied land use changes in arid areas in India by visual comparison of satellite imagery, maps and aerial photographs. In Egypt, [8] Used satellite imagery to highlight agricultural boundaries and monitor reclamation process. [9] Used field calibrated, multi-temporal NDVI features derived from ten Landsat TM images dating from 1984 to 1993 to assess land cover changes in Egypt. The study showed a highrate of reclamation in the period from 1986 to 1993.
Therefore, the objectives of the current study is producing recent land cover map for the study area in North Sinai following international standardization and definitions of FAO land cover classification system. The land cover database will fit and reflect the need for reliable information that are essential for sustainable management of agricultural land, natural vegetation as biodiversity, fresh water resources, as well as for environmental protection and land use planning and land degradation.
2. Materials and Methods
Three SPOT4 (HRVIR) images with 20 meter spatial resolution, 26 days temporal resolution and four spectral bands: band 1: green (0.50 - 0.59 um); band 2: red (0.61 - 0.68 um); band 3: near infrared (0.78 - 0.89 µ); and band 4: shortwave infrared (1.58 - 1.75 µ) acquired in the period from 17/02/2011 to 16/06/2011 were used for the current work. The images were geo-referenced using nearest neighbor resembling algorithm with RMS error less than 0.5 pixels. Color composite of bands 4, 3, 2 was generated for the images and visual interpretation was performed. ArcGIS software was used to perform visual interpretation on the (4, 3, 2) color composite imagery to delineate some features in the study area.
Normalized difference vegetation index (NDVI) was combined with the four spectral bands and the combined file was used as input for the classification process. Kmeans unsupervised classification of the full data set with 60 classes was performed. Each spectral class was assigned to a specific land cover. Using ERDAS imagine, the classes that belong to the same land cover class were combined and the combined class was given a specific color, name and code. The output file of the re-coding step was inserted in majority analysis in ENVI using Kernel function. Then, the output file was converted to shape file. Using ArcGIS, Figure 1 shows the methodology; all land cover classes were re-labeled according to FAO land cover classification system. Full description for each land cover class and specific land cover code (User-Code) inserted in attached attribute table. The attribute table divided into many fields based on the different classification levels. Table 1 shows three FAO (LCCS) classification levels that were used for this project.
To organize the classification more easily, FAO system used a dichotomous (divide into sub categories), approach in hierarchical levels and used eight classifiers to group all land cover types at the third level. In other
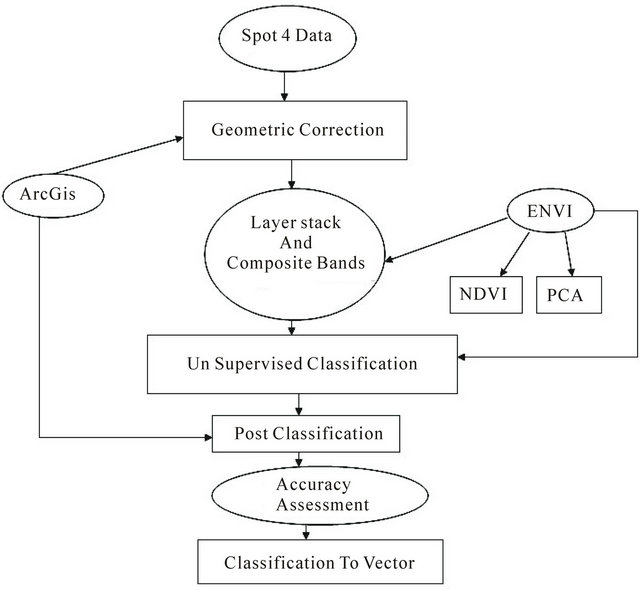
Figure 1. Shows the methodology.
words, any location on the earth surface can be categorized into one of the eight classes without having a conflict. Up to this third level, FAO used the presence of
Table 1. Dichotomous approach to build primary classes in FAO/LCCS.
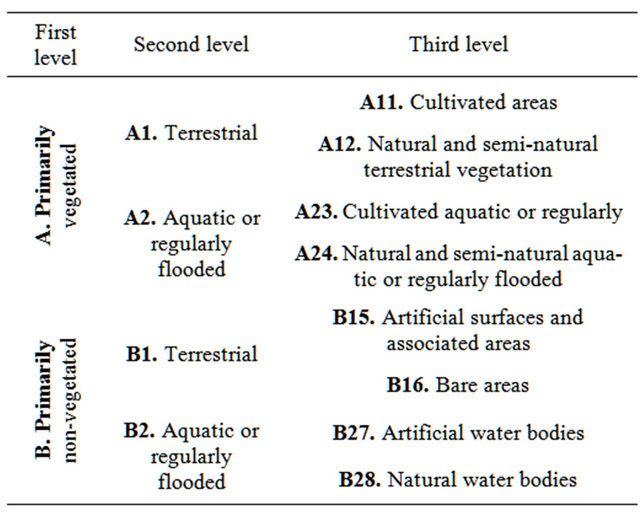
vegetation, edaphic (plant conditions generated by soil and not by climate), and artificiality of land cover for classification. Additionally, the third level of this concept is based on the idea that a land cover class can be defined without considering its location or its type, using a set of pre-selected classifiers. FAO uses a hierarchical approach, or the Modular-Hierarchical Phase, to build additional classifiers, but strictly within one of eight classes identified in third level of the dichotomous phase as explained in Table 1. Under the fourth classification phase, the system uses a set of pre-defined pure land cover classifiers, different from the eight classes. Ground check points and personal experience played a necessary role to perform a more detailed fourth level of classification.
3. Study Area
The study area is a part of Sinai Peninsula. It is bounded by Port Said city and El Suez canal from the West and Lake of Bardawil and the mountain of Maghara from the East with a total area of 7450 km2. Figure 2 shows the
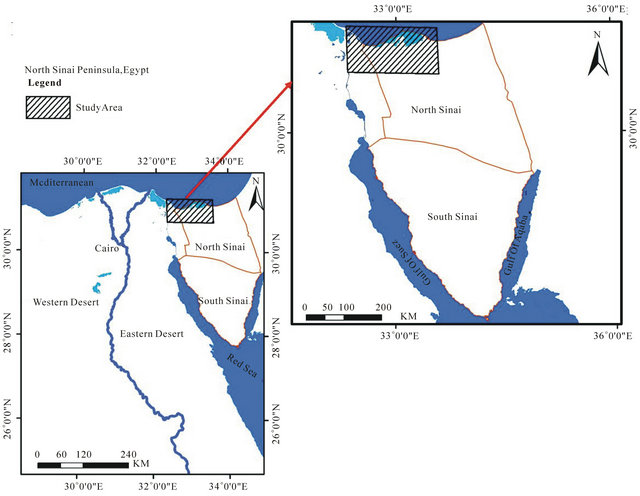
Figure 2. Location map of the study area.
study area that located between 30˚40'00" and 31˚20'00" North and between 32˚30'00" and 33˚30'00" East. The study area includes the zone of El-Sheikh Gaber Al-Sabah canal that is the back stone of El-Salam canal project (one of the national major developing projects for the past two decades). The core of this project is building a siphon under the Suez Canal and constructing Al-Sheikh Gaber Canal to cultivate 1680 km2 (400 thousand feddans) east of the Suez Canal. The whole project area is extended in governorates of Damietta, Al-Daqahlia, AlSharqia, Port Said, Ismailia and north Sinai; it lies between 31˚45' & 34˚05' East and 30˚42' & 31˚24' North.
An artificial image is a combination of various artificial classes built on the basis of specific sediment types acquired from imagery and field spectra. The clustering techniques applied to the artificial data sets result in clusters. The comparison between classes and clusters indicates the accuracy of the classification. Confusion matrices are used to assess this accuracy as they compare the relationship between the artificial data as the reference data and the “corresponding” results of the unsupervised classification techniques [10]. Yet with unsupervised classification, a resulting cluster is not automatically labeled nor identified as corresponding to a specific class. So, a class is investigated with respect to all clusters, and the cluster containing most of the pixels closest to the mean of that class is considered as its corresponding cluster. Based on the confusion matrix, the accuracy is then expressed in terms of the kappa statistic (k) where the difference between the clustering accuracy and the chance agreement between the classes and the clusters is calculated [10]. For the current work, one hundred random points were used for each class to examine the classification accuracy for each class and the overall accuracy.
4. Results and Discussion
The identified land cover classes of the study area are irrigated herbaceous crops, irrigated tree crops, rain fed tree crops, bare rock, bare soil, bare soil stony, bare soil very stony, bare soil salt crusts, loose and shifting sands, sand dunes, artificial perennial water bodies (fish ponds and irrigated canals), natural perennial water bodies as lakes (standing) and rivers (flowing), linear and nonlinear surface features. More details about each land cover types in the study area are shown in the following parts.
4.1. Cultivated and Managed Terrestrial Areas
This class refers to areas where the natural vegetation has been removed or modified and replaced by other types of vegetative cover of anthropogenic origin. This vegetation is artificial and requires human activities to maintain it in the long term. In between the human activities, or before starting crop cultivation, the surface can be temporarily without vegetative cover. Its seasonal phonological appearance can be regularly modified by humans (e.g. tillage, harvest, and irrigation). All vegetation that is planted or cultivated with intent to harvest is included in this class (e.g. wheat fields, orchards, etc.). Cultivated and managed area is concentrated in the western part of the study area that is mainly cultivated by cropland. The source of the irrigation water is El-Sheikh Gaber canal or ground water. Some sparse vegetated areas, cultivated mainly by orchards are distributed in the study area.
4.2. Non-Vegetated Areas
This class includes areas that have a total vegetative cover of less than four percent for at least 10 months of the year or an absence of Woody or Herbaceous life forms and with less than 20 percent cover of Lichens/ Mosses. Bare lands represent areas that do not have an artificial cover as a result of human activities. These areas include areas with less than four percent vegetative cover. This group is presented in the study area through the following land covers bare rock, bare soil, bare soil stony, bare soil very stony, bare soil salt crusts, loose and shifting sands and sand dunes. Figures 3 and 4 show examples of this land cover.
4.3. Artificial Surfaces and Associated Areas
This class describes areas that have an artificial cover as a result of human activities such as construction (cities, towns, and transportation), extraction (open mines and quarries) or waste disposal. Figure 5 shows an example of this land cover in the study area including linear feature as road and non-linear feature as cities.
4.4. Water Bodies
This class refers to areas that are naturally covered by water, such as lakes and rivers. In the case of rivers, the lack of vegetation cover is often due to high flow rates and/or steep banks. In the case of lakes, their geological origin affects the life conditions for aquatic vegetation. The following circumstances might cause water surfaces to be without vegetation cover: depth, rocky basins, rocky and/or steep shorelines, infertile washed-in material, hard and coarse substrates. The water bodies in the study area include artificial perennial water bodies (fish ponds and irrigated canals) and natural perennial water bodies as lakes (standing) and rivers (flowing). An example of this land cover is presented in Figures 6 and 7.
The output of the whole process are classified images with attached attribute tables that shows the information about all FAO land cover classes that are included in each image. These land cover classes were be the basis for the second phase of the process which is producing land use maps. The whole land cover map is shown in Figure 8 and statistics of the area of each land cover is explained in Table 2. Accuracy assessment was carried out using one hundred ground checkpoints distributed in the study area and the overall accuracy was 96%.
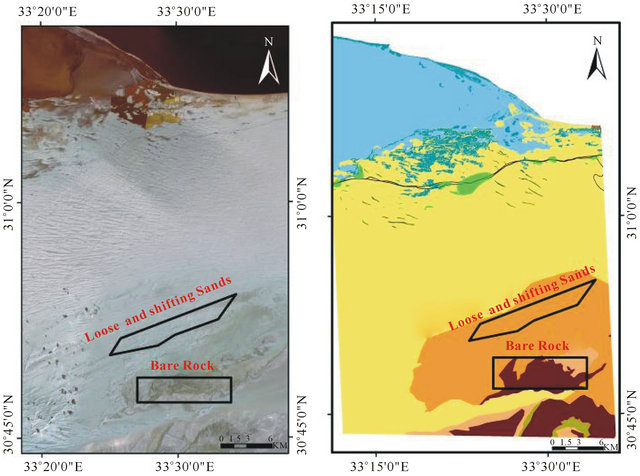
Figure 3. Bare rock, loose and shifting sands in the study area.
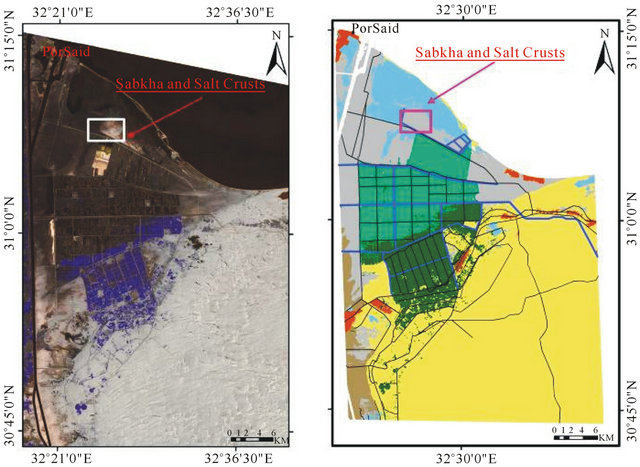
Figure 4. Salt crusts in the northern part of the study area.
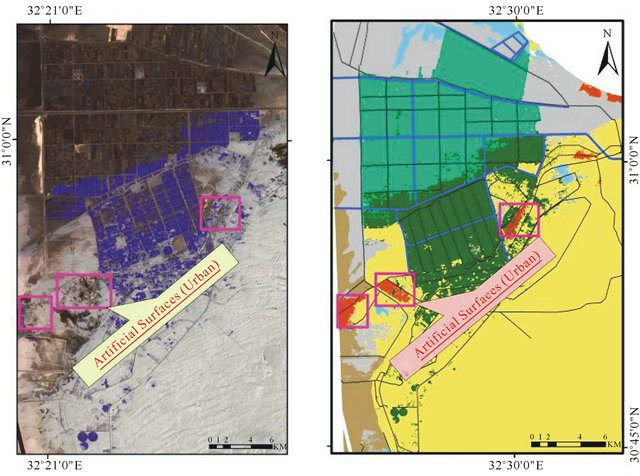
Figure 5. Urban areas in the study area.
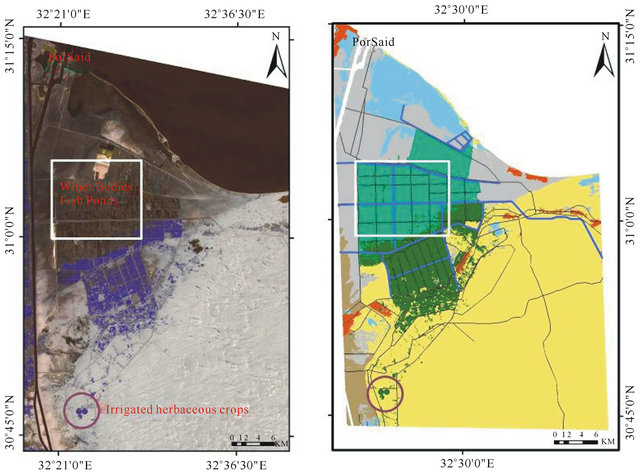
Figure 6. Fish ponds as an example of water bodies.
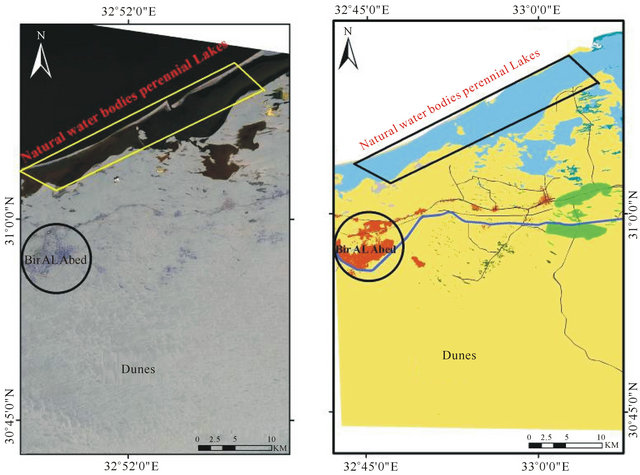
Figure 7. Natural water bodies (lake) in the study area.
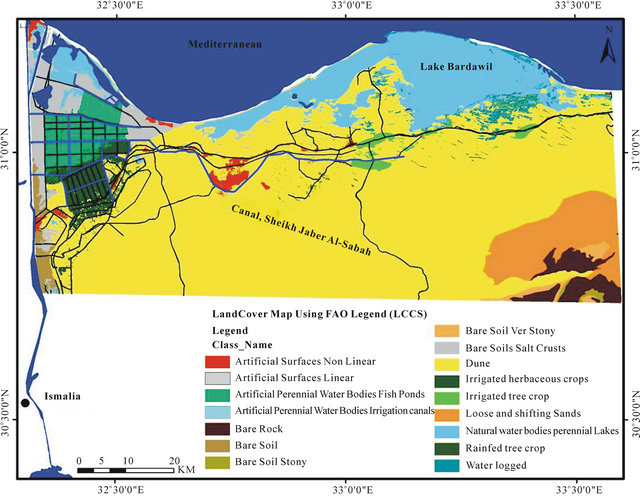
Figure 8. Land cover map of the study area.
As shown in the table that the largest land cover in the study area is dunes while the smallest land cover is the bare soil (stony). The total artificial surfaces (non-linear) that is mainly small cities are 56 km2 while the total road area is 40 km2. The total bare soil land cover with the highest priority of agricultural reclamation is 53 km2 concentrated in the western part of the study area. The source of irrigation water in this area is mainly (ElSheikh Gaber Canal). Irrigated cultivated areas are divided into herbaceous crops with 140 km2 and irrigated tree crops over almost 48 km2 while rainfed tree crops occupy only 10 km2. The result of the accuracy assessment is explained in Table 3. The percentage of accuracy for all classes ranged from 94% to 99% and the overall
Table 2. The area of the different land covers in the study area.
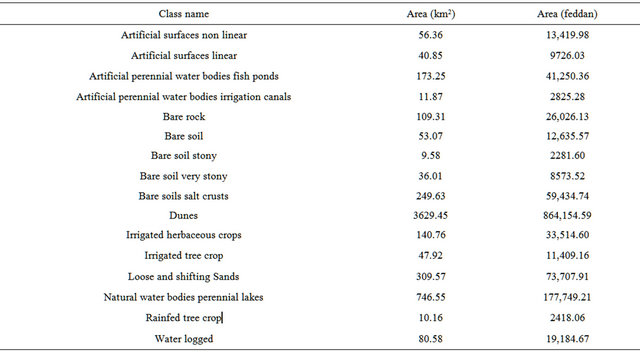
Table 3. The percentage of accuracy for all classes.
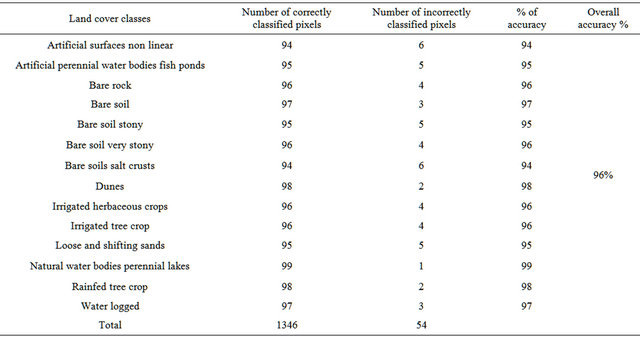
accuracy was 96.14%.
In this work, we used SPOT 4 data that were acquired during the period of the maximum natural vegetation. Some parts of natural vegetation could be classified to bare land in other seasons. Some areas that were prepared to be cultivated were classified as bare land; however, field observation explained that these areas were converted to be cultivated lands. Mixed land cover classes may require higher resolution of satellite imagery to maximize the accuracy of the produced land cover.
5. Conclusion
As a part of a project to produce decision support system for land use policy, SPOT4 data for a case study in northern Sinai were used to produce land cover map as a geospatial layer that will be concluded in the proposed system. Unsupervised classification with visual interpretation and ground check points were used to produce the map with accuracy exceeded 96%. GIS was used to delineate some features in order to increase the overall accuracy of the classification. It was used also to attach all necessary information and produce the map. As explained through the produced map and statistics that the largest land cover in the study area is sand dunes while the smallest ones is stony bare soil. The map showed the bare lands with the current priority for cultivation with a total area of 53 km2. Processing of salt crusts and dunes land covers should be investigated before considering these land covers in any future developing strategy in the study area. The second step of this work will be producing land use map of the study area.
REFERENCES
- UNEP/FAO, “Report of the UNEP/FAO Expert Meeting on Harmonizing Land Cover and Land Use Classifications,” GEMS Report Series, No. 25, Geneva, 23-25 November 1993.
- A. Di Gregorio and L. J. M. Jansen, “FAO Land Cover Classification System: A Dichotomous, Modular-Hierarchical Approach,” The Federal Geographic Data Committee Meeting, Vegetation Subcommittee and Earth Cover Working Group, Washington, 15-17 October 1996.
- E. F. Lambin and D. Ehrlich, “Land—Cover Changes in Sub-Saharan Africa (1982-1991): Application of a Change Index Based on Remotely Sensed Surface Temperature and Vegetation Indices at a Continental Scale,” Remote Sensing of Environment, Vol. 61, No. 2, 1997, pp. 181- 200. doi:10.1016/S0034-4257(97)00001-1
- F. Rembold, S. Carnicelli, M. Nori and M, Ferrari, “Use of Aerial Photographs, Landsat TM Imagery and Multidisciplinary Field Survey for Land—Cover Change Analysis in the Lakes Region (Ethiopia),” International Journal of Applied Earth Observation and Geoinformation, Vol. 2, No. 3, 2000, pp. 181-189. doi:10.1016/S0303-2434(00)85012-6
- J. E. Mendoza and R. Etter, “Multitemporal Analysis (1940-1996) of Land Cover Changes in the Southwestern Bogota Highplain (Colombia),” Landscape and Urban Planning, Vol. 59, No. 3, 2002, pp. 147-158. doi:10.1016/S0169-2046(02)00012-9
- A. R. Palmer and A. F. van Rooyen, “Detecting Vegetation Change in the Southern Kalahari Using Landsat TM data,” Journal of Arid Environments, Vol. 39, No. 2, 1998, pp. 143-153. doi:10.1006/jare.1998.0399
- Ram and A. S. Kolarkar, “Remote Sensing Application in Monitoring Land-Use Changes in Arid Rajasthan,” International Journal of Remote Sensing, Vol. 14, No. 17, 1993, pp. 3191-3220. doi:10.1080/01431169308904433
- Sadek, “Use of Landsat Imagery for Monitoring Agricultural Expansion of East Nile Delta, Egypt,” Egyptian Journal of Soil Science, Vol. 33, No. 1, 1993, pp. 23-24.
- M. P. Lenney, C. E. Woodcock, J. B. Collins and H. Hamdi, “The Status of Agricultural Lands in Egypt: The Use of Multi Temporal NDVI Features Derived from Landsat TM,” Remote Sensing of Environment, Vol. 56, No. 1, 1997, pp. 8-20. doi:10.1016/0034-4257(95)00152-2
- T. M. Lillesand and R. W. Kiefer, “Remote Sensing and Image Interpretation,” 4th Edition, Wiley & Sons, Chichester, 2000.
NOTES
*Corresponding author.