American Journal of Plant Sciences
Vol.05 No.25(2014), Article ID:52348,9 pages
10.4236/ajps.2014.525389
The Effect of Fusarium Inoculation and Fungicide Application on Concentrations of Flavonoids (Apigenin, Kaempferol, Luteolin, Naringenin, Quercetin, Rutin, Vitexin) in Winter Wheat Cultivars
Maciej Buśko1, Tomasz Góral2, Anna Ostrowska1, Anna Matysiak1, Dorota Walentyn-Góral2, Juliusz Perkowski1
1Department of Chemistry, Poznan University of Life Sciences, Poznan, Poland
2Department of Plant Pathology, Plant Breeding and Acclimatization Institute―NRI, Błonie, Poland
Email: julperk@up.poznan.pl
Academic Editor: Natalia Rodiuc, Embrapa/INRA, Brazil/France
Copyright © 2014 by authors and Scientific Research Publishing Inc.
This work is licensed under the Creative Commons Attribution International License (CC BY).
http://creativecommons.org/licenses/by/4.0/


Received 30 October 2014; revised 29 November 2014; accepted 8 December 2014
ABSTRACT
Grain of 30 winter wheat cultivars was screened for the content of seven flavonoids (apigenin, kaempferol, luteolin, naringenin, quercetin, rutin, vitexin). In total, 90 samples were analyzed, belonging to three combinations: the control, samples inoculated with Fusarium culmorum, and samples inoculated with Fusarium culmorum and protected with fungicides (Prosaro, Topsin M). Analyzed flavonoids were detected in all tested samples. The highest concentrations were recorded for quercetin (512.9 mg/kg) and luteolin (458.4 mg/kg). Concentration of all compounds was the highest in the inoculated samples, while in the control and in the inoculated samples treated with fungicides their contents were significantly lower and similar, as confirmed by the statistical analysis conducted by multivariate methods. In most cases, significant correlations were obtained between individual flavonoids. Such correlations were observed for all flavonoids in samples covering all the three variants and almost all flavonoids in the inoculated samples. The lowest number of correlations was recorded for samples treated with fungicides.
Keywords:
Winter Wheat, Flavonoids, Fusarium Head Blight, Inoculation, Prothioconazole,
Thiophanate Methyl

1. Introduction
Secondary metabolites of plants are extremely important compounds from the biological point of view, although they are not essential for their survival. They are formed in the course of distinct biochemical processes. They are species-specific and are formed only in certain cells, tissues or organs [1] .
Some of the most important members of this group of compounds are flavonoids, belonging to the class of phenolics. They are found in cereals either as free molecules (aglycons), or in combination with sugar radicals forming glycosides [2] . Flavonoids are considered to be derivatives of benzo-γ-pyrone. They are composed of two benzene rings bonded with three carbon atoms, and they have two aromatic rings, A and B, forming a heterocyclic system (Figure 1). To date, approximately 800 different flavonoids have been identified. They differ in the number and position of hydroxyl groups in both rings, oxidation state of the carbon bonding, type of the glycoside bond, and the occurrence of dimeric systems. One of the most important properties of phenolic compounds is their antioxidant action [3] , which is closely linked to their chemical structure. Most of them are in the form of O-glycosides, the sugar radical of which is composed of one to five molecules of simple sugars. Some flavonoids are also found in the form of C-glycosides [2] . The mode of action of these compounds depends on the number of hydroxyl groups and their mutual position in the aromatic ring. Flavonoids are a group of substances whose biological effect on humans is connected first of all with blood vessels and the circulatory system, although some of them have a more extensive systemic effect. Such flavonoids as apigenin, luteolin and kaempferol directly influence vasodilation. Studies have demonstrated that these flavonoids cause concentration-de- pendent relaxation responses in concentrated arterial rings [4] . These compounds also exhibit advantageous properties by sealing blood vessels, having an anti-inflammatory effect [5] .
Through the application of state-of-the-art instrumental methods it is possible to separate and identify individual flavonoids (following their isolation from the plant material). The most frequently applied separation methods include high performance liquid chromatography (HPLC) and ultra-performance liquid chromatography (UPLC). These metabolites are detected in the eluent from chromatographic columns using UV/VIS and fluorescent spectrophotometers and mass spectrometry detectors [6] .
Wheat samples have been found to contain such flavonoids as anthocyanins, flavones and flavanones, i.e. cyanidin 3-galactoside [7] , cyanidin 3-glucoside [7] , cyanidin 3-rutinoside [8] , peonidin 3-glucoside [8] , petunidin 3-rutinoside [8] , apigenin glycosides [9] , tricin [9] , luteolin glucoside [10] , naringenin [5] , etc.

Figure 1. Chemical structure of flavonoids.
Fusarium head blight is one of the most important cereal diseases. It causes considerable losses in plant breeding and results in the formation of toxic secondary metabolites-mycotoxins. Fungicides are used to reduce its intensity and limit its consequences. It was found that under field conditions fungicides containing triazoles (e.g. prothioconazole) or benzimidazole (e.g. thiophanate methyl) effectively controlled a Fusarium head blight epidemic [11] [12] . On the other hand, some fungicides (e.g. strobilurin) were ineffective in Fusarium head blight control and even stimulated mycotoxin production [13] .
The aim of this study was to determine whether analyzed winter wheat grain samples contain analyzed flavonoids (apigenin, kaempferol, luteolin, naringenin, quercetin, rutin, vitexin) and at what concentrations, as well as what interrelations may be observed between them. Another aim was to investigate the effect of environmental conditions in these cultures by analyzing the control with no interference, samples inoculated with the fungus Fusarium culmorum and those inoculated with Fusarium culmorum with the simultaneous application of fungicide protection.
2. Material and Methods
2.1. Field Experiments
Thirty cultivars of winter wheat (Triticum aestivum L.) were evaluated. The cultivars are listed in the Polish National List of the Research Centre for Cultivar Testing (COBORU) and were added to the list between 1998 (“Mewa”) and 2009 (“Belenus”) [14] . The cultivars differed in their morphological characters, resistance to diseases and pedigree.
The field experiment was established as a split-plot design. Wheat cultivars were sown on 1 m2 plots. Three main treatments were included: the non-fungicide treated control (C), chemical control of Fusarium head blight (incited by inoculation) with fungicides (F), and head inoculations (I). For treatments F and I, the same set of Fusarium culmorum isolates was applied as described below.
Fusarium head blight (FHB) was controlled with two fungicides: Prosaro 250 EC (Bayer CropScience), which is a combination of two active ingredients, tebuconazole (125 g/l) and prothioconazole (125 g/l); and Topsin M (Sumi Agro), whose active ingredient is thiophanate methyl (500 g/l). Both fungicides are recommended for FHB control. Prothioconazole and tebuconazole showed superior efficacy in reducing Fusarium head blight disease severity and toxin contamination [11] [15] . Thiophanate methyl, e.g. registered in Germany as DON-Q fungicide (Nisso Chemical Europe GmbH.), was highly effective in preventing grain contamination with mycotoxins [12] . Prosaro was applied at the heading stage (BBCH 55 - 59) and Topsin M after flowering at stages BBCH 69 - 71 of wheat. Tebuconazole and thiophanate methyl are the most effective in FHB/DON reduction when applied at stages BBCH 61 - 71 [16] [17] . Prothioconazole is a systemic fungicide and has preventive properties [17] . As at the flowering stage, wheat was inoculated with F. culmorum (described below), Prosaro was applied before the flowering stage (BBCH 59 - 60) and Topsin M at the watery ripe stage (BBCH 71).
Three Fusarium culmorum isolates producing deoxynivalenol (DON) (KF846, ZFR112) and nivalenol (NIV) (KF350) were applied for inoculum production [18] . Isolates were incubated with autoclaved wheat grain in glass flasks for about 4 weeks and next exposed to near UV light (“black light” 350 nm) under a 16-h photoperiod for 3 weeks at 15˚C. The mycelium-colonized grain was air dried and stored in a refrigerator at 4˚C until usage.
On the day of inoculation, grain with Fusarium mycelium was suspended in tap water for 2 h and then filtered to obtain a conidial suspension. The suspensions from each of the three isolates were adjusted to 5 × 10⁵ spores/ ml with the aid of a hemocytometer. Equal volumes of the suspensions were mixed.
Wheat heads were sprayed with a spore suspension at anthesis at a rate of 100 ml∙m−2. Inoculations were performed individually on each plot at the beginning of anthesis and repeated about 3 days later at full anthesis. At this stage, wheat is most sensitive to Fusarium infection. Inoculations were carried out in the evenings, when relative air humidity was high. Fusarium head blight was evaluated to check the effectiveness of inoculations. After ripening, 50 randomly selected heads were harvested manually from each plot and threshed with a laboratory thresher at a low wind speed to prevent loss of low-weight infected kernels. Kernel damage with Fusarium was assessed visually.
2.2. Flavonoid Analysis
2.2.1. Chemicals and Reagents
Methanol and acetonitrile were HPLC grade (Sigma-Aldrich, St. Louis, MO, USA); diethyl ether, formic acid, hydrochloric acid, and sodium hydroxide were purchased from POCH S.A. (Gliwice, Poland); deionized water was prepared using a Millipore Milli-Q system (Millipore, MA, USA). The standards of vitexin, rutin, quercetin, luteolin, apigenin, naringenin and kaempferol were purchased from Sigma-Aldrich (St. Louis, MO, USA). These reference compounds were dissolved in methanol and filtered through a 0.22-μm membrane filter prior to injection into the UPLC system.
2.2.2. Phenolic Compound Extraction
Phenolic compounds were determined following basic and then acid hydrolysis. A sample of 0.2 g of ground grain was placed into a culture tube and subjected to base hydrolysis using 1 mL of H2O and 4 mL of 2 M NaOH followed by acid hydrolysis-3 mL of 6 M HCl at 95˚C. Phenolic acids after each hydrolysis step were extracted from the inorganic phase using dieter ether. Extracts were evaporated to dryness in a gentle stream of a high purity nitrogen using a RapidVap Evaporator (Labconco, Kansas, MO, USA). The extracts were stored at −25˚C until analysis.
2.2.3. UPLC Analysis
Contents of phenolic compounds were analyzed using an Acquity H class UPLC system equipped with a Waters Acquity PDA detector (Waters, USA). Chromatographic separation was performed on a Acquity UPLC HSS T3 C18 column (150 mm × 2.1 mm, particle size 1.8 μm) (Waters, Ireland). The eluents were: A, water 0.1% formic acid; B, acetonitrile 0.1% formic acid (v/v). The gradient program was as follows: flow 0.4 mL/min 5% B (2 min), 5% - 16% B (5 min), 16% B (3 min), 16% - 20% B (7 min), 20% - 28% B (11 min) flow 0.45 mL/min, 28% (1 min), 28% - 60% B (3 min) flow 5.0 mL/min, 60% - 95% B (1 min), 65% B (1 min), 95% - 5% B (0.1 min) flow 0.4 mL/min, 5% B (1.9 min).
Measurements of phenolic compound concentrations were performed using an external standard at wavelengths λ = 320 (vitexin, rutin, quercetin, luteolin, apigenin, kaempferol) and λ = 280 (naringenin). Compounds were identified based on a comparison of retention times of the examined peak with that of the standard and by adding a specific amount of the standard to the tested sample and repeated analyses. Retention times for phenolic compounds were as follows: vitexin 18.32 min, rutin 19.13 min, quercetin 29.68 min, luteolin 29.98 min, naringenin 31.53 min, apigenin 31.79 min and kaempferol 31.89 min. The limit of detection was 1 mg/kg.
2.3. Statistical Analysis
The statistical analysis was performed using Microsoft Excel 2010/XLSTAT-Pro (Version 2014.4.08, Addinsoft, Inc., Brooklyn, NY, USA).
Differences between the three experimental variants for seven flavonoids were compared using the Kruskal- Wallis one-way analysis of variance (XLSTAT procedure: Comparison of k samples―Kruskal-Wallis, Friedman, ...). The Kruskal-Wallis test was selected because most of the variables did not follow a normal distribution. Multiple pairwise comparisons were performed using the Steel-Dwass-Critchlow-Fligner method (XLSTAT procedure: Comparison of k samples―Kruskal-Wallis, Friedman, ...) [19] .
The relationships between flavonoid concentrations for grouped values of all variants and separately for individual variant (C, F, I) values were investigated by Pearson correlation tests (XLSTAT procedure: Correlation tests). Prior to analysis, data which did not follow a normal distribution were log10 transformed to normalize residual distributions.
Multivariate data analysis methods were applied to the data on flavonoid concentrations. Discriminant analysis (XLSTAT procedure: Discriminant analysis DA) was used to evaluate the ability to measure amounts of seven flavonoids (predictors) to discriminate between three variants of grain samples of winter wheat (C, F, I) (grouping variable). Principal component analysis (XLSTAT procedure: Principal Component Analysis PCA) was used to show how the different samples are distributed with respect to the main variation described in the first two components and how variables influence the construction of the two components. PCA results also revealed associations among variables measured by the angle between variable vectors.
3. Results and Discussion
Symptoms of Fusarium head blight were observed on inoculated plots as well as inoculated and fungicide sprayed plots. No FHB was found on the control plots. Average FHB severity on inoculated plots was 30.0% and kernel damage proportion was 41.4%. FHB severity on protected plots was reduced twice and amounted to 16.0%. Likewise, Fusarium kernel damage was reduced more than twice and amounted to 22.4%.
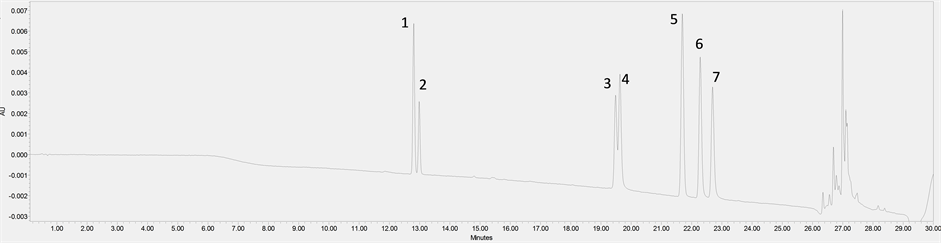
Analysis of phenolic contents is at present one of the most essential analyses indicating the content of metabolites in cereals. So far, phenolic acids have been the most frequently analyzed chemical compounds from this group, and several studies have been published on this subject [1] [2] [5] [6] . Analysis of flavonoid contents in wheat grain is much less known. Abdel-Aal et al. (2006) when analyzing selected anthocyanidin derivatives in wheat grain reported their mean concentrations as cyanidin 3-glucoside 28.14 mg/kg, peonidin 3-glucoside 0.81 mg/kg and cyanidin 3-galactoside 0.98 mg/kg [7] . In our research, we focused on 3 flavones (apigenin, luteolin, vitexin) and 4 flavanones (naringenin, kaempferol, rutin, quercetin) [2] . The analytical method developed and applied in this study, using rapid liquid chromatography (Ultra Performance Liquid Chromatography-UPLC), proved to be effective and made possible accurate qualitative and quantitative separation of these compounds, as indicated by the presented chromatograms (Figure 2(a), Figure 2(b)).
The results are given in Table 1. Concentrations of individual compounds varied widely. The highest concentration of flavonoids was found for inoculated samples (on average e.g. luteolin 458.4 mg/kg, quercetin 512.9 mg/kg). It was significantly lower for the control (mean 7.1 mg/kg and 6.9 mg/kg, respectively) and unexpectedly also for fungicide-treated samples (mean e.g. luteolin 9.9 mg/kg, quercetin 4.8 mg/kg). This was confirmed by the Kruskal-Wallis test, which showed significant differences between variant I of the experiment and variants C and F. Only for naringenin and vitexin were differences of low significance (p < 0.05) observed between variants C and F. The data were next analyzed using the discriminant analysis, which confirmed previous observations and indicated joint clustering of samples belonging to variants F and C (Figure 3). The Wilks’ lambda value of 0.061 showed significance of the discriminant function at p < 0.0001. The model explained 93.9% of the variation in the grouping variable, i.e. whether a sample belongs to group C, F or I. The discriminatory power distinguishing samples into three groups was 80.0% for group C, 83.3% for group F, and 96.7% for group I.
All flavonoids significantly contributed to the discriminatory power of the model (Table 2). However, the highest contribution was found for apigenin, quercetin and luteolin, as shown by the low values of Wilks’ lambdas.
Another question in the research was to clarify the behavior of individual flavonoids in the grain. The answer was provided by means of the principal component analysis (Figure 4). Vectors of variables (flavonoids) were
 (a)
(a) (b)
(b)
Figure 2. (a) Chromatogram of flavonoid standards: vitexin (1), rutin (2), quercetin (3), luteolin (4), naringenin (5), apigenin (6), kaempferol (7). (b) Chromatogram of inoculated winter wheat sample with indicated flavonoids.

Figure 3. Discriminant analysis plot of three variants of grain samples of 30 winter wheat cultivars using concentration (log mg/kg) of seven flavonoids (Table 1). The first and second discriminant axes account for 97.75% and 2.25% of discriminant power, respectively. 95% probability ellipses are indicated for each variant. C = control samples, F = Fusarium-inoculated and fungicide-treated samples, I = Fusarium-inoculated samples.

Figure 4. Principal component analysis (PCA) biplot of the concentration of seven flavonoids (Table 1) in 90 grain samples of 30 winter wheat cultivars. Blue circles-control samples; green circles-Fusarium-inoculated and fungicide treated samples; red circles-Fusarium- inoculated samples.

Table 1. Concentrations of seven flavonoids (mg/kg) in grain of 30 winter wheat cultivars in three variants of the experiment.
C―control plots, I―Fusarium-inoculated plots, F―Fusarium-inoculated plots controlled with fungicides. Values within the same column followed by different letters are significantly different at the level of probability <0.0001 or *<0.05.
Table 2. Values of partial Wilks’ lambda for analyzed flavonoids.
located at small distances from one another, which results from a strong correlation between them. This indicates a similar mechanism of the formation of the individual flavonoids. The greatest distance was observed for rutin, having the smallest effect on the value of component 1 (PCA1), while its effect was greatest on the value of PCA2.
Similarity in the mechanism of flavonoid formation was studied using correlation tests of log transformed variables (Table 3). In most cases in the relationship between individual flavonoids significant correlations were found at the significance level of p < 0.001. This correlation level was observed for all flavonoids in samples covering all the three variants and almost all flavonoids in the inoculated samples. The lowest number of correlations was recorded for samples treated with fungicides, which suggests that its application resulted in disturbed flavonoid biosynthesis. This has not been reported previously. To a lesser extent it was also observed for the control. The data show that the largest amounts of these metabolites were detected in inoculated samples. Their contents were markedly lower in the control and in samples inoculated with Fusarium culmorum treated with the fungicides. The effect on I + F samples is surprisingly strong and indicates a similar course of biosynthesis as in the control. This may be explained by the significant effect of fungicide active substances, not only on the controlled pathogen but also on physiological (biochemical) processes in plants. The effect of e.g. prothioconazole, a component of Prosaro, on delayed leaf senescence and extension of the green leaf area duration is well known [20] . Hypothetically, we may assume the effect of fungicides on the process of pathogen recognition by plants, which is an important element in pathogenesis and triggers defense mechanisms [21] .
This effect was analyzed in 30 winter wheat cultivars, commonly cultivated in the temperate climate zone, as shown by the results of total concentrations of analyzed flavonoids, presented in Figure 5. We observed considerable variation indicating that e.g. cultivars “Akteur”, “Mewa” and “Markiza” are characterized by the highest concentration of flavonoids. In turn, such cultivars as “Jenga”, “Alcazar” or “Anthus” have the lowest contents.
Table 3. Correlations between concentrations (mg/kg) of seven flavonoids for the control (C), inoculated samples (I), inoculated and fungicide treated samples (F), and all samples (C, I, F) of grain of 30 winter wheat cultivars. Values were log transformed.
Values in bold are different from 0 at the level of probability <0.001 or **<0.01 or *<0.05.

Figure 5. Total concentrations of seven flavonoids (mg/kg) in grain of 30 wheat cultivars for three experimental variants.
These cultivars differ in pedigree and belong to different quality groups (“Akteur”, “Alcazar”―A; “Anthus”, “Jenga”, “Mewa”―B; “Markiza”―C) [14] . According to the COBORU data, cv. “Akteur’ and “Jenga” exhibit the highest resistance to necrotrophic leaf and head diseases, while it is lowest in cv. “Alcazar”. The highest resistance to Fusarium head blight and toxin accumulation based on observations collected over several years by the authors of this study (Góral, Perkowski―unpublished data) was found for cv. “Akteur” and “Jenga”, while the highest susceptibility was found in cv. “Alcazar”, “Anthus” and “Markiza”. This shows that there is no direct relationship between the contents of flavonoids and response of individual cultivars to spike infection by F. culmorum. Another explanation may be provided by the fact that the defense mechanisms cause low production of flavonoids, e.g. the resistant cv. Jenga with the lowest contents of these compounds.
4. Conclusions
In conclusion, based on three analyzed experimental variants, we may state that the strong attack of Fusarium culmorum accompanied by the weak defense reactions of the studied plant causes the formation of considerable amounts of flavonoids. On the other hand, we have observed (not reported previously in the available literature) a great effect of fungicides on concentrations of flavonoid metabolites, being similar to that in the control. This indicates a highly effective action of fungicides in the case of plant stress.
The results presented in this study constitute great progress in our understanding of the influence of environmental conditions on the mechanism of flavonoid formation and their mutual interactions.
Acknowledgements
The study was partially financed from the research project of the Polish National Science Centre number 2012/07/B/N29/02385.
References
- Pichersky, E. and Gang, D.R. (2000) Genetics and Biochemistry of Secondary Metabolites in Plants: An Evolutionary Perspective. Trends in Plant Science Perspectives, 5, 439-445. http://dx.doi.org/10.1016/S1360-1385(00)01741-6
- Dykes, L. and Rooney, W. (2007) Phenolic Compounds in Cereal Grains and Their Health Benefits. Cereal Foods World, 52, 105-111.
- Ray Narayana, K., Sripal Reddy, M., Chaluvadi, M.R. and Krishna, D.R. (2001) Bioflavonoids Classification, Pharmacological, Biochemical Effects and Therapeutic Potential. Indian Journal of Pharmacology, 33, 2-16.
- Xu, Y.C., Leung, S.W.S, Yeung, D.K.Y., Hu, L.H., Chen, G.H., Che, C.M. and Man, R.Y.K. (2007) Structure Activity Relationship of Flavonoids for Vascular Relaxation in Porcine Coronary Artery. Phytochemistry, 68, 1179-1188. http://dx.doi.org/10.1016/j.phytochem.2007.02.013
- Erlund, I. (2004) Review of the Flavonoids Quercetin, Hesperetin, and Naringenin. Dietary Sources, Bioactivities, Bioavalability. Nutrition Research, 24, 851-874. http://dx.doi.org/10.1016/j.nutres.2004.07.005
- Naczk, M. and Shahidi, F. (2006) Phenolics in Cereals, Fruits and Vegetables: Occurrence, Extraction and Analysis. Journal of Pharmaceutical and Biomedical Analysis, 41, 1523-1542. http://dx.doi.org/10.1016/j.jpba.2006.04.002
- Abdel-Aal, E.-S.M. and Hucl, P. (2003) Composition and Stability of Anthocyanins in Blue-Grained Wheat. Journal of Agriculture and Food Chemistry, 51, 2174-2180. http://dx.doi.org/10.1021/jf021043x
- Abdel-Aal, E.-S.M., Young, J.C. and Rabalski, I. (2006) Anthocyanin Composition in Black, Blue, Pink, and Red Cereal Grains. Journal of Agriculture and Food Chemistry, 54, 4696-4704. http://dx.doi.org/10.1021/jf0606609
- Shahidi, F. and Naczk, M. (1995) Food Phenolics: Sources, Chemistry, Effects, Applications. Technomic Publishing, Lancaster.
- Wojakowska, A., Perkowski, J., Góral, T. and Stobiecki, M. (2012) Structural Characterization of Flavonoid Glycosides from Leaves of Wheat (Triticum aestivum L.) Using LC/MS/MS Profiling of the Target Compounds. Journal of Mass Spectometry, 48, 329-339. http://dx.doi.org/10.1002/jms.3160
- Paul, P.A., Lipps, P.E., Hershman, D.E., McMullan, M.P., Draper, M.A. and Madden, L.V. (2008) Efficacy of Triazole- Based Fungicides for Fusarium Head Blight and Deoxynivalenol Control in Wheat: A Multivariate Meta-Analysis. Phytopathology, 98, 999-1011. http://dx.doi.org/10.1094/PHYTO-98-9-0999
- Yoshida, M., Nakajima, T., Tomimura, K., Suzuki, F., Arai, M. and Miyasaka, A. (2012) Effect of the Timing of Fungicide Application on Fusarium Head Blight and Mycotoxin Contamination in Wheat. Plant Disease Journal, 96, 845- 851. http://dx.doi.org/10.1094/PDIS-10-11-0819
- Oldenburg, E., Weinert, J. and Wolf, G.A. (2001) Effects of Strobilurin Containing Fungicides on the Deoxynivalenol Content in Winter Wheat. Mycotoxin Research, 17, 10-14. http://dx.doi.org/10.1007/BF03036702
- COBORU―Centralny Ośrodek Badania Odmian Roślin Uprawnych [the Research Centre for Cultivar Testing] (2013) Variety Recommendation. Verification. http://www.coboru.pl/
- Edwards, S.G., Pirgozliev, S.R., Hare, M.C. and Jenkinson, P. (2001) Quantification of Trichothecene-Producing Fusarium Species in Harvested Grain by Competitive PCR to Determine Efficacies of Fungicides against Fusarium Head Blight of Winter Wheat. Applied and Environmental Microbiology, 67, 1575-1580. http://dx.doi.org/10.1128/AEM.67.4.1575-1580.2001
- Buschhaus, H. and Ellner, F.M. (2007) Effect on Thiophanate-Methyl on Mycotoxin Production in Cereals under Field Conditions and in Vitro. 29th Mycotoxin Workshop, Fellbach, 14-16 May 2007, 53.
- Häuser-Hahn, I., Dutzmann, S., Friessleben, R., Meissner, R. and Goehlich, F. (2008) Prosaro®―A New Fungicide for Control of Fusarium and Mycotoxins in Cereals. 3rd International Symposium on Fusarium Head Blight, Szeged, 1-5 September 2008, 711-712.
- Góral, T., Wiśniewska, H., Ochodzki, P., Walentyn-Góral, D. and Kwiatek, M. (2013) Reaction of Winter Triticale Breeding Lines to Fusarium Head Blight and Accumulation of Fusarium Metabolites in Grain in Two Environments under Drought Conditions. Cereal Research Communications, 41, 106-115. http://dx.doi.org/10.1556/CRC.2012.0028
- Fligner, M.A. (1984) A Note on Two-Sided Distribution-Free Treatment versus Control Multiple Comparisons. Journal of American Statistical Association, 79, 208-211. http://dx.doi.org/10.1080/01621459.1984.10477086
- Berdugo, C.A., Steiner, U., Dehne, H.W. and Oerke, E.C. (2012) Effect of Bixafen on Senescence and Yield Formation of Wheat. Pesticide Biochemistry and Physiology, 104, 171-177. http://dx.doi.org/10.1016/j.pestbp.2012.07.010
- Walter, S., Nicholson, P. and Doohan, F.M. (2009) Action and Reaction of Host and Pathogen during Fusarium Head Blight Disease. New Phytologist, 185, 54-66. http://dx.doi.org/10.1111/j.1469-8137.2009.03041.x