American Journal of Plant Sciences
Vol.4 No.8(2013), Article ID:35347,10 pages DOI:10.4236/ajps.2013.48190
Identification of Genetically Distinct Cassava Clones from On-Farm Plantations to Widen the Thai Cassava Breeding Gene Pool
![]()
1Department of Biology, Faculty of Science, Khon Kaen University, Khon Kaen, Thailand; 2Rayong Field Crops Research Center, Department of Agriculture, Rayong, Thailand.
Email: *prepua@kku.ac.th
Copyright © 2013 Preeya P. Wangsomnuk et al. This is an open access article distributed under the Creative Commons Attribution License, which permits unrestricted use, distribution, and reproduction in any medium, provided the original work is properly cited.
Received May 13th, 2013; revised June 13th, 2013; accepted July 15th, 2013
Keywords: Cassava; Distinctness; SSR; Ex Situ Conservation; Core Collection
ABSTRACT
Cassava (Manihot esculenta Crantz) is one of the most important economic crops in Thailand. However, the Thai cassava breeding gene pool was genetically narrow with only 11 distinct landraces. An attempt was made here to characterize 266 cassava clones collected from 80 farms in eight provinces using 35 SSR markers. A total of 365 polymorphic alleles were detected in the assayed samples. The molecular analysis of variance revealed that a large SSR variance (19.8%) was present among the farm samples. The genetic relationships of the 266 farm samples revealed by the principal coordinate analysis confirmed the large SSR variation observed among the collected cassava samples. The average dissimilarity (AD) of a cassava sample against the other 265 samples was calculated and the AD values obtained ranged from 0.256 to 0.502 with a mean of 0.319. Based on these AD values, a set of 50 unique cassava samples with AD values of 0.346 or higher was assembled from the on-farm samples to widen the genetic base of the Thai cassava breeding gene pool.
1. Introduction
Cassava (Manihot esculenta Crantz) is the fourth most important food crop in the tropics, and is still growing in importance both for food security (especially in Africa) and for multiple commercial and industrial uses (mainly in Latin America and Asia) [1,2]. It also is one of the most important economic crops in Thailand with 80% of the fresh root production of animal feed and starch exported to the European Union and Asian countries [3]. The Thai cassava sector was re-energized when it capitalized on the European market with opportunities for dried chips and pellets, beginning in the 1970s [4]. Last year, 3.3 million acres of cassava were planted and 27 million tons of fresh cassava root were produced across 50 Thai provinces [5,6].
Thai cassava breeding started in 1937 and has contributed to the success of cassava production with an introduction of 20 varieties from Malaysia and the Philippines in the 1930s and 65 varieties from the Columbia and Virgin Islands between 1963 and 1977 [7]. However, the Thai cassava production has greatly increased only after the release of the first Thai cultivar “Rayong 1” in 1975. “Rayong 1” was dominant in cassava production during the 1970s to 1990s and was replaced by “Kasetsart 50” released in 1992. So far, the Thai cassava breeding has officially released 13 bitter-type cassava cultivars [5,8]. However, the unique landrace cultivars hold in situ and ex situ in Thailand are 11 and 10, respectively, which are much fewer than in other Asian countries such as Vietnam, Malaysia, Indonesia and India [4]. Thus, the Thai cassava breeding gene pool is genetically narrow.
Cassava germplasm has been frequently characterized using many informative molecular markers such as simple sequence repeat (SSR) markers [9-11]. These characterizations revealed not only a high level of genetic diversity but also a strong genetic structure present in cassava germplasm (e.g., [9,12,13]). However, in Thailand little effort has been made to characterize cassava germplasm [14,15], particularly for those cassava clones growing on farms.
We conducted a study to collect and characterize cassava clones from a large number of farms across Thailand in the hope of assembling a genetically distinct set of clones to widen the breeding gene pool. The specific objectives of this study were to assess the genetic diversity of 266 cassava clones collected from 80 farms in eight Thai provinces using 35 informative SSR markers and to identify the most genetically distinct clones for genetic improvement of cassava. This study was inspired by the core collection concept [16,17] to obtain a small representative subset of the germplasm collection and the average dissimilarity measure of individual plants [18] to identify genetic distinctness.
2. Materials and Methods
2.1. Plant Materials
The cassava samples studied here consisted of 266 out of the 400 clones collected from 80 farms in the cassava planting area ranging from 1.2 to 7.9 acres. The surveyed farms are located in 16 districts and eight provinces (Figure 1 and Table 1). Specifically, 200, 50, 100 and 50 samples were collected from farms of 4, 1, 2, and 1 provinces representing major cassava planting areas in north-eastern, northern, eastern, and western Thailand, respectively. Nakhon Ratchasima and Kamphaeng Phet rank as the first and second largest planting areas of the country [5]. The farm collections were conducted from November 2011 to April 2012. The clone selection was made based on the phenotypic variation within each farm. Information on altitude and location of the farm (latitude, longitude) was also obtained. The collected stems were subsequently re-planted in Nong Lek Subdistrict, Kosum Phisai District, Maha Sarakham Province for further phenotypic and genetic characterizations.
2.2. DNA Extraction and SSR Analysis
The genomic DNA extraction was performed for 400 farm samples based on the young leaf tissue of each collected clone. The modified method of Tai and Tanksley [19] was applied with 100 mg of young leaf tissue collected. The tissue was first ground with a homogenizer, followed by adding 0.7 ml of extraction buffer (100 mM Tris-HCl; pH 8, 50 mM EDTA pH 8, 0.5 M NaCl, 1.25% SDS, 8.3 mM NaOH, 0.38% Na bisulfite) and then mixed by vortexing. The sample was incubated at 65˚C for 20 min and subsequently 0.22 ml of 5 M potassium acetate was added and mixed well. The tube was placed on ice for 40 min, followed by centrifugation for 3 min. The supernatant was transferred to a new tube. The DNA was precipitated by adding 0.7 volume of isopropanol, mixed well and centrifuged for 3 min. The supernatant was poured off and the pellet rinsed with 70% ethanol. The pellet was re-suspended in 300 µl of T5E (50 mM Tris-HCl pH 8, 10 mM EDTA) by briefly vortexing, and incubated at 65˚C for 5 min, followed by vortexing again. 150 µl of 7.4 M ammonium acetate were added and mixed well before centrifugation for 3 min and removal of the supernatant to the new tube. The DNA was precipitated by mixing with 330 µl of isopropanol and centrifuged for 3 min. The pellet was rinsed with 70% ethanol, air dried and re-suspended in 150 µL of TE (10 mM Tris-HCl, pH 8.0, 1 mM EDTA). The purity and quality of genomic DNA were assessed after digestion with
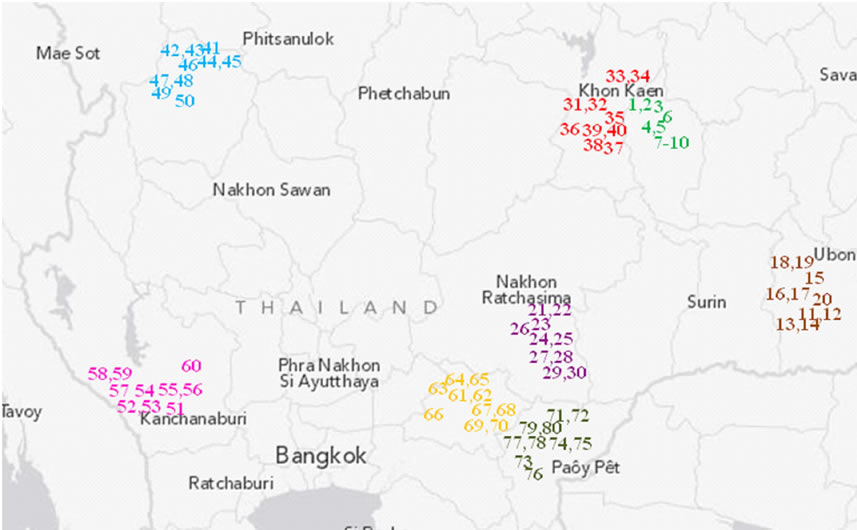
Figure 1. Relative location of the 80 studied farms in eight provinces in Thailand. A unique survey number (1 - 80) represents each farm listed in Table 1 and forms part of the farm name. The farms are colored for different provinces.
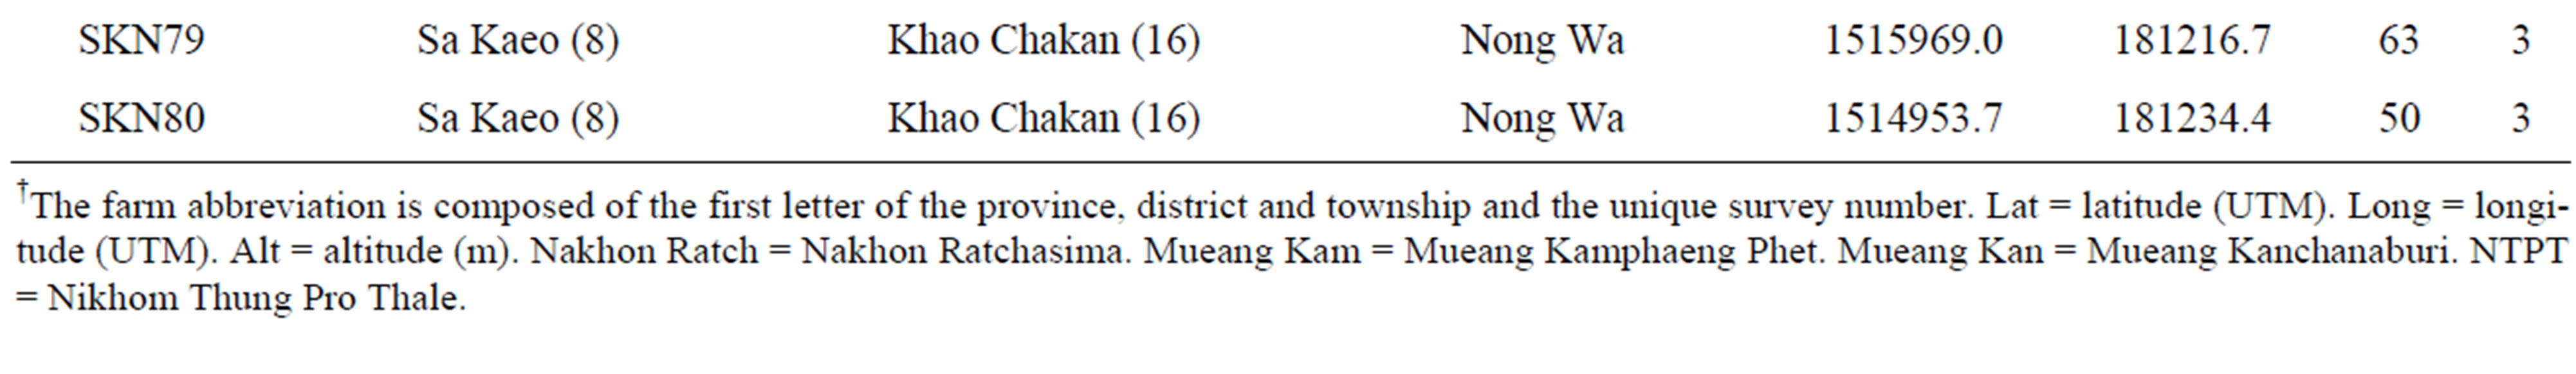
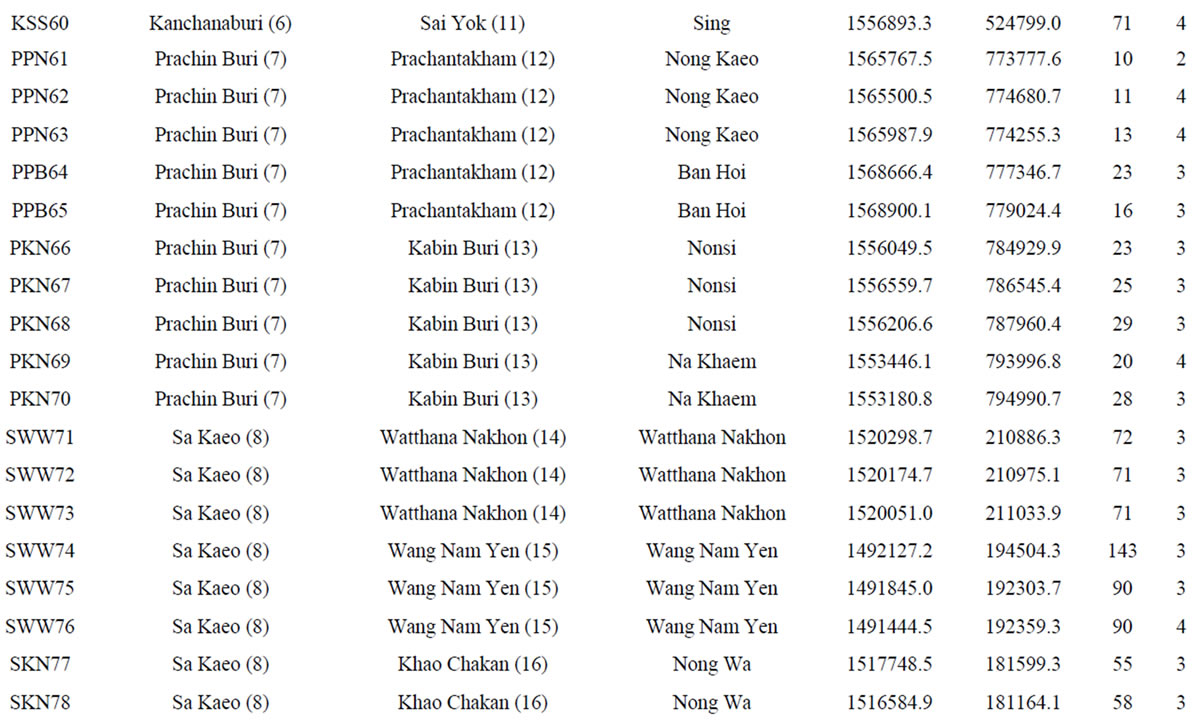
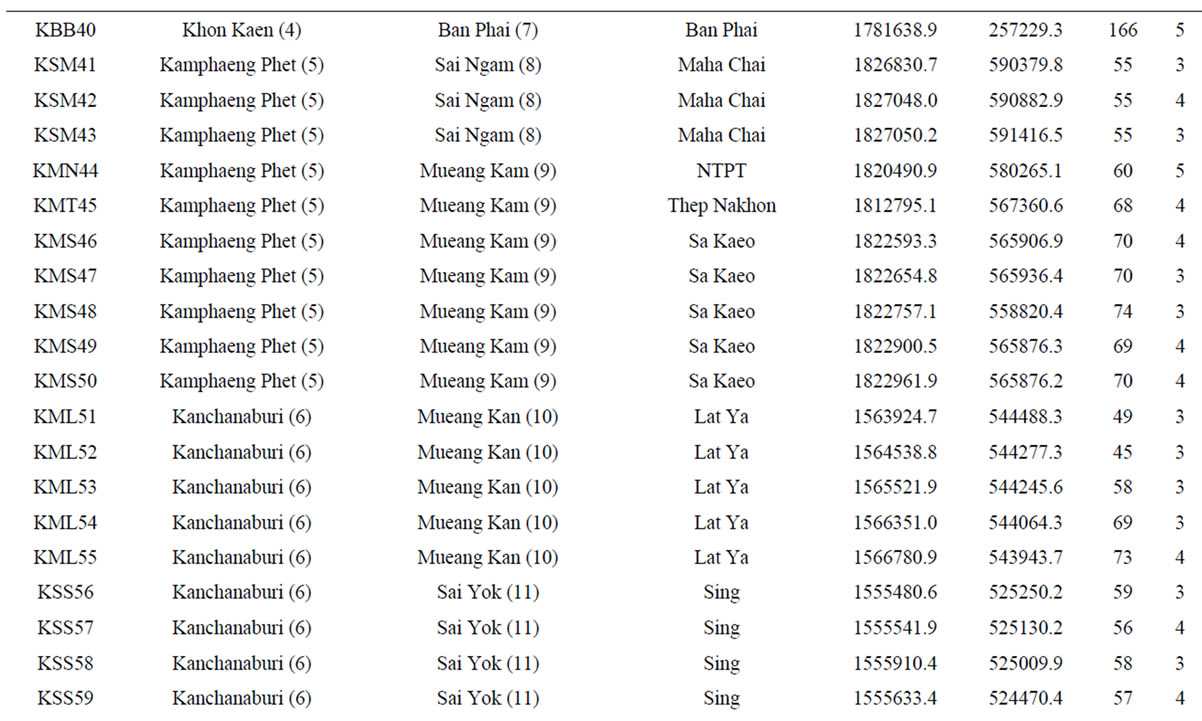
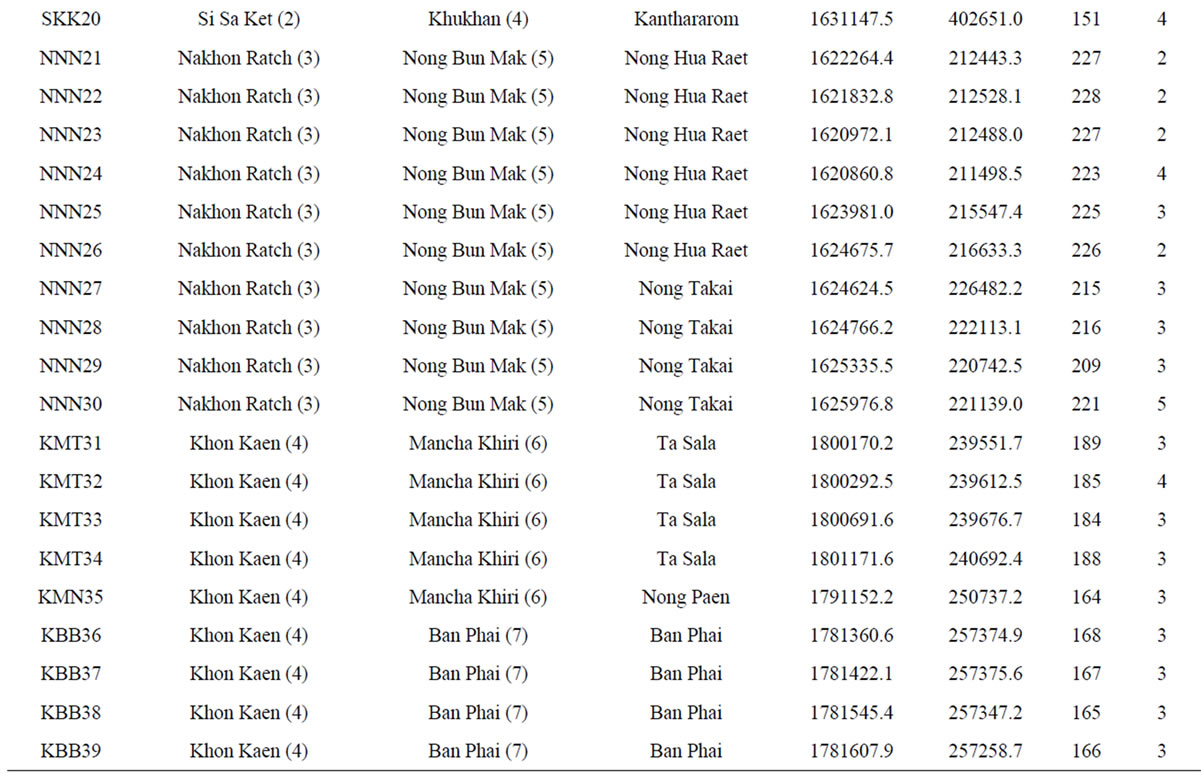
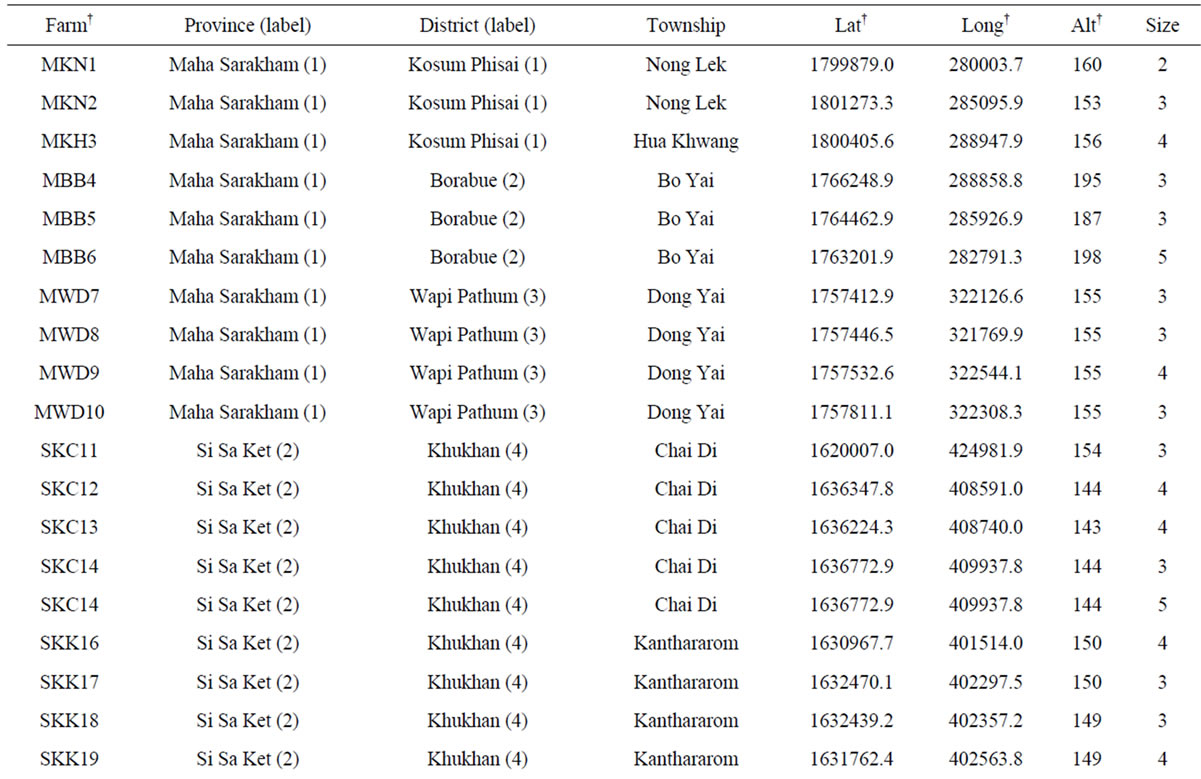
Table 1. List of 80 sampled farms in Thailand, their location information and our sample size.
†The farm abbreviation is composed of the first letter of the province, district and township and the unique survey number. Lat = latitude (UTM). Long = longitude (UTM). Alt = altitude (m). Nakhon Ratch = Nakhon Ratchasima. Mueang Kam = Mueang Kamphaeng Phet. Mueang Kan = Mueang Kanchanaburi. NTPT = Nikhom Thung Pro Thale.
RNaseA (Sigma). Extracted DNA was quantified with a Thermo Scientific NanoDropTM spectrometer (Fisher Scientific, USA) and agarose gel electrophoresis. The extracted genomic DNAs were stored at −20˚C until further use. Two independent DNA isolations were done for each sample.
Twenty-four genomic SSR and 17 expressed sequence tags(EST)-derived SSR markers were selected based on marker type, informativeness and linkage group from the published literature [12,20-22] for the SSR analysis. An initial screening of 400 collected clones was performed with three genomic SSR and three EST-SSR markers for clone-wise polymorphism to assess clone duplication on the same farm. The effort confirmed 266 less likely duplicated clones from 80 farms. These less likely duplicated clones and 16 cultivar samples were finalized for analysis with 41 SSR markers. The polymerase chain reaction (PCR) was performed in a total volume of 10 μl reaction mixture containing 40 ng DNA template, 0.4 U Taq DNA polymerase (Vivantis), 1 μl of 10XPCR buffer S (160 µM (NH4)2SO4, 500 µM Tris-HCl, pH 9.1, 17.5 µM MgCl2 and 0.1% Triton; Vivantis), 0.2 mM dNTPs (Vivantis), and 0.02 µM each of forward and reverse primers in a 0.20 ml PCR tube. The amplification was performed using Agilent Technologies Sure Cycler 8800 (Germany). The amplification regime consisted of 95˚C for 3 min; then 36 cycles at 95˚C for 30 s, 55˚C for 40 s, and 72˚C for 1 min; and a final extension at 72˚C for 10 min. The PCR products were analyzed by a 1.5% agarose gel electrophoresis, ethydium bromide stained and visualized by Electrophoresis Gel Photodocumentation System (Vilber Lourmat, Japan). In addition, the PCR amplification products were separated on 6% (19:1) polyacrylamide gel and revealed SSR bands by gel silver staining modified from Bassam et al. [23]. The 100 bp DNA ladder plus (Vivantis) was used as a molecular size standard. The PCR reactions were done independently twice. DNA fragments amplified by SSR primer pairs were identified based on their sizes in base pairs measured with DNA ladders and compared with the sizes reported in the literature. The scored alleles were assessed for consistency with duplicated samples. Only repeatable amplified DNA fragments were manually scored as 1 for presence or 0 for absence of a DNA fragment for each sample.
2.3. Data Analysis
The SSR data were analyzed for the level of polymerphismwith respect to primer and farm by counting the number of polymorphic alleles and generating summary statistics of allelic frequencies. The numbers of alleles detected by all primer pairs were plotted against their frequencies of occurrence in all assayed samples. As cassava ploidy is uncertain (i.e., either diploid or autotetraploid [24,25]) and only two of the 41 SSR markers may fit a di-allelic profile, Shannon’s entropy was calculated following Reyes-Valdes and Williams [26] to estimate the diversity content per locus, as this estimate does not require strict genetic assumptions such as marker inheritance and sample ploidy. The entropy-based diversity content (eDC) provides a measure of the effective number of alleles per marker locus [26].
The analysis of molecular variance (AMOVA) was performed using the GenAlEx v6 software [27] to assess genetic diversity of assayed samples. Significance of resulting variance components and inter-group genetic distances was tested with 9999 random permutations. A principal coordinate analysis (PCoA) of the 282 cassava samples was performed using NTSYS-PC 2.01 [28] based on the similarity matrix of 365 SSR alleles, and plots of the first three resulting principal components were made to assess the accession associations.
The average dissimilarity of each sample against the other 265 samples was estimated following Fu [18] and using the SAS software that was written by Dr. Yong-Bi Fu, Plant Gene Resources of Canada. This average dissimilarity measures the overall genetic difference between a sample of interest and the remaining 265 samples assayed. Based on the average dissimilarity values, a set of 50 unique cassava samples with the highest average dissimilarity values were selected from the farm samples.
3. Results and Discussion
3.1. SSR Variation
The SSR analysis revealed that six of the 17 EST-derived SSR markers displayed monomorphic bands for all 266 samples and thus they were removed from further analysis. The other 35 markers revealed a total of 2 monomorphic and 365 polymorphic alleles in the 266 samples (Table 2). The number of alleles detected per locus ranged from 2 to 21 and averaged 10.4. The mean allele frequency for all alleles at a locus ranged from 0.446 to 0.994 and averaged 0.609. Interestingly, 11 EST-derived SSR markers detected only 61 alleles that are much fewer than the 24 genomic SSR primer pairs (304). The most informative primer pair was the genomic SSRY235 on linkage group G with an eDC value of 5.23 and 18 alleles detected, followed by the genomic GA5 on linkage group Q with an eDC value of 4.92 and 21 alleles detected (Table 2). The less informative primer pairs were two EST-derived EME254 and EME637 with eDC values smaller than 0.20. Some of these primer pairs should sample SSR alleles in both transcribed and non-
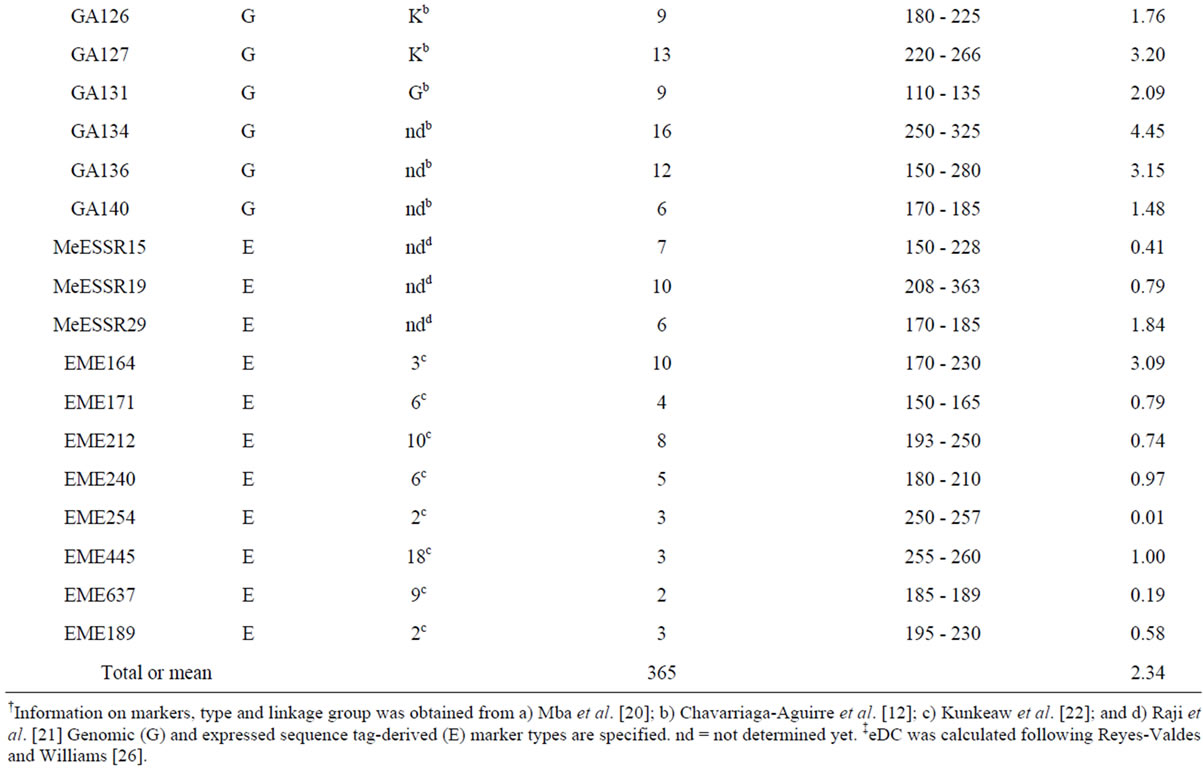
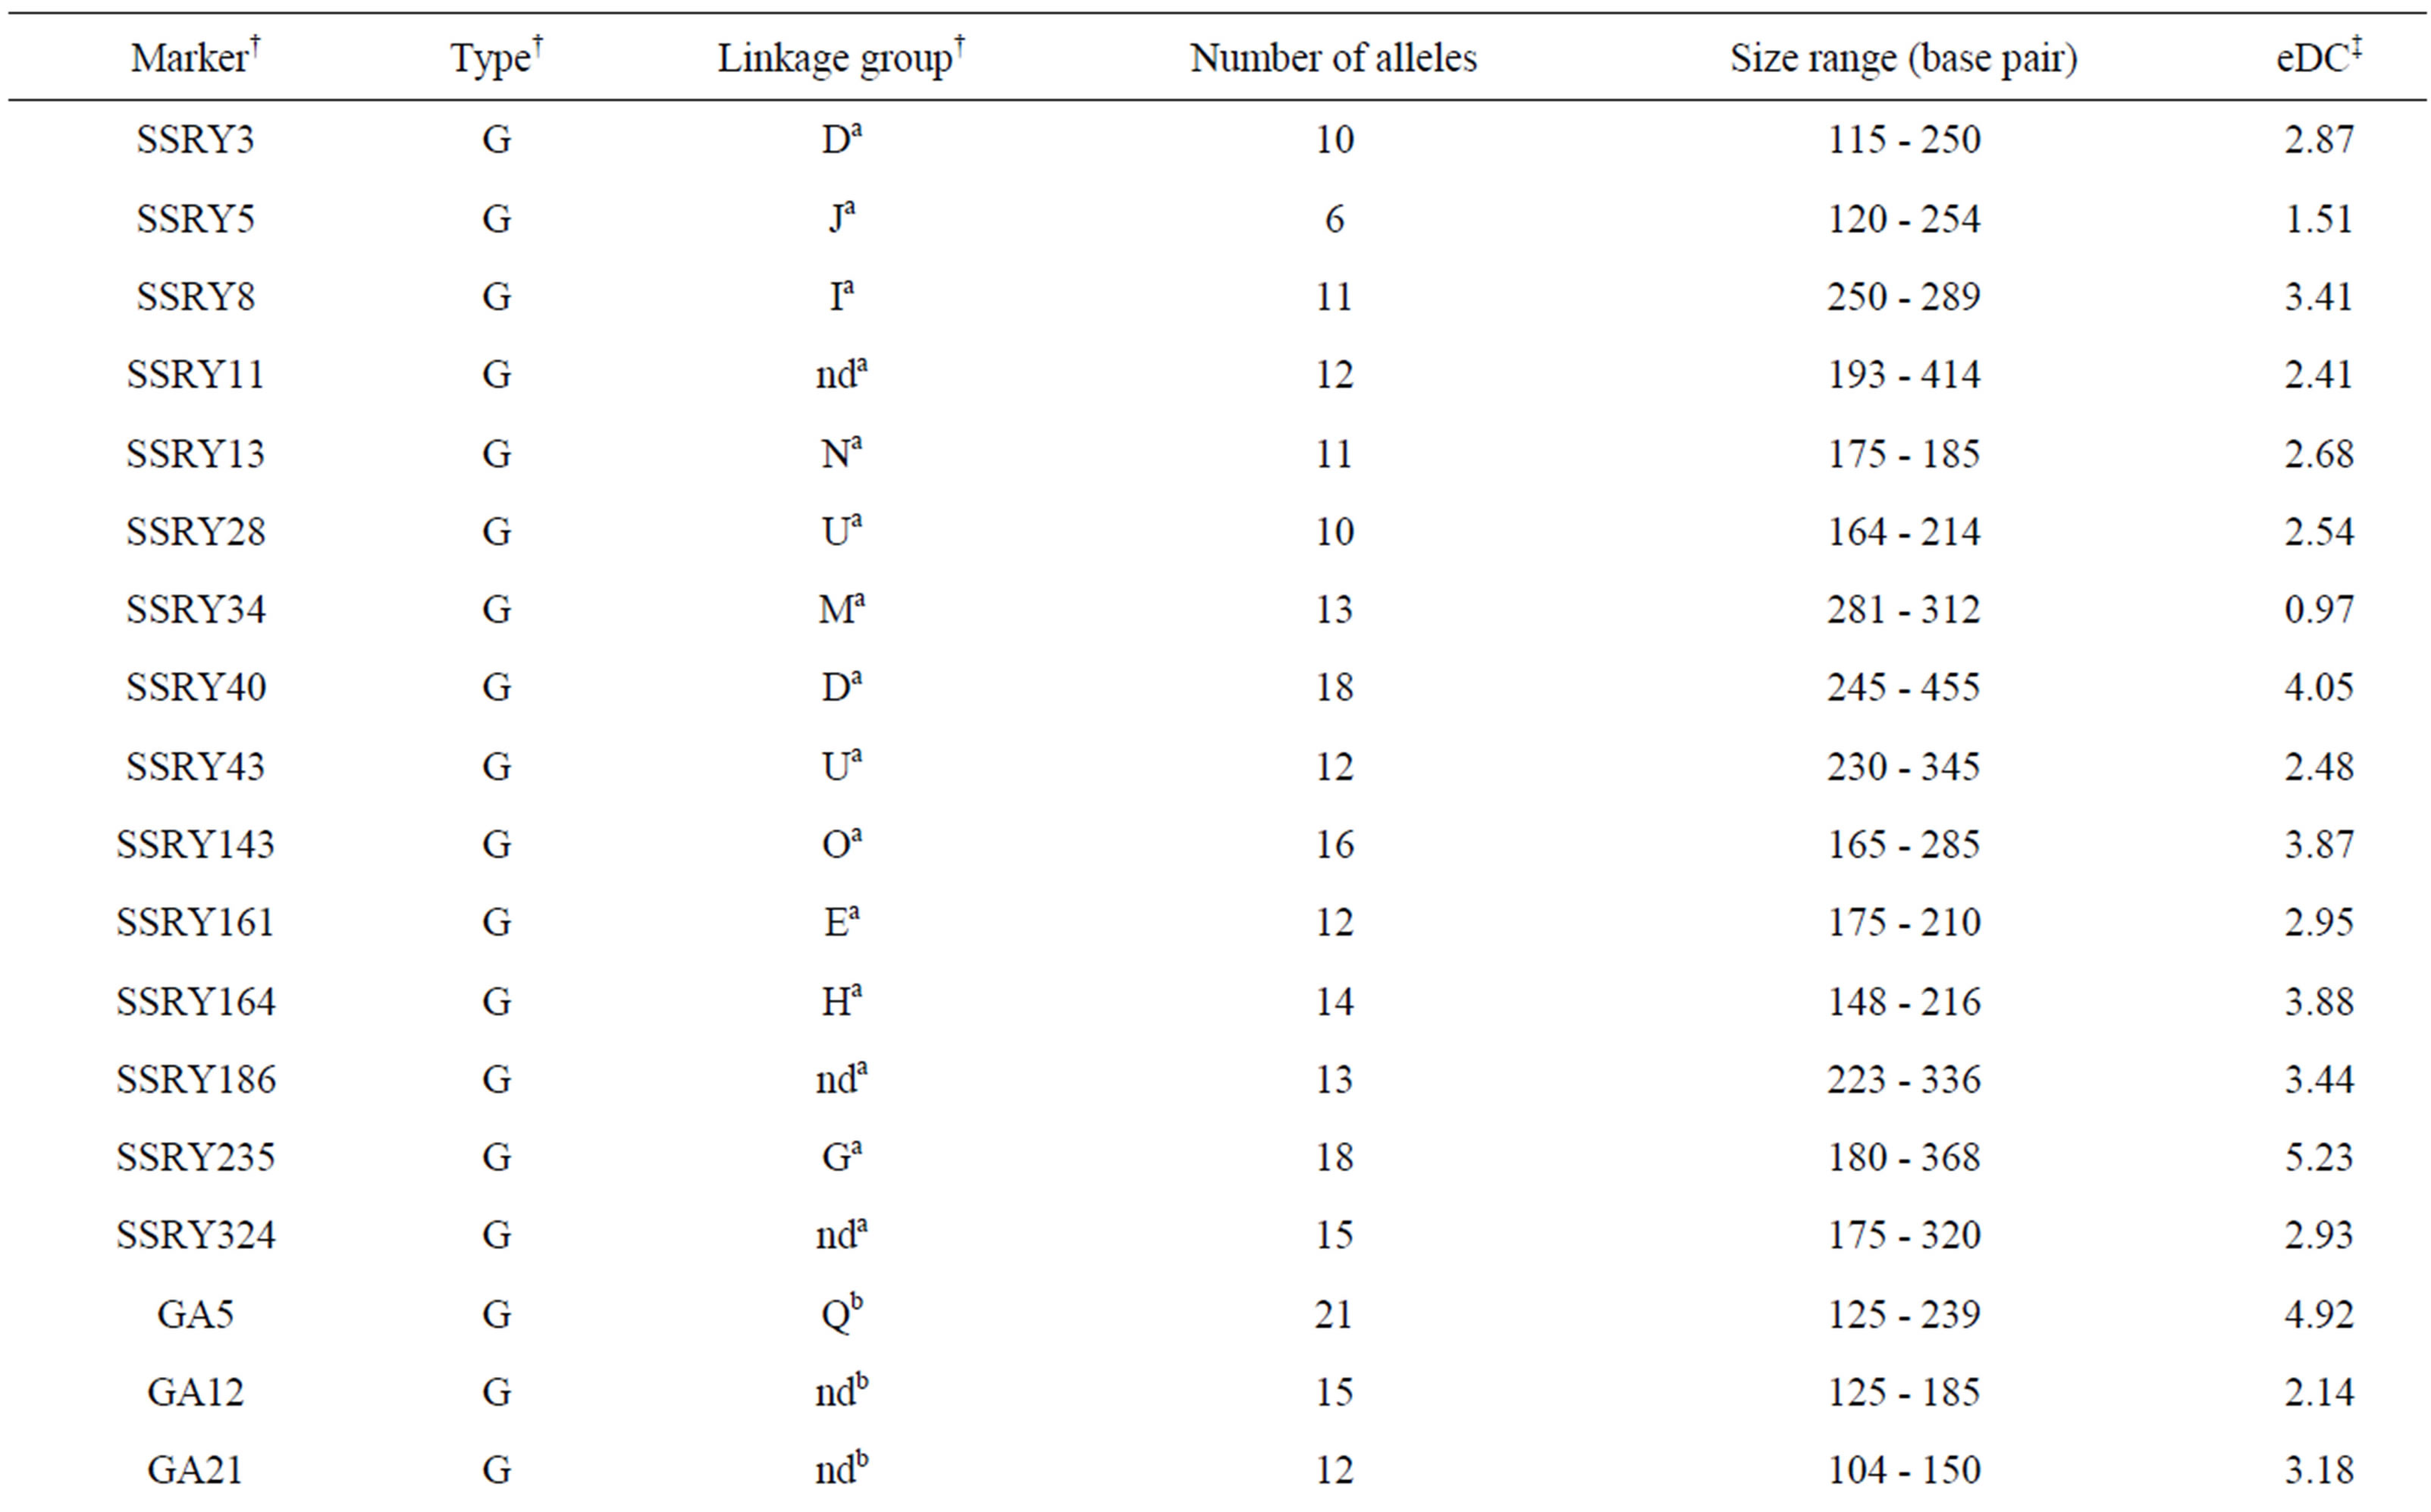
Table 2. Thirty-five SSR markers assayed in 266 on-farm cassava samples and the estimates of entropy-based diversity content per locus (eDC).
†Information on markers, type and linkage group was obtained from a) Mba et al. [20]; b) Chavarriaga-Aguirre et al. [12]; c) Kunkeaw et al. [22]; and d) Raji et al. [21] Genomic (G) and expressed sequence tag-derived (E) marker types are specified. nd = not determined yet. ‡eDC was calculated following Reyes-Valdes and Williams [26].
transcribed chromosomal regions and provide an adequate measure of genetic diversity.
3.2. Genetic Diversity
The molecular analysis of variance revealed that there was a large SSR variance (19.8%) present among farm samples and 80.2% residing within farm samples (Table 3). Based on the farm-specific proportions of the total SSR variation, the 10 most genetically diverse farms were KML54, KBB40, SKK16, SKC15, SKK19, NNN30, PPN63, KMT33, SKN77, and SKN79 (results not shown). The genetic relationships of the 266 farm samples shown in Figure 2 confirmed there was large SSR variation present among the collected cassava samples. Two PCoA components explained a total of 28.3% SSR variation.
The large SSR variation observed on the farm samples is not surprising for two reasons. Firstly, cassava is an outcrossing species with a multi-locus outcrossing rate estimated at 91.5% [29]. Our results are consistent with those reported for cassava germplasm from other countries using SSR markers (e.g., [9,12,13,30]). Secondly, some studies have shown that the high genetic diversity could be maintained through gene flow and recombination (e.g., [31]). The accumulation of fixed somatic mutation in cassava transmitted through vegetative propagation can be another important factor attributed to the intra-varietal polymorphism [31,32].
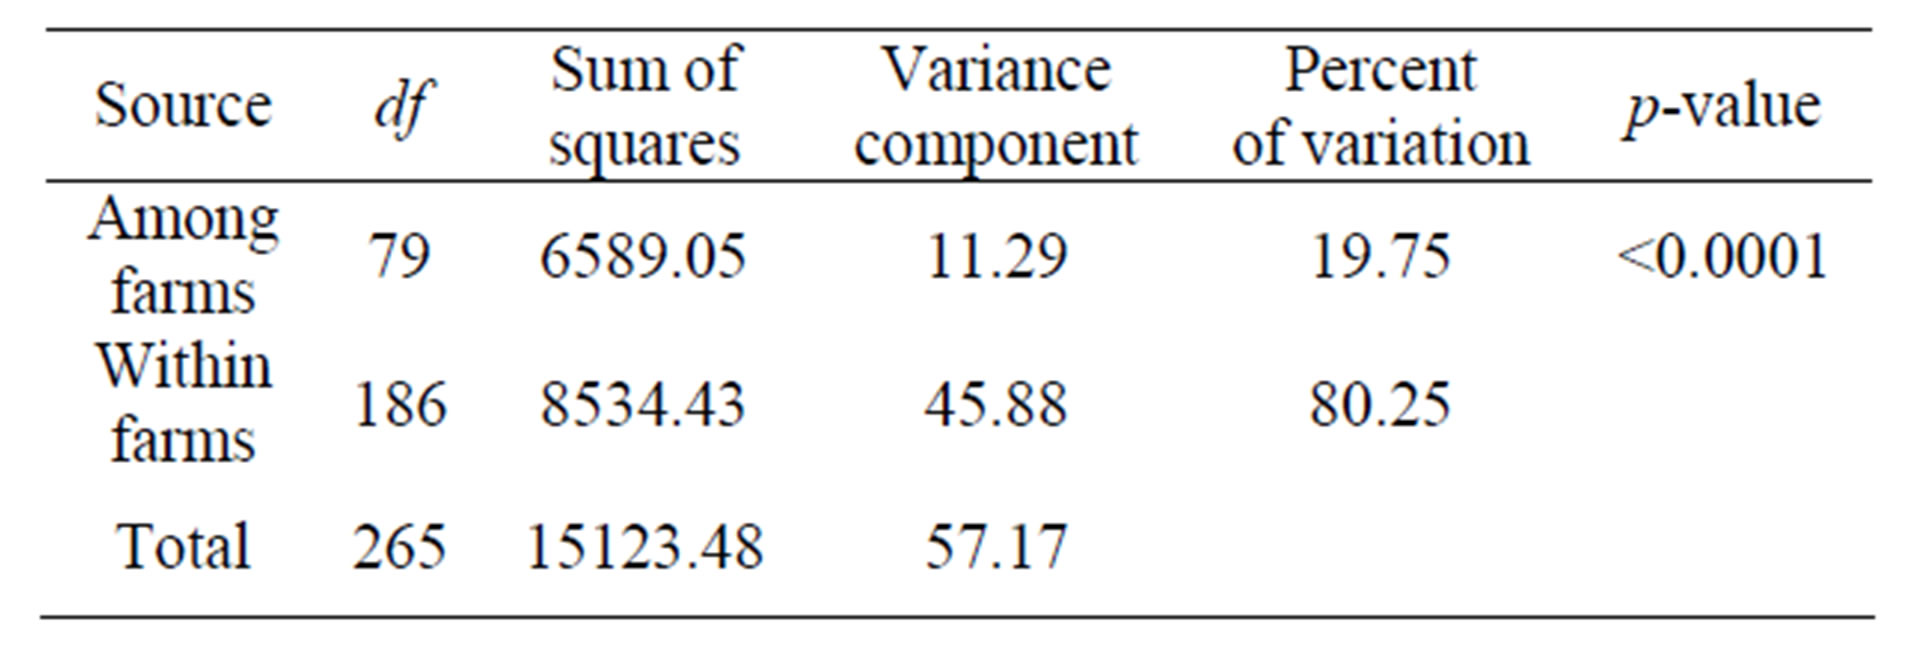
Table 3. Results of the molecular analysis of variance for the 266 on-farm cassava clones collected from 80 farms based on the 365 SSR markers.
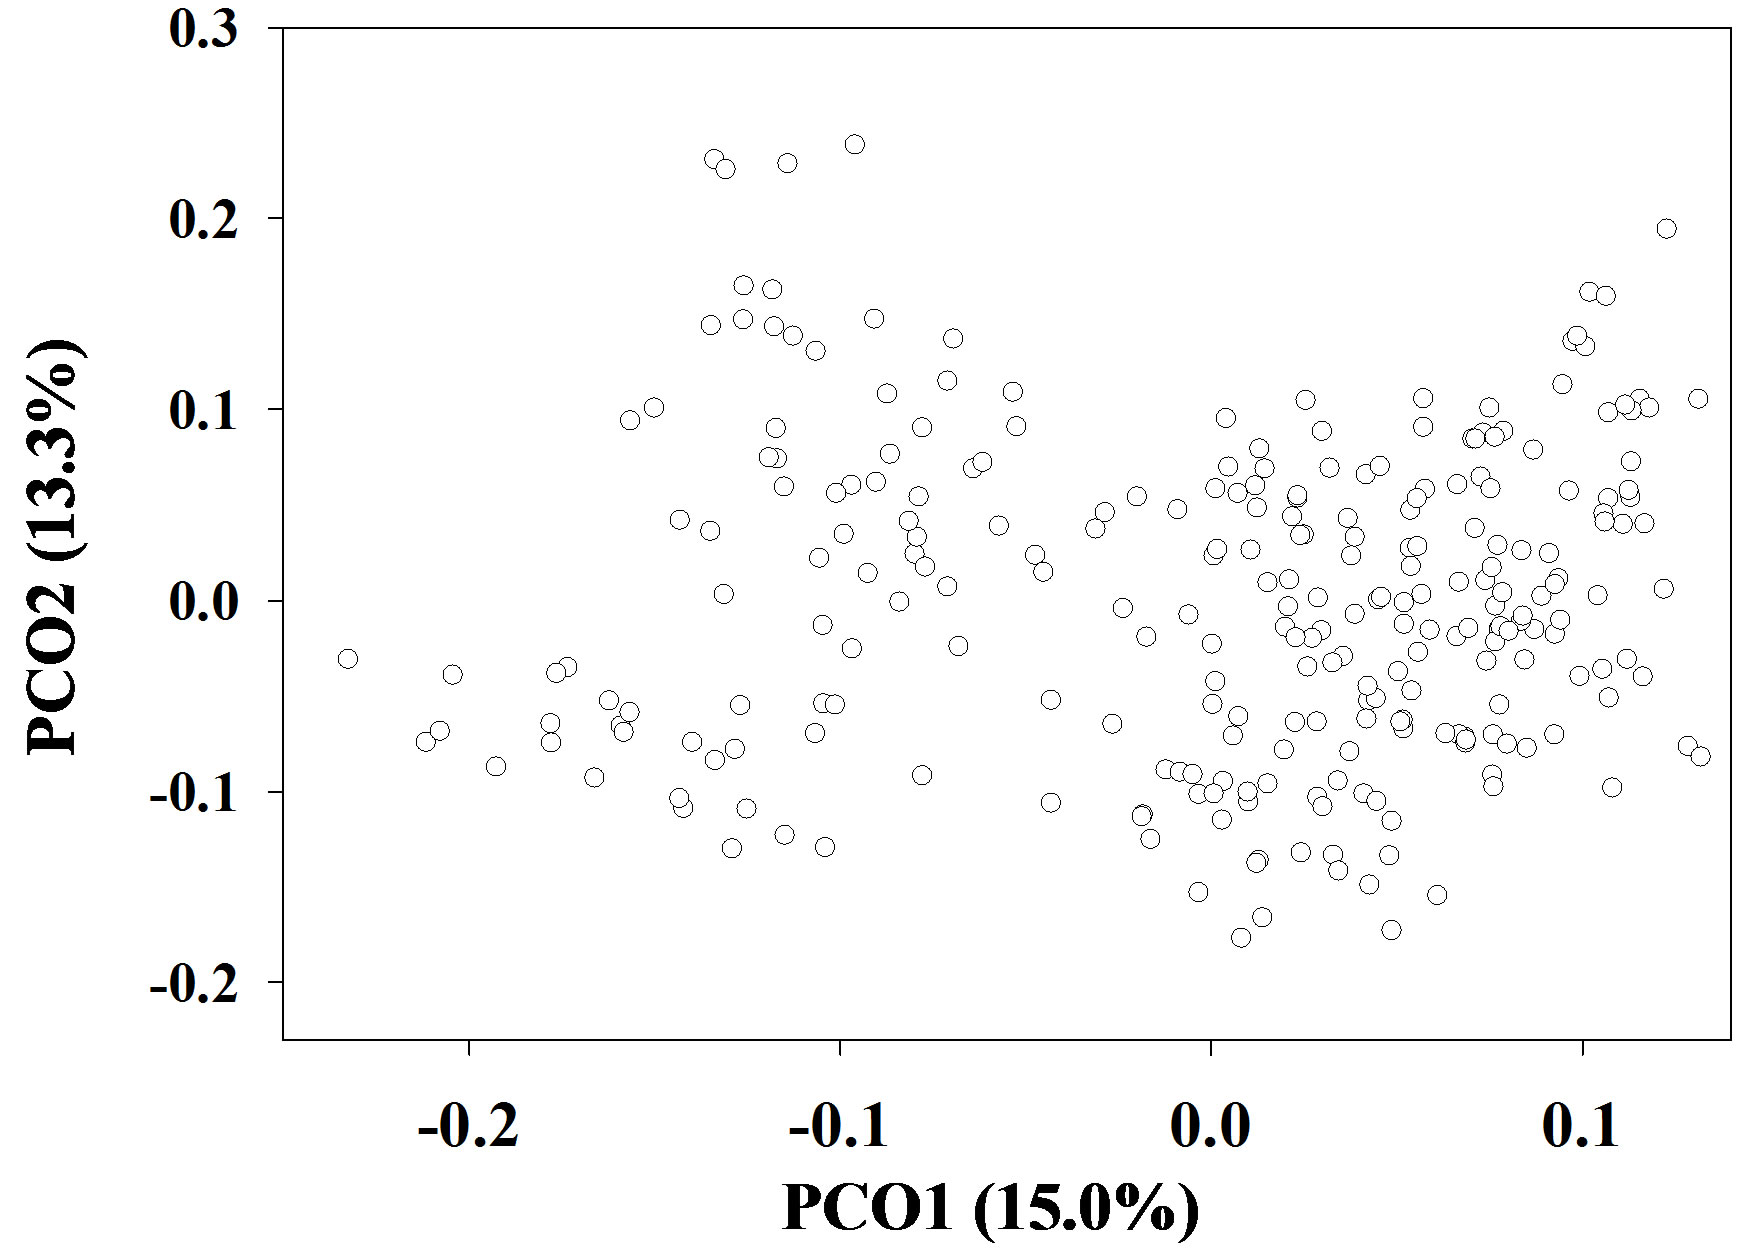
Figure 2. Genetic relationships of the 266 on-farm cassava clones as revealed in a PCoA plot based on 365 SSR alleles.
3.3. Unique Cassava Germplasm
The average dissimilarity (AD) of a cassava sample against the other 265 samples was calculated and the AD values obtained ranged from 0.256 to 0.502 with a mean of 0.319 (Figure 3). Based on these AD values, a set of 50 unique cassava samples with AD values of 0.346 or higher was assembled from the on-farm germplasm collection (Table 4). This unique set represented 18.8% of the collected and assayed clones from 39 farms across eight provinces, and 12.5% of the collected clones from 80 farms. The number of clones (in the unique set) per province fluctuated, depending on the sampling method [33]. However, the present study showed that the unique set comprised of cassava samples from all 8 provinces. It is interesting that there were 11 (22%) clones collected from farms in Khu Khan District, Si Sa Ket Province, which were among 50 most genetically unique clones.
The ADs obtained from this study are limited to only the 266 on-farm clones assayed. The AD values would change if more clones were assessed. This measure can recognize the distinctiveness, but not necessarily the relatedness, of cassava clones [18]. For example, two closely related clones that are quite distinct from the remaining clones could have similar higher levels of AD than the others and both clones would have been identified as genetically distinct. It is important to recognize these limitations when using the relative measure of genetic distinctiveness reported here.
This unique set of cassava clones differs in local adaptations from germplasm introduced from the International Centre for Tropical Agriculture and from other countries. Extensive investigation of the unique set is an efficient approach to enhancing evaluation and utilization for crop germplasm [34]. Our identified unique set could be further explored along with agronomic trait evaluations for genetic introgression or hybridization to widen the genetic base of the Thai cassava breeding gene pool.
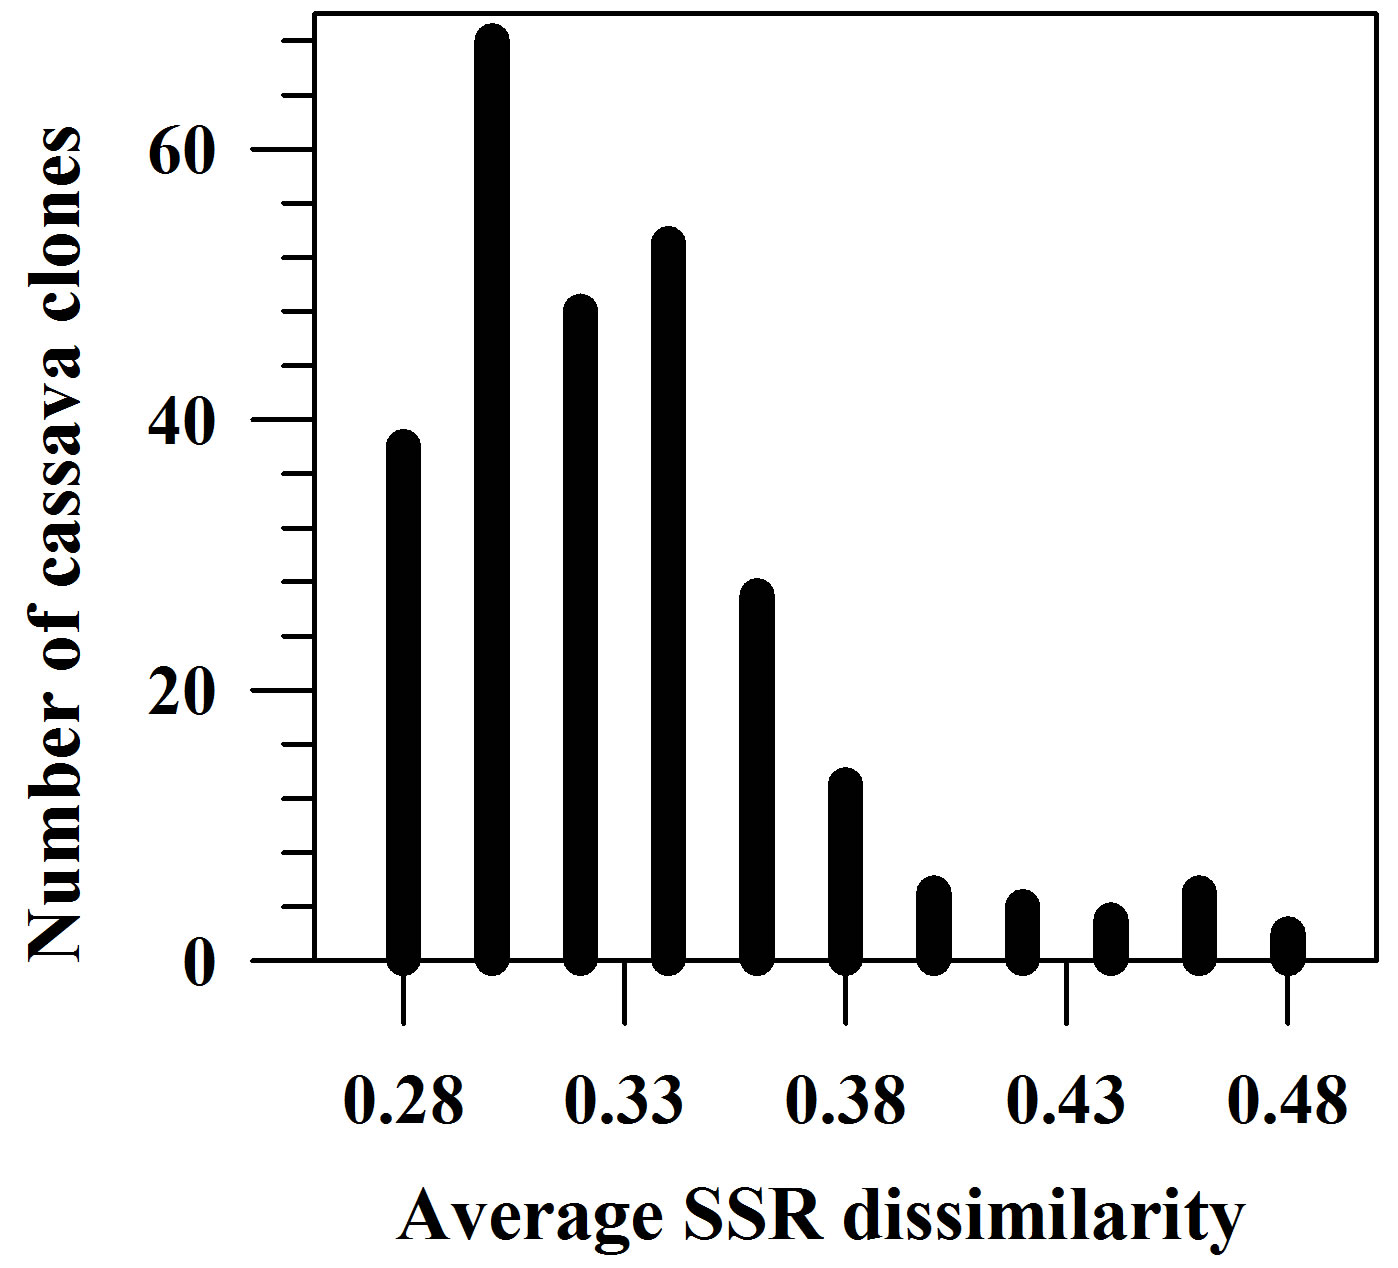
Figure 3. Distribution of average SSR dissimilarities for the 266 on-farm cassava clones.
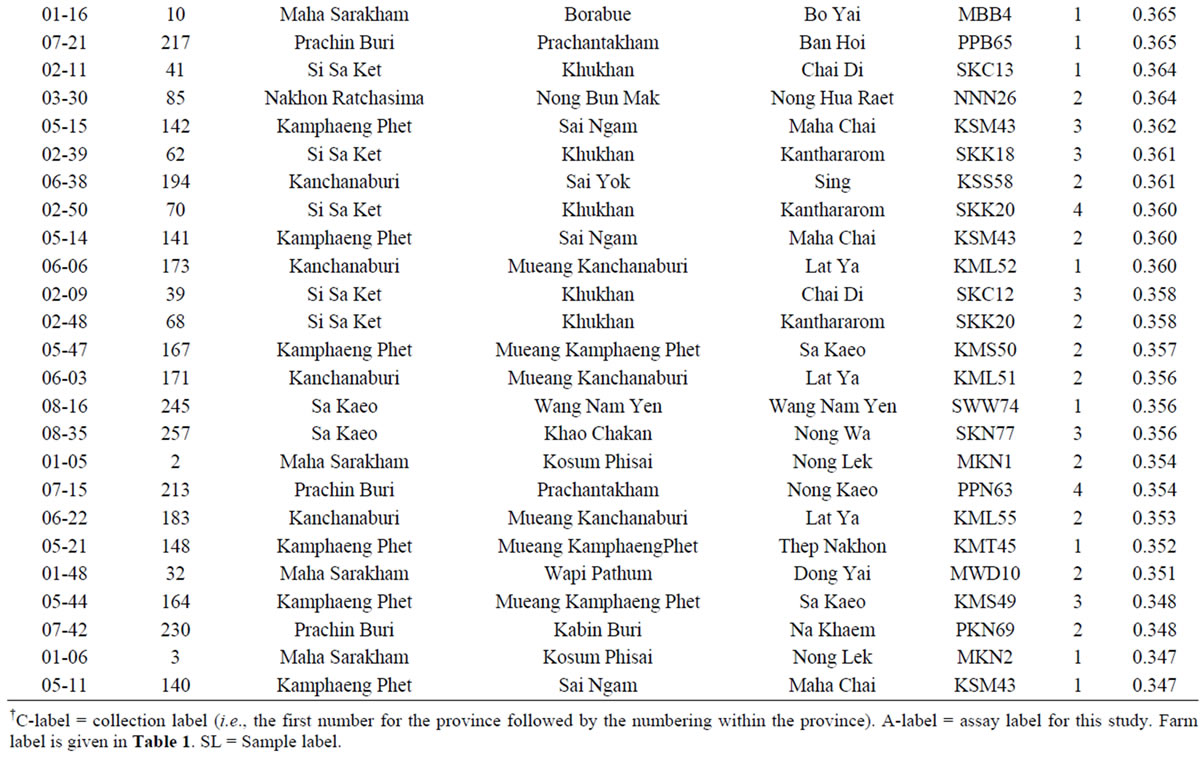
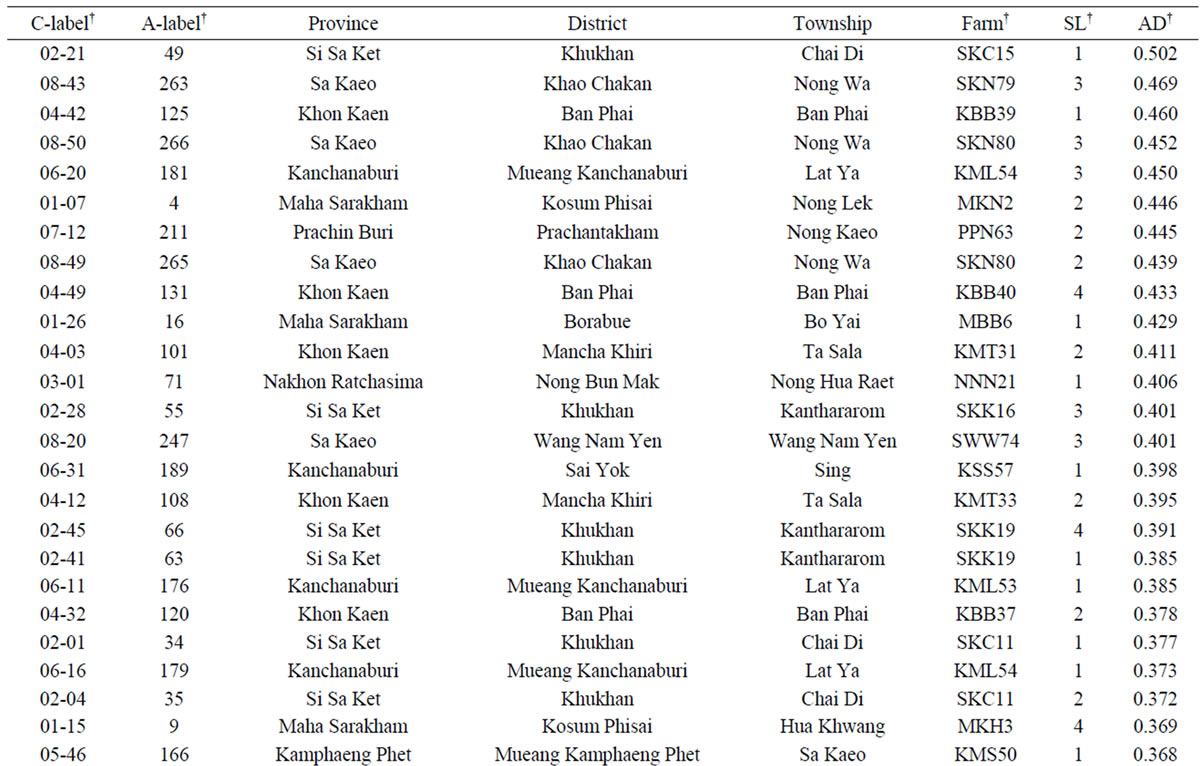
Table 4. List of 50 most genetically unique cassava clones collected from 80 farms in Thailand with the largest average dissimilarity (AD) values.
†C-label = collection label (i.e., the first number for the province followed by the numbering within the province). A-label = assay label for this study. Farm label is given in Table 1. SL = Sample label.
It should be evaluated across different ecosystems to determine the genotype by environmental effects for important traits. All the collected clones are currently vegetative conservation in the field and some of these are propagated in vitro. These materials will not only allow for on-farm yield assessments, but are also useful for testing pests and pathogens. The unique set of the cassava clones also provide a valuable addition to the ex situ collection of cassava germplasm for long-term conservation in Thailand.
3.4. Concluding Remarks
This SSR analysis represented a large effort to characterize on-farm cassava clones in Thailand, detected major SSR variation present in the cassava samples collected from 80 farms in the eight provinces, and established a set of 50 most genetically unique cassava clones to widen the genetic base of the Thai cassava breeding gene pool.
4. Acknowledgements
We gratefully acknowledge Dr. Yong-Bi Fu (Plant Gene Resources of Canada) for his assistance in the analysis of average dissimilarity and entropy-based diversity content and in the revision of the manuscript. We thank Dr. Hubert Franz Kurzweil and the journal reviewer for their valuable comments on an early version of this manuscript. We also thank all farmers who participated in the farm survey and cassava sampling; Sitteera Chawnue for her assistance on farm clone collection; Tossapol Pholcharee and Patchanee Arpornrat for helping with the farm survey data; Dr. Pinich Wangsomnuk and Sutti Thawanthaisong for their technical advice; all village leaders and the related staffs of the Provincial Department of Agriculture for their kind cooperation in this study.
REFERENCES
- J. H. Cock, “Cassava: New Potential for a Neglected Crop,” Westview Press, Boulder, 1985.
- D. Debouck, D. Dominique, J. Alexandra, C. Hershey and R. Llerme, “Conservation of Cassava Genetic Resource,” 2011. http://cropgenebank.sgrp.cgiar.org/index.php?option=com_content&view=article&id=113&Itemid=213
- C. Ratanawaraha, N. Senanarong and P. Suriyapan, “Status of Cassava in Thailand: Implications for Future Research and Development: A Review of Cassava in Asia with Country Case Studies on Thailand and Vietnam,” Proceedings of the Validation Forum on the Global Cassava Development Strategy, Rome, 26-28 April 2000. http://www.fao.org/docrep/009/y1177e/Y1177E04.htm
- C. H. Hershey and D. Debouck, “A Global Conservation Strategy for Cassava and Wild Manihot Species,” A Summary of Stakeholder Deliberations and Recommendations Prepared for the Global Crop Diversity Trust, 2010. http://www.croptrust.org/documents/cropstrategies/cass-ava%20strategy.pdf
- Office of Agricultural Economics, “Cassava Production Statistics,” 2013. http://www.oae.go.th/download/prcai/DryCrop/cassava53-55.pdf
- ASEAN Economic Community, “Thailand Tapioca Strategic Framework under the AEC,” Bangkok, 2013. http://www.thai-aec.com/71
- C. Rojanaridpiched, V. Vichukit, E. Sarobol and P. Changlek, “Breeding and Dissemination of New Cassava Varieties in Thailand,” Proceedings of the 7th Regional Cassava Workshop, Bangkok, 1 November-28 October 2002.
- S. Sarakarn, A. Limsila, D. Suparhan, P. Wongtiem, J. Hansetasuk and W. Watananonta, “Cassava Germplasm Conservation and Crop Improvement in Thailand,” Proceedings of the 7th Regional Cassava Workshop, Bangkok, 1 November-28 October 2002.
- M. Fregene, M. Suarez, J. Mkumbira, H. Kulembeka, E. Ndedya, A. Kulaya, S. Mitchel, U. Gullberg, H. Rosling, A. Dixon, R. Dean and S. Kresovich, “Simple Sequence Repeat Marker Diversity in Cassava Landraces: Genetic Diversity and Differentiation in an Asexually Propagated Crop,” Theoretical and Applied Genetics, Vol. 107, 2003, pp. 1083-1093. doi:10.1007/s00122-003-1348-3
- A. A. Raji, I. Fawole, M. Gedil and A. G. O. Dixon, “Genetic Differentiation Analysis of African Cassava (Manihot esculenta) Landraces and Elite Germplasm Using Amplified Fragment Length Polymorphism and Simple Sequence Repeat Markers,” Annals of Applied Biology, Vol. 155, 2009, pp. 187-199.
- M. Montero-Rojas, A. M. Correa and D. Siritunga, “Molecular Differentiation and Diversity of Cassava (Manihot esculenta) Taken from 162 Locations across Puerto Rico and Assessed with Microsatellite Markers,” AoB Plants, 2011, plr010. doi:10.1093/aobpla/plr010
- P. Chavarriaga-Aguirre, M. Maya, M. Bonierbale, S. Kresovich, M. Fregene, J. Tohme and G. Kochert, “Microsatellites in Cassava (Manihot esculenta Crantz): Discovery, Inheritance and Variability,” Theoretical and Applied Genetics, Vol. 97, No. 3, 1998, pp. 493-501. doi:10.1007/s001220050922
- O. Rocha, M. Zaldimar, L. Castro, E. Castro and R. Barrantes, “Microsatellite Variation of Cassava (Manihot esculenta Crantz) in Home Gardens of Chibchan Amerindians from Costa Rica,” Conservation Genetics, Vol. 9, No. 1, 2008, pp. 107-118. doi:10.1007/s10592-007-9312-4
- S. Sakuanrungsirikul, P. Sarawat, P. Wongtiem, S. Sarakarn, V. Khonsantear and R. Khantahad, “Molecular Characterization of the CIAT Cassava Core Collection and the Thai and Lao Germplasm Collection Using ISSR-Touchdown PCR,” Proceedings of the 8th Regional Workshop, Vientiane, 20-24 October 2008.
- B. Ruttawat, P. P. Wangsomnuk and P. Wangsomnuk, “Genetic Studies of Selected Thai Cassava by SSR Markers,” Proceedings of the 12th Graduate Research Conference, KhonKaen University, 28 January 2011.
- O. H. Frankel, “Genetic Perspectives of Germplasm Conservation,” In: W. K. Arber, K. Llimensee, W. J. Peacock, and P. Starlinger, Eds., Genetic Manipulation: Impact on Man and Society, Cambridge University Press, Cambridge, 1984, pp. 161-170.
- O. H. Frankel and A. H. D. Brown, “Plant Genetic Resources Today: A Critical Appraisal,” In: J. H. W. Holden and J. T. Williams, Eds., Crop Genetic Resources: Conservation & Evaluation, George Allen & Unwin, London, 1984, pp. 249-257.
- Y. B. Fu, “Redundancy and Distinctness in Flax Germplasm as Revealed by RAPD Dissimilarity,” Plant Genetic Resources, Vol. 4, 2006, pp. 117-124. doi:10.1079/PGR2005106
- T. H. Tai and S. D. Tanksley, “A Rapid and Inexpensive Method for Isolation of Total DNA from Dehydrated Plant Tissue,” Plant Molecular Biology Reporter, Vol. 8, No. 4, 1990, pp. 297-303. doi:10.1007/BF02668766
- R. E. C. Mba, P. Stephenson, K. Edwards, S. Melzer, J. Nkumbira, U. Gullberg, K. Apel, M. Gale, J. Tohme and M. Fregene, “Simple Sequence Repeat (SSR) Marker Survey of the Cassava (Manihot esculenta Crantz) Genome: Towards an SSR-Based Molecular Genetic Map of Cassava,” Theoretical and Applied Genetics, Vol. 102, No. 1, 2001, pp. 21-31. doi:10.1007/s001220051614
- A. A. Raji, J. V. Anderson, O. A. Kolade, C. D. Ugwu, A. G. Dixon and I. L. Ingelbrecht, “Gene-Based Microsatellites for Cassava (Manihot esculenta Crantz): Prevalence, Polymorphisms, and Cross-Taxa Utility,” BMC Plant Biology, Vol. 9, 2009, p. 118. doi:10.1186/1471-2229-9-118
- S. Kunkeaw, T. Yoocha, S. Sraphet, A. Boonchanawiwat, O. Boonseng, D. A. Lightfoot, K. Triwitayakorn and S. Tangphatsornruang, “Construction of a Genetic Linkage Map Using Simple Sequence Repeat Markers from Expressed Sequence Tags for Cassava (Manihot esculenta Crantz),” Molecular Breeding, Vol. 27, No. 1, 2010, pp. 67-75. doi:10.1007/s11032-010-9414-4
- B. J. Bassam, G. Caetano-Anollés and P. M. Gresshoff, “Fast and Sensitive Silver Staining of DNA in Polyacrylamide Gels,” Analytical Biochemistry, Vol. 196, No. 1, 1991, pp. 80-83. doi:10.1016/0003-2697(91)90120-I
- F. Awoleye, M. van Duren, J. Dolezel and F. J. Novak, “Nuclear DNA Content and in Vitro Induced Somatic Polyploidization Cassava (Manihot esculenta Crantz) Breeding,” Euphytica, Vol. 76, No. 3, 1994, pp. 195-202. doi:10.1007/BF00022164
- D. L. Jennings, “Manihot esculenta (Euphorbiaceae),” In: J. Smartt and N. W. Simmonds, Eds., Evolution of Crop Plants, Wiley, New York, 1995, pp. 128-132.
- M. H. Reyes-Valdes and C. G. Williams, “An Entropy- Based Measure of Founder Informativeness,” Genetics Research, Vol. 85, No. 1, 2005, pp. 81-88.
- R. Peakall and P. E. Smouse, “GENALEX 6: Genetic Analysis in Excel. Population Genetic Software for Teaching and Research,” Molecular Ecology Notes, Vol. 6, No. 1, 2006, pp. 288-295. doi:10.1111/j.1471-8286.2005.01155.x
- F. J. Rohlf, “NTSYS-pc 2.1. Numerical Taxonomy and Multivariate Analysis System,” Exeter Software, Setauket, 1997.
- R. Silva, G. Bandel and P. Martins, “Mating System in an Experimental Garden Composed of Cassava (Manihot esculenta Crantz) Ethnovarieties,” Euphytica, Vol. 134, No. 2, 2003, pp. 127-135. doi:10.1023/B:EUPH.0000003644.60126.4a
- L. F. Turyagyenda, E. B. Kizito, M. E. Ferguson, Y. Baguma, J. W. Harvey, P. Gibson, B. W. Wanjala and D. S. O. Osiru, “Genetic Diversity among Farmer-Preferred Cassava Landraces in Uganda,” African Crop Science Journal, Vol. 20, No. S1, 2012, pp. 15-30.
- M. Elias, L. Penet, P. Vindry, D. Mckey, O. Panaud and T. Robert, “Unmanaged Sexual Reproduction and the Dynamics of Genetic Diversity of a Vegetatively Propagated Crop Plant, Cassava (Manihot esculenta Crantz), in a Traditional Farming System,” Molecular Ecology, Vol. 10, No. 8, 2001, pp. 1895-1907. doi:10.1046/j.0962-1083.2001.01331.x
- J. Sardos, E. Mackey, M. F. Duval, R. Malapa, J. L. Noyer and V. Lebot, “Evolution of Cassava (Manihot esculenta Crantz) after Recent Introduction into a South Pacific Island System: The Contribution of Sex to the Diversification of a Clonally Propagated Crop,” Genome, Vol. 51, No. 11, 2008, pp. 912-921. doi:10.1139/G08-080
- A. El Bakkali, H. Haouane, A. Moukhli, E. Costes, P. V. Damme and B. Khadar, “Construction of Core Collections Suitable for Association Mapping to Optimize Use of Mediterranean Olive (Oleaeuropaea L.) Genetic Resources,” PLoS ONE, Vol. 8, No. 5, 2013, Article ID: e61265. doi:10.1371/journal.pone.0061265
- A. Diederichsen, P. M. Kusters, D. Kessler, Z. Bainas and R. K. Gugel, “Assembling a Core Collection from the Flax World Collection Maintained by Plant Gene Resources of Canada,” Genetic Resources and Crop Evolution, Vol. 60, No. 4, 2013, pp. 1479-1485. doi:10.1007/s10722-012-9936-1
NOTES
*Corresponding author.