American Journal of Plant Sciences
Vol.4 No.7A1(2013), Article ID:34786,4 pages DOI:10.4236/ajps.2013.47A1005
On the Pollen Detection with Photoacoustic Imaging
![]()
Graduate School of Engineering, Tohoku Gakuin University, Tagajo, Japan.
Email: tpth@tjcc.tohoku-gakuin.ac.jp
Copyright © 2013 Tsutomu Hoshimiya. This is an open access article distributed under the Creative Commons Attribution License, which permits unrestricted use, distribution, and reproduction in any medium, provided the original work is properly cited.
Received May 6th, 2013; revised June 7th, 2013; accepted July 5th, 2013
Keywords: Pollen; Counting; Photoacoustic; Microscope; Imaging
ABSTRACT
A photoacoustic (PA) imaging that utilizes acoustic detection of sound generated by a specimen due to the absorption of modulated light was applied to measure the amount of the pollen of the Cryptomeria japonica, Asian allergic plant. High-sensitivity PA imaging can measure pollen particles with a large dynamic range from single particle to several hundred micrograms. The PA signal dependence on the amount of the pollen showed good correlation with the amount of pollen.
1. Introduction
Cryptomeria japonica (CJ) is one of an evergreen needle-leafed tree and indigenous race of Taxodiaceae, which is distributed among far-east Asia (China, Korea and Japan), and is famous for its allergic function against eyes and nose like hogweeds. Therefore, the counting of the amount of its pollen is important in the environmental science [1]. The conventional determination of the amount of CJ pollen has been the Durham method [2,3] based on eye inspection has dominated until now.
In order to achieve an automated pollen count, various methods including laser scattering have been introduced. However if optical detection such as CCD was adopted, it is difficult to achieve both high-sensitivity and wide dynamic range of detection because precise particle counting will be unavailable in the case of overlapping or stacking of pollen particles as shown in Figure 1(a). On the other hand, photoacoIstic (PA) detection has both highsensitivity and wide dynamic range, because even in the regime of random and multiple scattering of light the absorption of the scattered light by the total absorber can be summed up and detected with photoacoustic detection (Figure 1(b)). In this paper, the application of aphotoacoustic microscope (PAM) to the measurement of the amount of CJ pollen was described [4-6].
2. Experimental Apparatus
The basic experimental setup of a PAM is similar to the previous publicatios [7,8] and shown in Figure 2. The apparatus is basically adopted gas-microphone (Brewer & Kaejer 4166) detection and linear-motor stage (Chuo Seiki, ALD-105-H1L) driving system. The advantages of using slide stages controlled by linear motors are the quietness for condenser microphone detection and highspatial resolution. The device has a spatial resolution of 30 μm, as measured by the knife-edge method.
3. Specimens and Procedure
The collected pollen particles were chosen to be specimens. Size of the CJ pollen of single particle is the about 30 µm in diameters. The pollen was collected and fixed on an adhesive tape on a slide-glass set in a PA cell. Exceptionally. CJ pollen particles ranging from one to ten were fixed on the albumen (egg white).
4. Results and Discussions
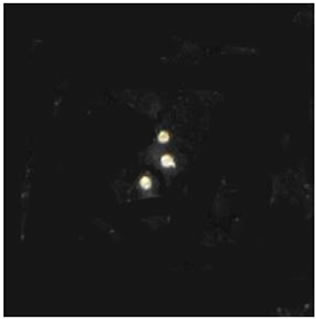
The optical and PA amplitude images of three pollen particles were shown in Figures 3(a) and (b), respectively. It was obtained at a modulation frequency of 90 Hz.
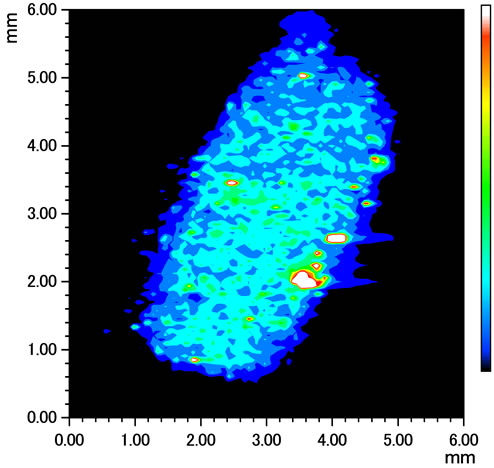
In Figure 4(a), a color graphics of the amplitude image with resolution of 100 × 100 pixels obtained for pollen amount of 0.34 mg is shown. In Figure 4(b), a bird’seye view was shown. The PA amplitude image was integrated over the specimen surface. As a result, the integrated PA signal is regarded to be proportional to the amount of pollen. The calibration curve for pollen particles ranging from four to ninety-one particles was shown in Figure 5. On the other hand, that corresponding to
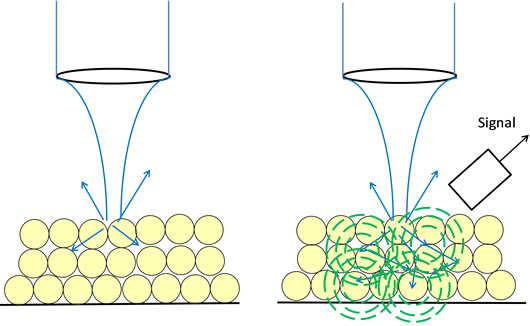
Figure 1. Schematic of (a) optical detection and (b) photoacoustic detection.
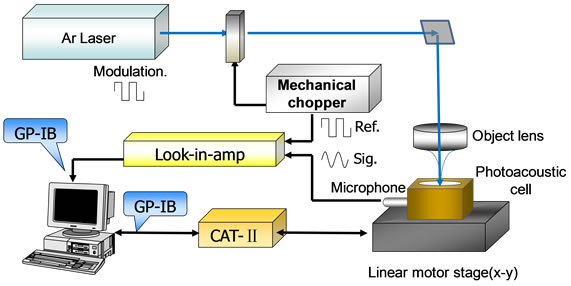
Figure 2. Experimental setup.
 (a)
(a)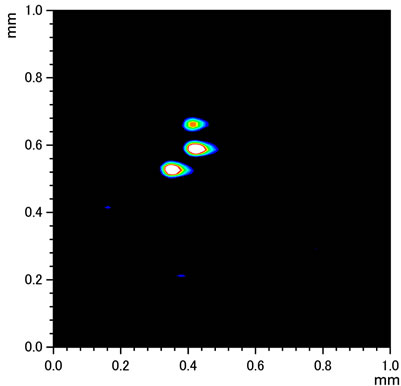 (b)
(b)
Figure 3. (a) Optical image (left) and (b) photoacoustic image (right) of three pollen particles.
 (a)
(a)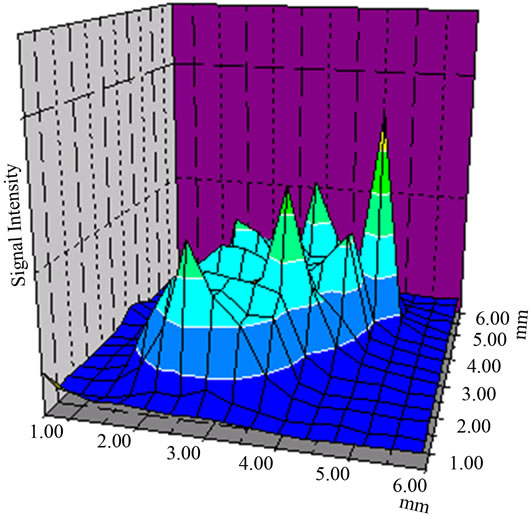 (b)
(b)
Figure 4. (a) Color graphics and (b) bird’s-eye view of PA amplitude image for pollen amount of 0.34 mg. The amount of the CJ pollen corresponding to this image was 0.34 mg. The size of the scannedareas was 6 × 6 mm, and the resolution was 100 × 100 pixels. The laser power was 10 mW.
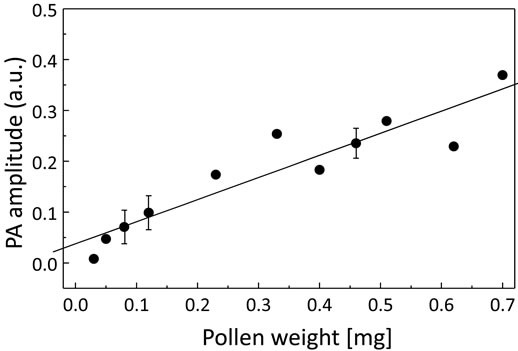
Figure 5. Calibration curve for pollen particles.
pollen amount of 0.03 to 0.70 mg was shown in Figure 6. These data showed that the PA pollen measurement with large dynamic range has been achieved.
To reduce interfering PA noise that might be generated by other particles, differential absorption PA method [7,8] is favorable. Author’s group is developing a multi-pleco-lor LED and LD PA imaging system. The former [9] shows a good color reproducing ability, and the latter will exhibit better resolution so that it will be a good candidate of pollen detector.
For example, if we use diode-pumped solid-state lasers (DPSSL). Blue (457 nm) and green (532 nm) lights are easily available. As shown in Figure 3, absorbance of CJ pollen at these wavelengths is different enough to use differential absorption PA imaging to reduce disturbing soils and other interfering particles.
The optical and PA amplitude images of three pollen particles were shown in Figures 3(a) and (b), respectively. It was obtained at a modulation frequency of 90 Hz.
In Figure 4(a), a color graphics of the amplitude image obtained for pollen amount of 0.34 mg is shown. In Figure 3(b), a bird’s-eye view was shown. The PA amplitude image was integrated over the specimen surface. As a result, the integrated PA signal is regarded to be proportional to the amount of pollen. The calibration curve for pollen particles ranging from four to ninety particles was shown in Figure 5. On the other hand, that corresponding to pollen amount of 0.05 to 0.70 mg was shown in Figure 6. These data showed that the PA pollen measurement with large dynamic range has been achieved.
To reduce interfering PA noise that might be generated by other particles, differential absorption PA method [7] is favorable. Author’s group is developing a multiplecolor LED and LD PA imaging system. The former [8] shows a good color reproducing ability, and the latter will exhibit better resolution so that it will be a good candidate of pollen detector.
For example, if we use diode-pumped solid-state lasers (DPSSL), blue (457 nm) and green (532 nm) lights are easily available. As shown in Figure 7, absorbance of CJ pollen at these wavelengths is different enough to use differential absorption PA imaging to reduce disturbing soils and other interfering particles.
5. Conclusion
A PAM was applied to the visualization, counting and measurement of pollen particles. Integration of PA amplitude signal over the specimen showed good agreement with pollen number or mass weight. The correlation coefficient of about 0.94 was obtained. Therefore, pollen measurement using the photoacoustic microscopy will be expected to be realized in the near future.
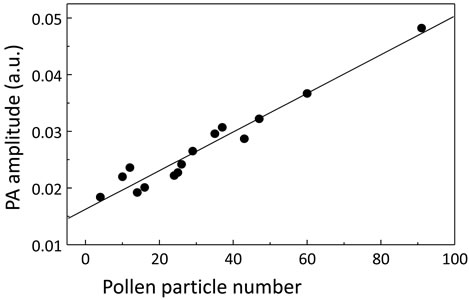
Figure 6. Calibration curve for pollen amount.
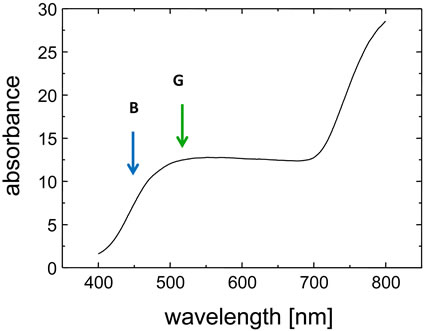
Figure 7. Absorption spectrum of the CJ pollen.
REFERENCES
- M. Okuda and T. Shida, “Clinical Aspects of Japanese Cedar Pollinosis,” Allergology International, Vol. 47, No. 1, 1998, pp. 1-8. doi:10.2332/allergolint.47.1
- W. W. Duke and O. C. Durham, “Pollen Content of the Air: Relationship to the Symptoms and Treatment of HayFever, Asthma and Eczema,” The Journal of the American Medical Association, Vol. 90, No. 19, 1928, pp. 1529- 1532. doi:10.1001/jama.1928.02690460009005
- O. C. Durham, “The Volumetric Incidence of Atmospheric Allergens: IV. A Proposed Standard Method of Gravity Sampling, Counting, and Volumetric Interpolation of Results,” Journal of Allergy, Vol. 17, No. 2, 1949, pp. 79-86. doi:10.1016/0021-8707(46)90025-1
- K. Miyamoto, T. Hoshimiya and K. Gohkon, Proceedings of 2002 IEEE Ultrasonic Symposium, Munich, 2002, pp. 445-448.
- K. Miyamoto and T. Hoshimiya, “Nonlinear Vibration of Liquid Droplet by Surface Acoustic Wave Excitation,” The Japan Society of Applied Physics, Vol. 41, No. 2002, 2002, pp. 3361-3362. doi:10.1143/JJAP.41.3465
- K. Miyamoto and T. Hoshimiya, “Measurement of the Amount and Number of Pollen Particles of Cryptomeria Japonica (Taxodiaceae) by Imaging with a Photoacoustic Microscope,” IEEE Transactions on Ultrasonics, Ferroelectrics and Frequency Control, Vol. 53, No. 3, 2006, pp. 586-591. doi:10.1109/TUFFC.2006.1610567
- T. Hoshimiya, “On the Differential Absorption Photoacoustic Spectroscopy,” The Japan Society of Applied Physics, Vol. 22, No. 1983, 1983, pp. 203-204. doi:10.1143/JJAP.22.203
- Y. Adachi and T. Hoshimiya, “Photoacoustic Imaging with Multiple-Wavelength Light-Emitting Diodes,” The Japan Society of Applied Physics, Vol. 52, No. 2013, 2013, 4 p.