American Journal of Plant Sciences
Vol.3 No.12(2012), Article ID:25781,5 pages DOI:10.4236/ajps.2012.312206
Variation of Physiochemical Components of Acid Lime (Citrus aurantifolia Swingle) Fruits at Different Sides of the Tree in Nepal
![]()
1Agricultural Research Station (ARS), Dhankuta, Nepal; 2Institute of Agriculture and Animal Science (IAAS), Chitwan, Nepal; 3Horticulture Research Division (HRD), Khumaltar, Lalitpur; 4Nepal Academy of Science and Technology (NAST), Lalitpur, Nepal.
Email: *rals_135@yahoo.com
Received September 4th, 2012; revised October 16th, 2012; accepted November 14th, 2012
Keywords: Ascorbic Acid; Agro-Ecological Zone; TSS; TA; Juice
ABSTRACT
Acid Lime (Citrus aurantifolia Swingle) is one of the important commercial fruits cultivated from terai to high hill of Nepal. It is an important source of vitamin “C” (ascorbic acid) for human nutrition. Amount of juice, TSS (Total soluble solids), TA (Titrable acid) and vitamin C are the determining factors of quality of acid lime fruits which may vary according to bearing sides of the trees. The main objective of this study is, to determine the variation of fruit quality at different sides of the tree. Total of 15 bearing trees were selected randomly (5 trees per site) from three different agro ecological domain representing terai (<600 m asl), mid hills (600 to 1200 m asl) and high hill areas (>1200 m asl) and samples were collected from the selected trees. Randomly ten fruits (from east, west, centre, north and south sides) were collected from each tree and analyzed for amount of vitamin C, TSS, TA and juice. Highest ascorbic acid 79.6 mg and 69.9 mg was observed in south side fruits whereas lowest 62.8 mg and 55.1 mg was observed in centre fruits in the high and mid hills zone respectively, but in terai, highest ascorbic acid 58.7 mg was observed in north side and lowest 41.8 mg was observed in centre. Highest amount of juice 43.9% was observed in south side fruits and lowest 36.6% in centre fruits, but amount of TSS 8.2% and TA 7.2% was observed in south side fruits and lowest 7.3% TSS and 7.0% TA was observed in centre fruits in high hills. In terai highest TSS 8.3% and TA 7.4% was observed in north side fruits and lowest TSS 7.3% and TA 6.7% was observed in centre fruits. Variation of TSS, TA percent and ascorbic acids was observed according to the agro ecological zone.
1. Introduction
Acid Lime (Citrus aurantifolia Swingle) is one of the important commercial fruits, which has been cultivated in 60 out of 75 districts of Nepal [1]. It is considered as high value commodity and has given number one priority by Master Plan for Horticulture Development [2]. The cultivation range of acid lime fruits are scattered from terai to high hills and east to west in Nepal. The total area under citrus cultivation is about 26,681 ha, out of which acid lime (Citrus aurantifolia) covers 4183 ha. Within the citrus fruit species, acid lime comes under third position after Mandarin and Sweet orange in terms of area and production. The total production of acid lime in Nepal was recorded at 20,492 tons per year, with productivity 8.4 tons/ha [3]. In Nepal, Eastern Development Region (EDR) has the highest area and production (7987 mt) of acid lime. It is used for juice, desert, pickle and other medicinal purpose. Juices contain approx 40 - 60 mg ascorbic acid per 100 g fresh weights [4].
The organic acid component of acid lime juice is primarily composed of citric acid. The soluble solid of the juice consist mainly of sugar and citric acid. The total acid content in acid lime is varied ranges from 5% - 7.5% and total soluble solid 5.5% - 8.5% [5]. The acid content in juice plays an important role in determining the quality of a variety as well as maturity indices of fruit [6]. In citrus species, amount of organic acid is genetically controlled [7]. In his report, a seedless variety of lime (Chakradhar) is content 60 - 66 percent juice, vitamin C (ascorbic acid) 118.2 - 140.8 mg/100g and citric acid 8.3% - 9.1%. Ascorbic acid is one of the most important vitamins found in acid lime juices. The main contribution of citrus fruits in human nutrition is undoubtedly their supply of vitamins especially ascorbic acid. Daily vitamin C intake 5 mg is sufficient to prevent the symptoms of scurvy in an adult [8], but requirements of vitamin C was estimated of 30 - 60 mg for full grown adult and an orange a day can fulfill this requirement and ensure good health. Amount of ascorbic acid, juice, TSS and TA contents is influenced by variety, cultural practice, maturity, climate, fruit growth stage and bearing side of the tree [9]. Physicochemical composition of lime fruits like juice, TSS, TA and vitamin C is the important parameter to determine the quality, which may be influenced by the climate, altitude, temperature, soil and bearing sides of the trees. Fruiting side of the tree is one of the important factors that determined the quality of fruits. Producers, consumers and traders have a very limited knowledge in this aspect. It is necessary to study the variation of fruit quality at different side of the tree for processing and marketing. Therefore, the main objectives of this study is to determined the concentration of vitamin C, TSS, TA and juice percent of lime fruits at different sides of the tree. Findings of the study will help to select the best quality of lime fruits for commercialization and industrial uses.
2. Materials and Methods
2.1. Fruit Sample Collection
A total of 15 bearing trees were selected randomly (5 tree per site) from three different agro ecological domain (Table 1), representing Terai (<600 m asl), mid hill areas (600 to 1200 m asl) and high hill areas (>1200 m asl). Total 150 fruits sample were collected from three sites. Randomly ten fruits (2 fruits per dimension) from five dimensions (east, west, north, south and centre) were collected from each selected trees. The study was arranged in RCBD design. All the bearing sides of the fruits are the treatments and individual trees of each site are as replications. All the data were analyzed in M stat C software package.
2.2. Chemical Composition Analysis
Juice was extracted and juice percent were measured on the basis of fruit weight. Titrable acids (TA) and Vitamin C were analyzed in the Post Harvest Technology and Research Unit laboratory, Khumaltar, Lalitpur. Total soluble solids (TSS) were measured with the help of Refrectometer. Titrable acids are calculated by (2 ml of juice was titrated with 0.2 N sodium hydroxide to phenolphthalein endpoint and total acid percent was calculated) using following formula [10].
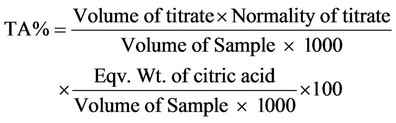
2.3. Vitamin C (Ascorbic Acid)
Vitamin C (Ascorbic acid) was determined by the 2,6- dichlorophenol indophenols titration method and calculated by the following formula [11].

3. Results
3.1. Ascorbic Acid (Vitamin C)
High variation of ascorbic acid in the fruits was observed in the different side of bearing trees. Various amount of ascorbic acids was found in the acid lime fruits across the agro-ecological zone within the single trees. The amount of ascorbic acid was found to be increased in the high hills as compared to terai zone. Highest ascorbic acid 79.6 mg was observed in south side fruits, and lowest 62.8 was mg in north side fruits in high hills samples, whereas highest 69.9 mg in south and lowest 55.1 mg in
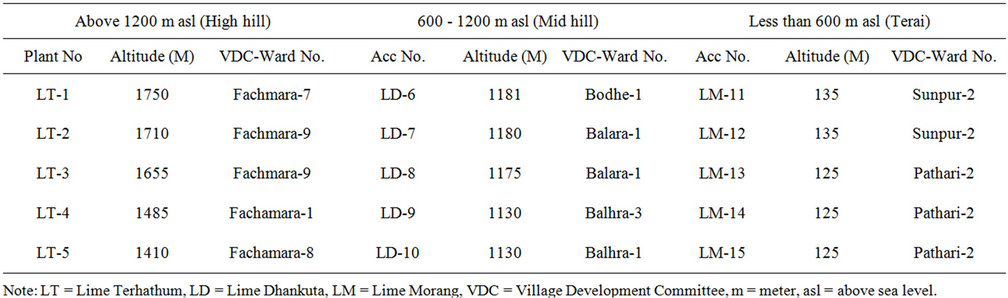
Table 1. Altitudinal range, accessions number and locality details of fruit sample collection sites of acid lime landraces.
centre was observed in mid hills sample, but in terai highest ascorbic acid 58.7 mg per 100 g juice was observed in north side fruits and lowest 41.8 mg was observed in centre fruits. Among the total samples, amount of ascorbic acid 68.3 mg was highest in high hills followed by 62.2 mg in mid hills sample and 49.7 mg in terai samples (Table 2). The coefficient variation is higher 14.7% in terai and lower 3.88% in high hills where as non significant results of ascorbic acid within the fruiting aspect was observed in all ecological zone.
3.2. Juice
Changes in the amount of juice were observed in the different side of the fruits. Highest amount of juice 43.9% was observed in south side fruits and lowest 36.6% in centre fruits in high hill samples. Similar result was observed in mid hills samples but in terai lowest juice was observed in north aspect fruits. Variation of juice percent was observed according to the agro ecological zone. Average amount of juice was highest 44.3% in terai samples followed by 40% in high hills and 39.9% in mid hill samples. The coefficient variation is higher 8.9% in mid hills and lowest 5.73% in terai whereas no significant result in juice percent was found in all ecological zone (Table 2).
3.3. TSS and TA
Variation in the percent of TSS and TA was observed in the different side of bearing fruits. Highest amount of TSS 8.2% was observed in south side fruits and lowest 7.3% in centre samples in high hill samples. Similar result was observed in mid hills samples but in terai highest TSS was 8.3% observed in north side fruits and lowest 7.3% was in centre fruits. Variation of TSS percent was observed according to the agro ecological zone. Average amount of TSS was 7.8% in terai samples followed by 7.7% in mid hill and 7.6% in high hills samples. The coefficient variation was 5.06% in terai and 3.81% in mid hills. No significant result in TSS percent in all high and mid hills sample whereas highly significant result in TSS percent was observed in terai. Similarly highest amount of TA was observed in south aspect fruits 7.9% and lowest 7.1% in centre samples in high hill samples. Similar result was observed in mid hills samples but in terai highest TA was observed 7.4% in north side fruits and lowest was 6.7% in centre fruits. Variation of TSS percent was observed according to the agro ecological zone. Average amount of TA was highest 7.3% in high hills samples followed by 7.2% in mid hill and 7.0% in terai samples. The coefficient variation is higher was 4.51% in mid hills and lowest 3.06% in terai (Table 2). No significant result in TA percent in terai sample whereas highly significant result in TA percent was observed in high and mid hills.
4. Discussion
In general the amount of ascorbic acid, juice, TSS and TA percent was found higher in the south side fruits in high hills and mid hill zone, but in terai, higher ascorbic acid, TSS and TA percent was found in north side fruit. There is no significant effect of fruiting sides in ascorbic acid and juice percent. Physicochemical composition of the fruits especially ascorbic acid, TSS and TA depends on the maturity stage and expose of sun light. Generally good sun shine is received in the southern side of fruits. Fruits from the north and centre side of the tree have considerably low sunshine and poor quality of fruits. In sweet orange fruits the exterior (sunlight) part content more vitamin C and sugar with significant correlation between sucrose and ascorbic acid content [12]. Green colour orange has less vitamin C than the orange coloured ones when harvested at the same time. Fruits
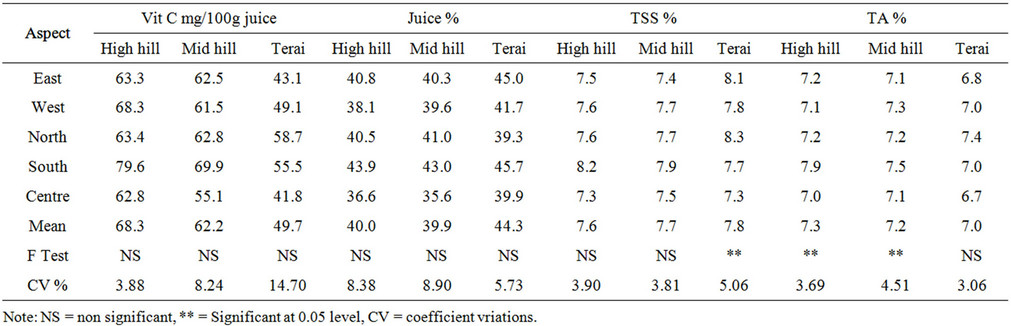
Table 2. Agro ecological zone and variation of physicochemical characteristics of acid lime fruits bearing at different aspect of the tree.
growth on the south side of the tree has higher acidity than fruit on the other side [13]. Fruits exposed on sun light have significantly had higher ascorbic acid content [14].
Loss of vitamin C was occurs in the oxidation process, when juice is extracted. It is due to activation of enzymatic system and oxidation process. Enzyme such as ascorbic acid oxidase, phenolase, cytochrome oxidase, and perioxidase can oxidize vitamine C. Phenolic compounds, flevonoids, and acid can inhibit enzyme and non enzymatic oxidation [8]. Dehydro ascorbic acid (DHA) in oxidized form is also biologically active as L ascorbic acid (reduced form). The level of DHA increases during storage of citrus fruit.
Acid lime contents juice 50% - 52%, acidity of 6.2% - 6.9%, TSS of 6.2% - 8% could be used as index of harvesting maturity in acid lime [15]. The juice percent in the fruit increased continuously with some fluctuation and the maximum value of 51.1% was attained at maturity [16]. In Andra Pradesh quality standard for acid lime fruits content is 45% - 58% juice and 6.7% - 7.7% citric acid. The acid lime grown in South India had average yield of juice varied from 45% - 58% of acidity from 6.2% - 7.6% in maturity and number of seed was 12 per fruit [17]. There was significant positive relation between seed number and weight of the fruit. The size of fruit may not be a reliable criteria for maturity depending on the bearing and nutrient status of the plant. Fruits are matured even in the small size, round shape, thin peel, juicy and high acidic with less number of seed are the major characteristics of good quality lime fruit [18]. Side of the tree affects the maturity of fruits, due to uneven sunlight [19]. Acid content decreased when rise in temperature during stage of fruit development takes place [20]. Under the tropical condition level of TSS increases due to high vegetative growth and in sub tropical climate fruits have good colour, smooth surface and high TA due to low humidity and good sunshine, whereas in humid zone fruits have thick peel, rough surface and juicy fruits [21].
5. Conclusion
Highest ascorbic acid was observed in south side and lowest in north side fruits in high hills and mid hills sample whereas, in terai highest ascorbic acid was observed in north side and lowest was in centre. Average amount of ascorbic acid was highest in high hills followed by mid hill and terai. Highest amount of juice, TSS and TA was observed in south side fruits and lowest in centre samples in high hill samples. Similar result was observed in mid hills samples but in terai highest TSS and TA was observed in north side fruits and lowest was found in centre. Variation of TSS percent was observed according to the agro ecological zone. Average amount of TSS was higher in terai samples followed by mid hill and high hills samples. Result of the study was proved that, quality of lime fruits is better in the south aspect fruits in the mid and high hills but north aspect in terai.
6. Acknowledgements
The authors are highly acknowledged to the chief of Post harvest research unit, Khumaltar, Lalitpur providing lab facility and their staffs for accessing in lab work.
REFERENCES
- NCRP, “Annual Report,” Nepal Agricultural Research Council, National Citrus Research Program, Paripatle, 2006.
- MPHD, “Master Plan for Horticulture Development in Nepal,” The Plan Main Report, Vol. 1, Demand and Marketing Analysis, Vol. 8, Ministry of Agriculture, Katmandu, 1990.
- MOAC, “Statistical information of Nepalese Agriculture,” Ministry of Agriculture and Cooperatives, Agri Business Promotion and Statistical Division, Singh Durbar, Kathmandu, 2008.
- G. D. Subedi and H. J. Jacobsen, “Establishment of Tissue Culture Techniques in Citrus Species,” Proceedings of International Conference on Biotechnology and Biodiversity, Katmandu, 14-16 November 2000.
- R. K. Soost and J. W. Cameron, “Fruit Characters in Young Trees of Long-Established Nucellar Lines,” Proc. 2nd Conf. Intern. Org. Citrus Virol., 1961, pp. 8-14.
- P. Koehler-Santos, A. L. Dornelles and L. B. Freitas, “Characterization of Mandarin Citrus Germplasm from Southern Brazil by Morphological and Molecular Analyses,” Pesquisa Agropecuária Brasileira, Vol. 38, No. 7, 2003, pp. 797-806. doi:10.1590/S0100-204X2003000700003
- D. Q. Fang and M. L. Roose, “Identification of Citrus Cultivars with Inter-Simple Sequence Repeat Markers,” Theoretical and Applied Genetics, Vol. 95, 1997, pp. 408- 417. doi:10.1007/s001220050577
- L. W. Mapson, “The Vitamins,” Vol. 1, Academic Press, London and New York, 1987, p. 385.
- N. Steven, “Vitamin C Contents of Citrus Fruit and Their Products: A Review,” Journal of Agricultural and Food Chemistry, Vol. 28, No. 1, 1980, pp. 8-18. doi:10.1021/jf60227a026
- S. Rangana, “Hand Book of Analysis and Quality Control for Fruit and Vegetable Products,” Tata McGraw-Hills Publishing Company Limited, New Delhi, 1995.
- B. C. Jonsan, “Methods of Vitamin Determination,” 3rd Edition, Inter Science Publisher, New York, 1966, p. 287.
- H. Izumi, T. Ito and Y. Yoshida, “Relationship between Ascorbic Acid and Sugar Content in Citrus Fruit Peel during Growth and Development,” Journal of the Japanese Society for Horticultural Science, Vol. 57, 1988, pp. 304-311. doi:10.2503/jjshs.57.304
- S. Hattori, Y. Okamoto and T. Shiizaki, “Distribution of Chemical Component in Orange, Nosan Kako Gijustu Kenkyu Kaishi,” Chemical Abstract, Vol. 53, No. 6, 1959, pp. 37-40.
- W. B. Sinclair, “The Biochemistry and Physiology of the Lemon and Other Citrus Fruits,” Division of Agriculture and Natural Resources, University of California, Fremont, 1984, p. 946.
- M. T. Jawaharlal, T. Thangaraj and I. Irulappan, “A Note on the Post Harvest Qualities of Acid Lime,” South Indian Hort, Vol. 40, No. 1, 1992, pp. 229-230.
- S. V. Hitalmani and M. M. Rayo, “Studies on Changes in Physical Parameters of the Developing Kagzi Lime (C. aurantifolia) Fruits,” South Indian Hort, Vol. 24, No. 3, 1970, pp. 122-126.
- G. S. Siddapa, “Quakity Standard for South Indian Citrus Fruit,” Indian Journal of Horticulture, Vol. 9, No. 1, 1992, pp. 7-24.
- K. P. Paudyal and R. L. Shrestha, “Diversity Study and Selection of Lime (Citrus aurantifolia) Genotypes for Expansion of Production Period in Nepal,” Proceeding of the 4th National Horticulture workshop, Khumaltar, 2-4 March 2004.
- D. S. Gill, O. S. Singh, W. S. Brara and G. S. Chauhan, “Relationship of Position of Fruits on the Tree with Different Maturity Indices of Knnow Mandarin,” Indian Journal of Horticulture, Vol. 42, No. 2, 1985, pp. 229- 236.
- B. S. Dhillon and J. S. Randhawa, “Fruit Growth and Development in Citrus,” In: K. L. Chanda and O. P. Pareek, Eds., Advance in Horticulture, Vol. 3, Malhotra Publishing House, New Delhi, 1993, pp. 1667-1683.
- W. B. Hayes, “Fruit Growing in India,” Kalyani Publisher, New Delhi, 1975, pp. 280-290.
NOTES
*Corresponding author.