American Journal of Plant Sciences
Vol.3 No.6(2012), Article ID:20020,7 pages DOI:10.4236/ajps.2012.36088
Genetic Variation in Picea mariana × P. rubens Hybrid Populations Assessed with ISSR and RAPD Markers
![]()
Department of Biology, Laurentian University, Sudbury, Canada.
Email: knkongolo@laurentian.ca
Received February 1st, 2012; revised March 1st, 2012; accepted March 20th, 2012
Keywords: Picea mariana; Picea rubens; Interspecific Hybrids; Inter Simple Sequence Repeat; Random Amplified Polymorphic DNA
ABSTRACT
Interspecific hybridization can result in significant shifts in allele frequencies. The objective of the present study was to assess the level of genetic variation in populations of P. mariana × P. rubens hybrids derived from artificial crosses. Progenies from backcross populations created through a series of controlled pollinations among P. mariana and P. rubens trees across the hybridization index were analyzed. Several Inter Simple Sequence Repeat (ISSR) and Random Amplified Polymorphic DNA (RAPD) primers were used to amplify genomic DNA samples from each population. ISSR primers produced from 30% to 52% polymorphic loci. The level of polymorphism was higher with RAPD markers, ranging from 57% to 76%. Overall, the two marker systems generated similar levels of polymorphic loci for P. mariana and P. rubens populations. No significant differences were found among the P. mariana × P. rubens populations analyzed and between the hybrids and the parental populations regardless of the molecular marker used. This confirms the genetic closeness of P. mariana and P. rubens species.
1. Introduction
Hybridization is an important factor affecting the evolution and ecology of plant populations. Lewontin and Birch [1] suggested that the introduction of genes from another species could serve as the raw material for an adaptive evolutionary advance compared to original hybridization. Genomic studies provided evidence that hybridization indeed facilitates major ecological transitions [2] and interspecific hybridizations have led to the development of new models in hybridization, which focus on introgression and adaptation [3]. By combining gene pools, interspecific hybridization results in the origin of new genotypes and significant shifts in allele frequencies. Compared to mutations and recombinations within species, interspecific hybridization can result in rapid and long lasting changes among inbreeding species. The evolutionary change due to hybridization can occur within one generation, thereby exposing new gene combinations to natural selection.
Picea mariana (black spruce) and P. rubens (red spruce) are morphologically very closely related, are capable of natural and artificial hybridization and they also share highly similar molecular marker profiles. Estimates of the degree of natural hybridization or introgression between the two species vary from extensive to minor
[4]. Controlled crosses by Manley [5] and Gordon [6] indicated reproductive barriers to hybridization; however, no record of the reproductive phenological barrier between these closely related species is reported in the literature. Manley and Legid [7] presented data supporting P. mariana and P. rubens to be largely ecologically isolated species, each exhibiting physiological characteristics that favor different ecological niches. Results from Manley [5] and Manley and Legid [7] indicated that artificially produced P. mariana × P. rubens hybrid seedlings displayed negative heterosis in growth and photosynthesis. The performances of hybrids were lower than that of either species. Examination of photosynthesis and stomatal conductance of mature trees by Johnsen [8] showed that hybrids did not have lower performance than either parental species.
The importance of P. mariana and P. rubens hybrids has been proven and several breeders and geneticist contribute to work toward their commercialization. Interspecific hybrids developed from the artificial crosses from these two species have not been characterized in detail. The hybrid index presently represents the most popular method of estimating the degree of hybridity of populations and individual plants. This method does not provide any information on the degree of hybrid genetic stability.
The objectives of the present study were to assess the level of genetic variation in populations of P. mariana × P. rubens hybrids made from artificial crosses using ISSR and RAPD marker systems.
2. Materials and Methods
2.1. Genetic Material
Picea mariana, Picea rubens and their hybrid seeds were obtained from the Canadian Forest Service seedbank in Fredericton (Table 1). These hybrids are progenies from backcross populations created through a series of controlled pollinations among P. mariana and P. rubens trees across the hybridization index. The hybrid index represents the most popular method of estimating the degree of hybridity of populations and individual plants. Fourteen hybrid populations (65 samples from each population) were analyzed. The samples also include parental P. mariana and P. rubens lines (Table 1). Seeds were placed in clear polycarbonate “Petawawa germination boxes” lined with a layer of wet filter paper. The boxes were placed in the fridge at 4˚C for 3 days to break dormancy, which were then transferred to a growth chamber at 24˚C. Leaf tissue were then harvested once they reached 5 cm in length and were frozen in liquid nitrogen and stored at –80˚C until DNA extraction.
2.2. DNA Extraction
The total cellular DNA from individual samples was extracted from seedling tissue using the method described by Nkongolo [9], with some modifications. The modifycation involved addition of PVP (polyvinylpyrrolidone) and β-mercaptoethanol to the CTAB extraction buffer. The DNA concentration was determined using the fluorochrome Hoechst 33258 (bisbensimide) fluorescent DNA quantitation kit from Bio-Rad (cat. # 170-2480) and the purity was determined using a spectrophotometer (Varian Cary 100 UV-VIS spectrophotometer).

Table 1. Plant materials used in the study.
2.3. ISSR and RAPD Analysis
Several ISSR and RAPD primers synthesized by Invitrogen were chosen for preliminary amplification with DNA samples from each population. The ISSR amplification was carried out in accordance with the method described by Nkongolo [9] and Nagaoka and Ogihara [10], with some modifications described by Mehes et al. [11]. All DNA samples were amplified with each of the primers used (Table 2). Polymerase Chain Reaction (PCR) amplification was performed in 25 µl volumes which contained 2.1 µl of 10× buffer (Applied Biosystems), 0.5 µl of 200 µM of each dNTP (dTTP, dATP, dCTP and dGTP), 2.5 µl of 2 mM MgCl2, 0.5 µl of 0.5 µM primer, 20 ng of genomic DNA template and 4 µl of 0.625 units of Taq polymerase (Applied Biosystems). For each primer a negative control reaction was included where ddH2O was added instead of DNA.
All PCR products were loaded into 2% agarose gel in 0.5X Tris-Borate-EDTA (TBE) buffer. Gels were prestained with 1 μl of ethidium bromide and run at 3.14V/cm for approximately 120 minutes. These agarose gels were visualized under UV light source, documented with the Bio-Rad ChemiDoc XRS system and analyzed for band presence or absence with the Discovery Series Quantity One 1D Analysis Software.
The resulting data matrix of the ISSR or RAPD phenotype was analyzed using POPGENE software (version
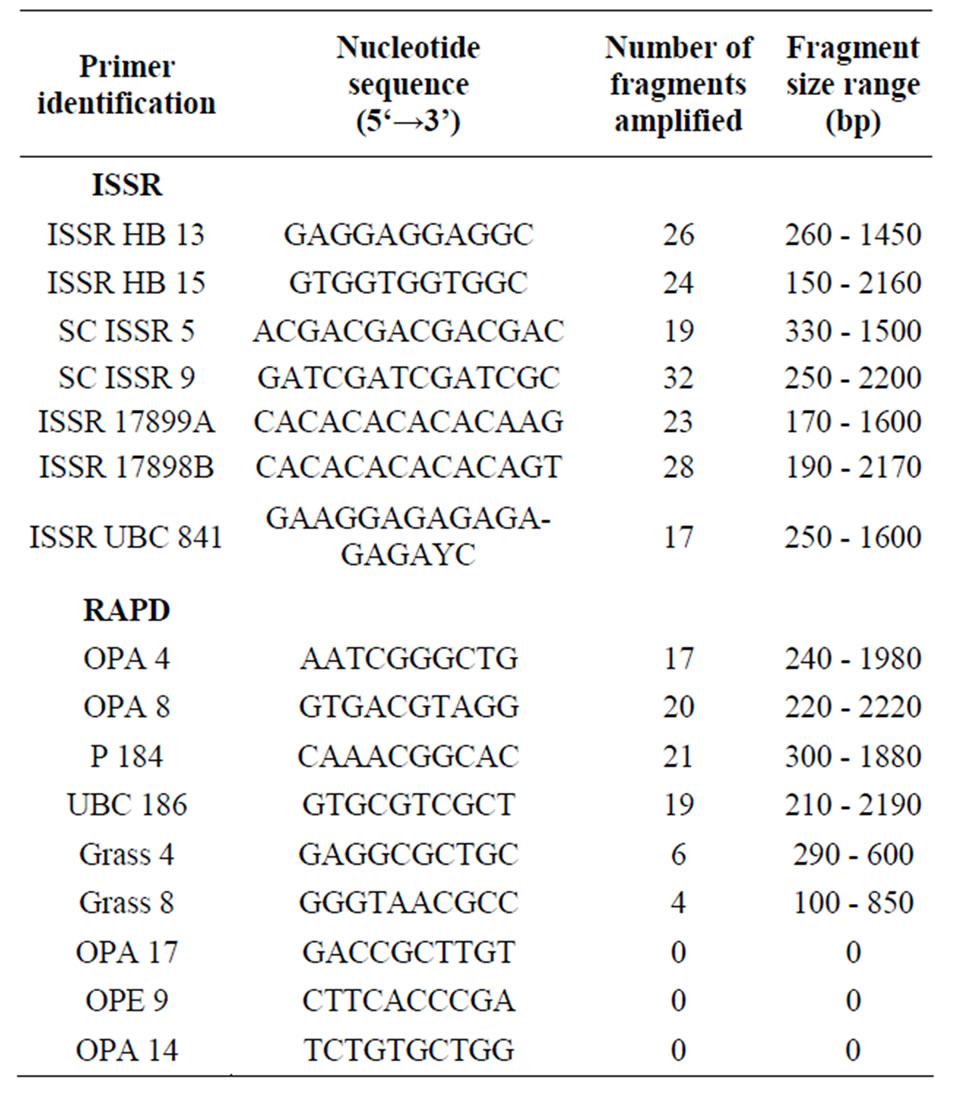
Table 2. The nucleotide sequence of ISSR and RAPD primers used to screen DNA from Picea mariana × Picea rubens hybrid samples.
1.32) to estimate genetic diversity parameters [12,13]. POPGENE is computer software used for the analysis of genetic variation among and within populations using codominant and dominant markers and quantitative traits. The program was used to determine the intra and interpopulation genetic diversity parameters such as percentage of polymorphic loci (P%), Nei’s gene diversity (h), Shannon’s information index (I), observed number of alleles (Na) and effective number of alleles (Ne). The genetic structure was investigated using Nei’s gene diversity statistics, including the within population diversity (Hs) and total genetic diversity (Ht) [14] calculated within the species using the same software. The mean and the total gene diversities, the variation among populations and gene flow were also calculated.
2.4. Identification of Red Spruce DNA in Black Spruce Materials Used for Reforestation
Specific ISSR and SCAR markers that differentiate P. mariana from P. glauca (white spruce) and P. rubens DNA were developed by Nkongolo et al. [15,16]. The specific designed primers were used to confirm the hybridity of the P. mariana × P. rubens populations. P. mariana and P. rubens chromatins were detected following the procedure described by Nkongolo et al. [16].
3. Results
3.1. Certification of Black Spruce Trees
Two species-specific ISSR and SCAR primers were used to certify the identity of genetic materials used. An amplification of all DNA samples using ISSR primer UBC 841 was performed to detect P. mariana DNA in P. mariana × P. rubens background. As expected, this primer produced a species-diagnostic marker at 470 bp unique to P. mariana specific for black spruce. This 470 bp marker was found in the all putative P. mariana and hybrids and not in the P. rubens control DNA samples. Sequence characterized amplified region (SCAR) specific to P. rubens was used to amplify the DNA from the same samples of P. mariana, P. rubens and P. mariana × P. rubens. The targeted marker 792 bp [14] that differentiates P. mariana from P. rubens was not found in any putative P. mariana sample, but it was present in all the amplified products from P. rubens and P. mariana × P. rubens hybrids. Hence, the results from these two tests confirmed that all the hybrid populations analyzed were from P. mariana and P. rubens hybridization.
3.2. ISSR Analysis
Preliminary screening with several ISSR primers was performed on DNA samples from each population in order to determine which primers were most likely to produce reproducible bands. From that initial screening, six primers HB 13, ISSR 5, ISSR 9, 17899A, 17898B, and UBC 841 with the most reproducible banding patterns were used to amplify all DNA samples for population analysis. Figure 1 depicts amplification products using ISSR primer 17898B.
The level of polymorphism within and among P. mariana × P. rubens hybrid populations is described in Table 3. Primer HB 13 generated the lowest level of polymorphic loci (17%) and primer ISSR 9 produced the highest polymorphism (58%). The amplification of DNA samples using ISSR primers ISSR 9 and 17898B produced a high number of strong bands. Primer ISSR 9 produced a total of 32 bands and primer 17898B produced a total of 28 bands. The size of the amplified fragments ranged

Figure 1. ISSR amplification of P. mariana × P. rubens hybrid samples with primer 17898B. Lanes 1 and 35 contain 1 kb+ ladder; lanes 3 to 17 contain P. mariana × P. rubens hybrid samples from population 9430328; lanes 19 to 33 contain P. mariana × P. rubens hybrid samples from population 9430329.
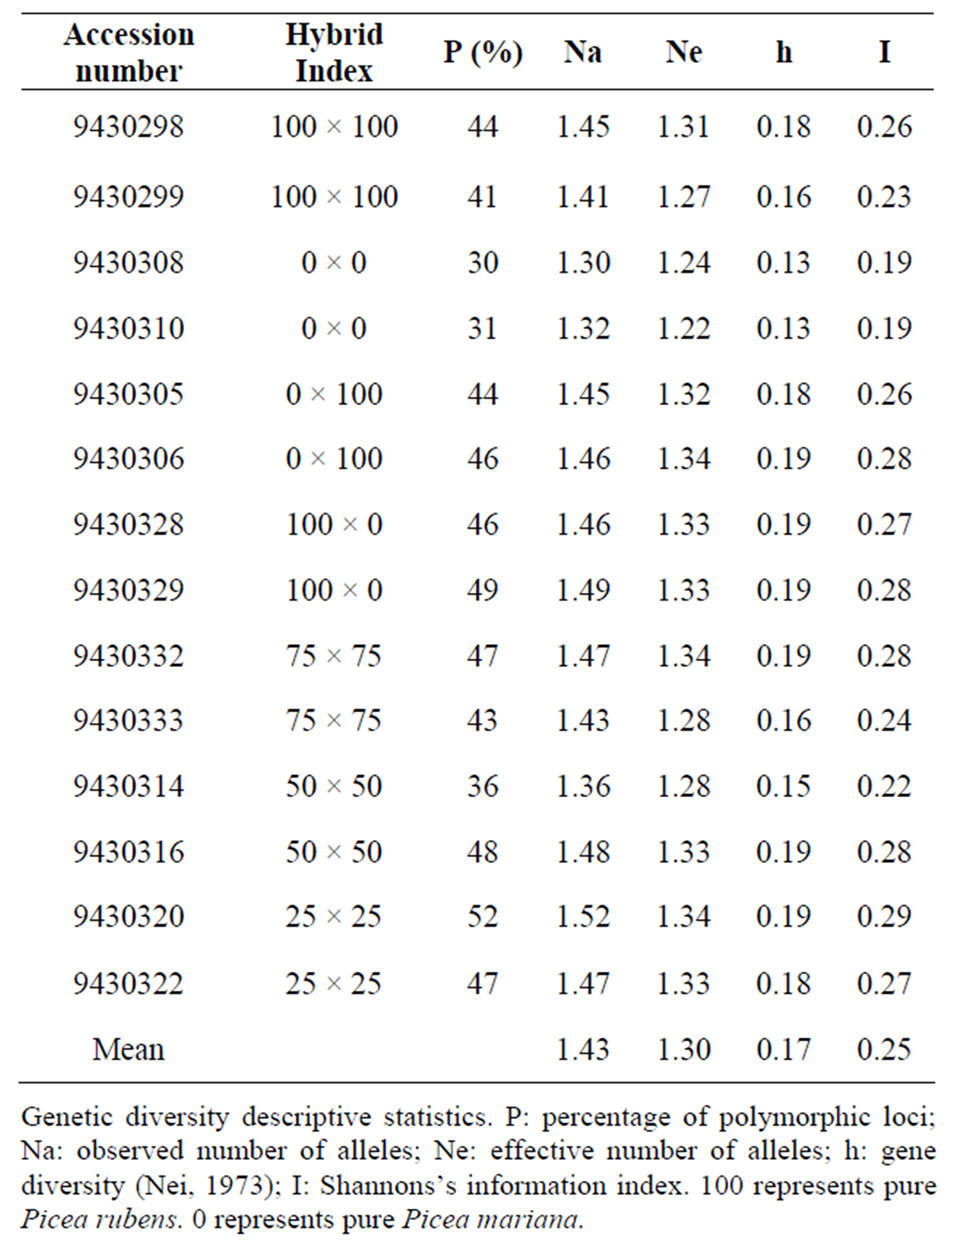
Table 3. Genetic diversity parameters of Picea mariana × Picea rubens hybrids based on ISSR data.
from 190 bp to 2200 bp (Table 2). Primer ISSR 9 and 17898B generated 58% and 47% polymorphism, respectively across the 14 populations. These two primers generated a total of 60 bands and the level of polymorphism within the population ranged from 30% to 73%. The highest level of polymorphism was found in population 9430320 (25 × 25) and the lowest in populations 9430308 and 9430310 (0 × 0).
The level of polymorphism in parental line were 31% for 0 × 0 (P. mariana populations 9430308 and 9430310) and 43% for 100 × 100 (P. rubens populations 9430298 and 9430299). The 46% level of polymorphic loci in 100 × 0 hybrid (population 9430328) was similar to that found in 0 × 100 hybrid (population 9430306). The average level of polymorphism was 50% for 25 × 25 hybrid populations (9430320 and 9430322) and 45% for 75 × 75 populations (9430332 and 9430333). It varies between 35% and 48% for 50 × 50 hybrid populations (9430314 and 9430316).
3.3. RAPD Analysis
Conditions were optimized to allow reproducible amplifications of RAPD bands. RAPD primers were also used to determine genetic variation among and within P. mariana × P. rubens hybrid populations. Several RAPD primers were screened. Some generated poor or no bands and few produced clear bands across all samples. Based on the initial screening, four primers OPA 4, OPA 8, P 184, and UBC 186 that produced good and clear banding patterns were selected to amplify all DNA samples for population analysis. These primers generated bands varying from 210 bp to 2220 bp. Figure 2 depicts amplification products using RAPD primer OPA 4. The level of polymorphism within P. mariana × P. rubens hybrid populations is described in Table 4. Primer OPA 4 generated a low level of polymorphism (55%) and primer

Figure 2. RAPD amplification of P. mariana × P. rubens hybrid samples with primer OPA 4. Lanes 1, 15, 29 and 40 contain 1 kb+ ladder; lanes 2 to 14 contain P. mariana × P. rubens hybrid samples from population 9430298; lanes 16 to 28 contain P. mariana × P. rubens hybrid samples from population 9430305; lanes 30 to 39 contain P. mariana × P. rubens hybrid samples from population 9430308.
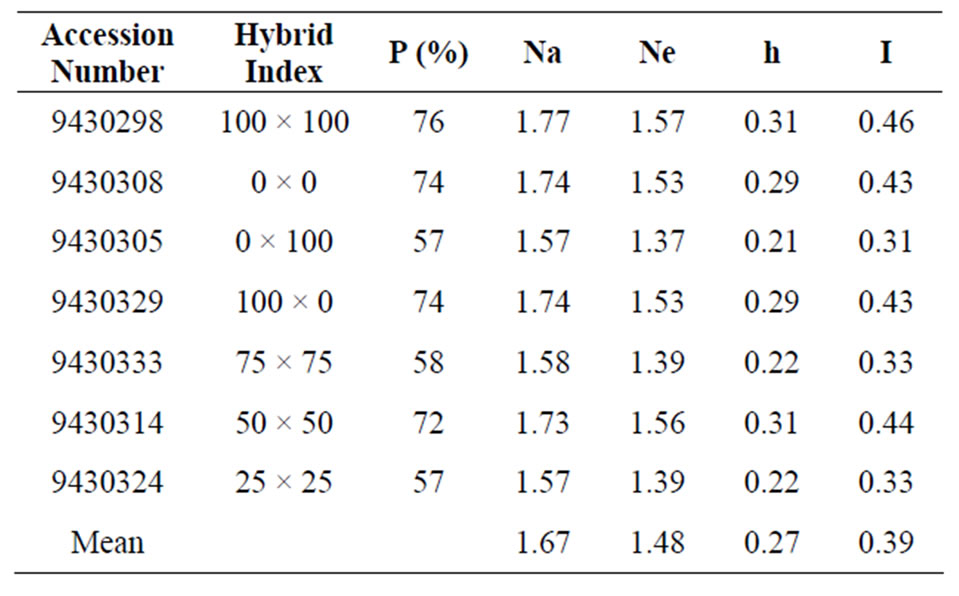
Table 4. Genetic diversity parameters of Picea mariana × Picea rubens hybrids based on RAPD data.
UBC 186 produced the highest level of polymorphism (82%). Two primers, P 184 and UBC 186 produced the most number of polymorphic bands. Primer P 184 generated a total of 21 bands ranging from 300 bp to 1880 bp . The level of polymorphism across the seven populations for this primer was 66%. Primer UBC 186 generated a total of 19 band ranging from 210 bp to 2190 bp of which 82% were polymorphic. These two primers P 184 and UBC 186 produced a total of 40 bands. The level of polymorphism within population ranged from 63% to 83%. The highest level of polymorphism was found in population 9430314 (50 × 50) and the lowest in populations 9430305 (0 × 100) and 9430333 (75 × 75). The results of the amplifications from the four primers are presented in Table 4.
The level of polymorphism in parental populations were 74% for 0 × 0 (P. mariana population 9430308) and 77% for 100 × 100 (P. rubens population 9430298). The level of genetic polymorphism of 74% in 100 × 0 hybrid (population 9430329) was much higher than in the reciprocal cross 0 × 100 hybrid averaging 57% (population 9430305). The level of polymorphic loci were 57%, 73% and 58% for 25 × 25 (population 9430324), 50 × 50 (population 9430314) and 75 × 75 (population 9430333) hybrids, respectively.
3.4. Genetic Diversity
Various genetic parameters were calculated using Popgene software version 1.32 [16]. The analyses generated the percentage of polymorphic loci (%), Nei’s gene diversity (h), Shannon’s information index (I), observed number of alleles (Na), and the effective number of alleles.
Table 3 describes the genetic parameters of fourteen P. mariana × P. rubens hybrid populations generated based on ISSR marker system. The level of polymorphic loci among populations was 58%. For each population, the percentage of polymorphic loci varied between 30% (0 × 0; population 9430308) to 52% (25 × 25; population 9430320). Nei’s gene diversity (h) ranged from 0.1285 to 0.1955, with a mean of 0.1733. The highest gene diversity was in population 9430320 (25 × 25) and the lowest in population 9430310 (0 × 0). A similar pattern was observed for the Shannon’s information index (I), with the highest value of 0.2885 observed in population 9430320 (25 × 25) and the lowest value of 0.1878 observed in population 9430310 (0 × 0). The observed number of alleles (Na) ranged from 1.3034 (0 × 0; population 9430308) to 1.5241 (25 × 25; population 9430320) which is a similar pattern observed in percentage of polymerphic loci (%). The effective number of alleles (Ne) ranged from 1.2250 (0 × 0; population 9430310) to 1.3411 (25 × 25; population 9430320) which is a similar pattern observed in Nei’s gene diversity (h) and Shannon’s information index (I).
Table 4 presents the genetic parameters of seven P. mariana × P. rubens hybrid populations generated based on RAPD marker system. The level of polymorphic loci among populations was 67% which is high compared to the ISSR marker system. In comparison, RAPD primers generated higher values for each parameter compared to ISSR. The percentage of polymorphic loci varied between 57% (0 × 100; population 9430305 and 25 × 25; population 9430324) and 76% (100 × 100; population 9430298). Nei’s gene diversity (h) ranged from 0.2127 (0 × 100; population 9430305) to 0.3166 (100 × 100; population 9430298), with a mean of 0.2687. A similar pattern was observed for the Shannon’s information index (I), with the lowest value observed in population 9430305 (0.3148) (0 × 100) and the highest value observed in population 9430298 (0.4582) (100 × 100). The observed number of alleles (Na) ranged from 1.5714 (0 × 100; population 9430305 and 25 × 25; population 9430324) to 1.7662 (100 × 100; population 9430298), with a mean of 1.6716. The effective number of alleles (Ne) ranged from 1.3716 (0 × 100; population 9430305) to 1.5715 (100 × 100; population 9430298), with a mean of 1.4793.
4. Discussion
The ISSR analysis revealed various levels of polymorphic loci within and among the 14 populations of P. mariana × P. rubens hybrid. Populations with an hybrid index 0 × 0 (pure P. mariana) has the lowest polymorphism of 30% and population with hybrid index 25 × 25 has the highest polymorphism of 50%. The rest of the populations with hybrid index 100 × 100, 0 × 100, 50 × 50, 100 × 0 and 75 × 75 all have polymorphism ranging from 41% to 47%. Only one population with hybrid index 25 × 25 has higher polymorphism compared to the rest of the hybrids. There was no significance differences between the level of polymorphism detected in P. rubens populations compared to P. mariana.
RAPD analysis revealed high level of polymorphism within and between compared to ISSR data. Overall, the polymorphism ranged from 57% to 74%. In the present study the level of polymorphism was similar between P. mariana and P. rubens when RAPD marker system was used. Previous reports by Nkongolo [9] revealed that the polymorphism was much higher within spruce hybrid populations than pure species. In fact, he found that the level of polymorphism of 90% for the hybrids and 10% for the pure lines in his RAPD analysis study [9]. The pure P. mariana × P. rubens lines in Nkongolo [9] study were derived from embryogenic tissues.
In other studies of adaptive and morphometric trait, P. rubens has comparatively low genetic variability than P. mariana [17]. These results were supported by low levels of genetic variation in biochemical and molecular markers [18], particularly when P. rubens is compared with sympatric spruce species [19].
The RAPD and ISSR analyses of P. mariana × P. rubens hybrid in the present study indicated that the level of genetic variation was statistically similar among populations regardless of hybrid index. Cytological analysis on these hybrids by Nkongolo [9] revealed a normal mitotic behavior at prophase, metaphase, anaphase and telophase in all populations. All the trees analyzed from different cross combinations were euploids. This is a further indication that P. mariana and P. rubens are closely related species. Jaramillo and Bousquet [20] study on mitochondrial DNA revealed that the genetic variation in both P. mariana and P. rubens were low but unexpectedly high diverse mtDNA haplotype structures were observed in and around the zone of contact for the both species. Jaramillo and Bousquet [21] confirmed that these spruce species are found in populations next to or into the zone of contact.
Overall, the results of ISSR and RAPD analyses were different. Similar results were reported in a study conducted by Fang and Roose [22] in Citrus species. There are few reports of high level of polymorphism with ISSR system compared to RAPDs in several plants [16,23]. Technically, RAPD and ISSR markers target different areas in the genome. RAPD markers reveal polymorphism in coding and non-coding regions, as well as, repeated or single copy sequences covering the entire genome [24].
The origin of the ISSR amplification products is known to be from the sequences between two simple-sequence repeat (also known as Microsatellite) primers sites where length variation does not necessarily reflect simple-sequence length polymorphism [25]. Microsatellite loci are dispersed throughout the genome and are hypervariable because of DNA slippage [26]. Theoretically, ISSR should detect more polymorphism than RAPD primers because of the high levels of variability in microsatellite loci. The discrepancy between variations revealed by RAPD and ISSR result from different targeted genomic areas which undergo a different evolutionary process due to selection forces [27].
5. Conclusion
Different genetic information is generated when RAPD and ISSR molecular marker techniques are used to assess the inter-specific and intra-specific variability. The level of variation detected with each system greatly depends on the primer used therefore making comparisons inappropriate regarding level of polymorphism generated with ISSR and RAPD marker system. Nevertheless, the fact that the levels of genetic variation among P. mariana, P. rubens and their interspecific hybrid populations were not significantly different regardless of the marker system used is an indication of their genetic closeness. Since ISSR and RAPD are dominant markers, the results of the present study can be confirmed using co-dominant marker systems such as SSR (microsatellite markers) with larger population sizes.
6. Acknowledgements
Thanks to the Canadian Forest Services at Fredericton for providing P. mariana, P. rubens, and P. mariana × P. rubens seeds used in the present study. Financial support from the Natural Science and Engineering Research Council (NSERC) of Canada is greatly appreciated.
REFERENCES
- R. C. Lewontin and L. C. Birch, “Hybridization as a Source of Variation for Adaptation to New Environments,” Evolution, Vol. 20, No. 3, 1966, pp. 315-336. doi:10.2307/2406633
- K. Schwenk, N. Brede and B. Streit, “Introduction. Extent, Processes and Evolutionary Impact of Interspecific Hybridization in Animals,” Philosophical Transactions of the Royal Society of Biological Sciences, Vol. 363, No. 1505, 2008, pp. 2805-2811. doi:10.1098/rstb.2008.0055
- M. L. Arnold, “Evolution through Genetic Exchange,” Oxford University Press, Oxford, 2007. doi:10.1093/acprof:oso/9780199229031.001.0001
- J. E. Major, A. Mosseler, K. H. Johnsen, O. P. Rajora, D. C. Barsi, K.-H. Kim, J.-M. Park and M. Campbell, “Reproductive Barriers and Hybridity in Two Spruces, Picea rubens and Picea mariana, Sympatric in Eastern North America,” Canadian Journal of Botany, Vol. 83, No. 2, 2005, pp. 163-175. doi:10.1139/b04-161
- S. A. M. Manley, “Genecology of Hybridization in Red Spruce (Picea rubens Sarg.) and Black Spruce (Picea mariana (Mill.) BSP),” Dissertation Abstracts International, Order No. 75-24573, 1975.
- A. G. Gordon, “The Taxonomy and Genetics of Picea rubens and Its Relationship to Picea mariana,” Canadian Journal of Botany, Vol. 54, No. 9, 1976, pp. 781-813. doi:10.1139/b76-084
- S. A. M. Manley and F. T. Ledig, “Photosynthesis in Black and Red Spruce and Their Hybrid Derivatives: Ecological Isolation and Hybrid Adaptive Inferiority,” Canadian Journal of Botany, Vol. 57, No. 4, 1979, pp. 305-314. doi:10.1139/b79-042
- K. H. Johnsen, J. E. Major, J. Loo and D. McPhee, “Negative Heterosis Not Apparent in 22-Year-Old Hybrids of Picea mariana and Picea rubens,” Canadian Journal of Botany, Vol. 76, No. 3, 1998, pp. 434-439.
- K. K. Nkongolo, “RAPD Variations among Pure and Hybrid Populations of Picea mariana, P. rubens, and P. glauca (Pinaceae), and Cytogenetic Stability of Picea Hybrids: Identification of Species-Specific RAPD Markers,” Plant Systematics and Evolution, Vol. 215, No. 1-4, 1999, pp. 229-239. doi:10.1007/BF00984657
- T. Nagaoka and Y. Ogihara, “Applicability of Inter-Simple Sequence Repeat Polymorphisms in Wheat for Use as DNA Markers in Comparison to RFLP and RAPD Markers,” Theoretical Applied Genetics, Vol. 94, No. 5, 1997, pp. 597-602. doi:10.1007/s001220050456
- M. S. Mehes, K. K. Nkongolo and P. Michael, “Genetic Analysis of Pinus strobus and Pinus monticola Populations from Canada Using ISSR and RAPD Markers: Development of Genome-Specific SCAR Markers,” Plant Systematics and Evolution, Vol. 267, No. 1-4, 2007, pp. 47-63. doi:10.1007/s00606-007-0534-1
- F. C. Yeh and T. J. B. Boyle, “Population Genetic Analysis of Codominant and Dominant Markers and Quantitative Traits,” Belgian Journal of Botany, Vol. 129, 1997, pp. 157-163.
- F. C. Yeh, R. C. Yang, T. Boyle, Z. H. Ye and J. X. Mao, “POPGENE, the User-Friendly Shareware for Population Genetic Analysis,” Molecular Biology and Biotechnology Center, University of Alberta, Edmonton, 1997.
- M. Nei, “Analysis of Gene Diversity in Subdivided Populations,” Proceedings of the National Academy of Sciences of USA, Vol. 70, No. 12, 1973, pp. 3321-3323. doi:10.1073/pnas.70.12.3321
- K. K. Nkongolo, L. Deverno and P. Michael, “Genetic Validation and Characterization of RAPD Markers Differentiating Black and Red Spruces: Molecular Certification of Spruce Trees and Hybrids,” Plant Systematics and Evolution, Vol. 236, No. 3-4, 2003, pp. 151-163. doi:10.1007/s00606-002-0236-7
- K. K. Nkongolo, P. Michael and T. Demers, “Application of ISSR, RAPD, and Cytological Markers to the Certification of Picea mariana, P. glauca, and P. engelmannii Trees, and Their Putative Hybrids,” Genome, Vol. 48, No. 2, 2005, pp. 302-311. doi:10.1139/g04-118
- D. P. Fowler, Y. S. Park and A. G. Gordon, “Genetic Variation of Red Spruce in the Maritimes,” Canadian Journal of Forest Research, Vol. 18, No. 6, 1988, pp. 703-709. doi:10.1139/x88-107
- M. Perron, A. G. Gordon and J. Bousquet, “Species-Specific RAPD Fingerprints for the Closely Related Picea mariana and Picea rubens,” Theoretical Applied Genetics, Vol. 91, No. 1, 1995, pp. 142-149. doi:10.1007/BF00220871
- M. Tremblay and J. P. Simon, “Genetic Structure of Marginal Populations of White Spruce (Picea glauca) at Its Northern Limit of Distribution in Nouveau-Quebec,” Canadian Journal of Forest Research, Vol. 19, No. 11, 1989, pp. 1371-1379. doi:10.1139/x89-211
- J. P. Jaramillo-Correa and J. Bousquet, “New Evidence from Mitochondrial DNA of a Progenitor-Derivative Species Relationship between Black Spruce and Red Spruce (Pinaceae),” American Journal of Botany, Vol. 90, No. 12, 2003, pp. 1801-1806. doi:10.3732/ajb.90.12.1801
- J. P. Jaramillo-Correa and J. Bousquet, “Mitochondrial Genome Recombination in the Zone of Contact between Two Hybridizing Conifers,” Genetics, Vol. 171, No. 4, 2005, pp. 1951-1962. doi:10.1534/genetics.105.042770
- D. Q. Fang and M. L. Roose, “Identification of Closely Related Citrus Cultivars with Inter-Simple Sequence Repeat Markers,” Theoretical Applied Genetics, Vol. 95, No. 3, 1997, pp. 408-417. doi:10.1007/s001220050577
- S. N. Raina, V. Rani, T. Kojima, Y. Ogihara, K. P. Singh and R. M. Devarumath, “RAPD and ISSR Fingerprints as Useful Genetic Markers for Analysis of Genetic Diversity, Varietal Identification, and Phylogenetic Relationships in Peanut (Arachis hypogaea) Cultivars and Wild Species,” Genome, Vol. 44, No. 5, 2001, pp. 763-772.
- J. G. Williams, A. R. Kubelik, K. J. Livak, J. A. Rafalski and S. V. Tingey, “DNA Polymorphisms Amplified by Arbitrary Primers Are Useful as Genetic Markers,” Nucleic Acids Research, Vol. 18, No. 22, 1990, pp. 6531- 6535. doi:10.1093/nar/18.22.6531
- E. Zietkiewicz, A. Rafalski and D. Labuda, “Genome Fingerprinting by Simple Sequence Repeat (SSR)—Anchored Polymerase Chain Reaction Amplification,” Genomics, Vol. 20, No. 2, 1994, pp. 176-183. doi:10.1006/geno.1994.1151
- K. Semagn, A. Bjornstad and M. N. Ndjiondjop, “An Overview of Molecular Markers Methods for Plants,” African Journal of Biotechnology, Vol. 5, No. 25, 2006, pp. 2540-2568.
- W. Qian, S. Ge and D. Y. Hong, “Genetic Variation within and among Populations of a Wild Rice Oryza granulata from China Detected by RAPD and ISSR Markers,” Theoretical Applied Genetics, Vol. 102, No. 2-3, 2001, pp. 440-449. doi:10.1007/s001220051665