Computational Water, Energy, and Environmental Engineering
Vol.2 No.2(2013), Article ID:30597,7 pages DOI:10.4236/cweee.2013.22008
An Experimental Investigation of Temperature Distribution in Different Urban Locations in Aswan, Egypt of Hot and Dry Climate
1Department of Mechanical Engineering, Aswan Faculty of Energy Engineering, Aswan University, Aswan, Egypt
2Department of High Voltage Networks Engineering, Aswan Faculty of Energy Engineering, Aswan University, Aswan, Egypt
Email: *soubhi_a@yahoo.com
Copyright © 2013 Soubhi A. Hassanein et al. This is an open access article distributed under the Creative Commons Attribution License, which permits unrestricted use, distribution, and reproduction in any medium, provided the original work is properly cited.
Received February 2, 2013; revised March 2, 2013; accepted March 10, 2013
Keywords: Experimental; Temperature Distribution; Urban; Hot and Dry Climate
ABSTRACT
This paper describes the measurements and analysis of an experimental campaign performed in different urban street in Aswan, Egypt. The present study is focused on the experimental investigation of thermal characteristics during summer 2012 of five different regions location (building on Nile river shore, building in front of a mountain, building under high power transmission line, two building opposite other in resident region, finally ship in Nile river) aiming at the investigation of the impact of urban location on the potential of natural and hybrid ventilation under hot weather conditions. The temporal and spatial distribution of air and surface temperatures is examined. Emphasis was given on the vertical distribution of air and surface temperatures. The results showed that the measured surface temperature across the street was the highest value than the air and wall temperature where temperature difference between street and air temperature could reach 35˚C and this favored the overheating of lower air levels. Buoyancy generated mainly from asphalt-street heating resulted in the development of the predominant recirculation inside the street canyon. The results also show that air temperature for two building opposite other has a lower value followed by building on Nile river shore followed by building at front of mountain.
1. Introduction
With rapid urbanization, there has been a tremendous growth in population and buildings in cities. The high concentration of hard surfaces actually triggered many environmental issues. The urban heat island (UHI) effect, one of these environmental issues, is a phenomenon where air temperatures in densely built cities are higher than the suburban rural areas. The primary root of heat island in cities is due to the absorption of solar radiation by mass building structures, roads, and other hard surfaces during daytime. The absorbed heat is subsequently re-radiated to the surroundings and increases ambient temperatures at night.
High temperatures in urban street canyons do create health impacts to people. It is, therefore, important to understand the temperature characteristics in street canyons under real urban meteorological conditions, to formulate effective strategies for control and urban planning. The main factors which govern the temperature distribution in streets are: emissions from vehicles in the street, street configuration, and meteorological conditions. Pollution from traffic is often the most substantial. However, emissions from power plants, industries and domestic use are important as well. The street geometry, i.e. height of the surrounding buildings and street width, influences the temperature distribution inside the street. Also important is the orientation of the street compared to the prevailing wind direction. The city of Aswan has been chosen due to the large difference in meteorological conditions.
Air circulation and temperature distribution within urban canyons is of high significance for pedestrian comfort, pollutant dispersion, radiated and energy studies and for the potential of natural and hybrid ventilation in urban buildings. as well as, for the evaluation of street canyon models that focus on this field. Several theoretical but only few experimental urban street canyon studies are reported in the literature.
In the past few years, along with the rapid urbanization, the energy conservation in the civilian sector, which reflects the improvement of living standard, plays an important role in the sustainable development of the city. as well as enough attention to the environmental protection, more and more attention is paid to the reformation of urban energy system. Measurement and analysis of an experimental campaign were performed by K. Niachou et al. [1] in an urban street canyon in Athens, Greece. A number of field and indoor experimental procedures were organized during summer 2002 aiming at the investigation of the impact of urban environment on the potential of natural and hybrid ventilation. The influence of traficinduced pollutants (e.g. CO, NO, NO2 and O3) on the air quality of urban areas was investigated by W. Kuttler and A. Strassburger [2] in the city of Essen, North RhineWestphalia (NRW), Germany. Twelve air hygiene profile measuring trips were made to analyze the trace gas distribution in the urban area. A comparison was by Elisabetta Vignati et al. [3] between pollution levels in a street in Copenhagen characterized by frequent high wind conditions and a street in Milan with generally low wind speed conditions. The analysis has shown that the differences in pollution levels in these two cities are governed mainly by the meteorological conditions and especially wind speed. A mobile survey was conducted by Nyuk Hien Wong and Chen Yu [4] to explore both the severity of UHI effect and cooling impacts of green areas at macro-level in Singapore. Island wide temperature distribution was mapped relying on data derived from the mobile survey. Air flow and pollutant dispersion characteristics in an urban street canyon are studied by YunWei Zhang et al. [5] under the real time boundary conditions. A new scheme for realizing real-time boundary conditions in simulations is proposed. Berlian I. Idris et al. [6] have investigated differences in smoking prevalence between urban and non-urban area of residence in six Western European countries (Sweden, Finland, Denmark, Germany, Italy and Spain), and smoking prevalence trends over the period 1985-2000. An analytical model has been developed by Hongbo Ren et al. [7] for estimating an economically efficient installation and operation pattern for the distributed energy system for the urban area in china. The data analyzed by Jing Yuan and Akula Venkatram [8] are relevant to dispersion from near surface urban sources at distances where the vertical plume spread is less than the average height of the buildings. An attempt is made by Vali Kalantar [9] to study the cooling performance of a wind tower numerically in hot and arid region. A three-dimensional computational fluid dynamics (CFD) simulation coupled with radiation and conduction analysis was carried out by Hong Huang et al. [10] to analyze the pollutant dispersion under non-isothermal conditions within an objective area in Kawasaki city, Japan, in winter.
In the present study, a number of field experimental procedure were performed in an urban street, in Aswan, aiming at the investigation of the thermal characteristics during hot weather conditions for different urban location. The aim is to present the detailed experimental data within a real urban street during hot summer weather conditions. The results of this experiment can be very useful for the understanding of the impact of the urban street location on the potential of natural and hybrid ventilation in urban buildings, as well as, for the evaluation of street canyon models that focus on this field.
2. Experimental Investigation
A number of experimental procedures were organized in different urban street canyon location as shown in Figure 1, located at a high density residential area, near the center of Aswan. The experiments were performed inside and outside the canyon during the period 9:00 am to 2:00 pm for 19-24 June 2012. Less attention has been paid to analyzing the air temperature of urban areas with various types of land use and their interactions with high spatial resolution. Meteorological data consisting of air and surface temperature measurements were recorded on a continuous basis. A detailed description of the field measurements is given in Table 1. The temperature measure-
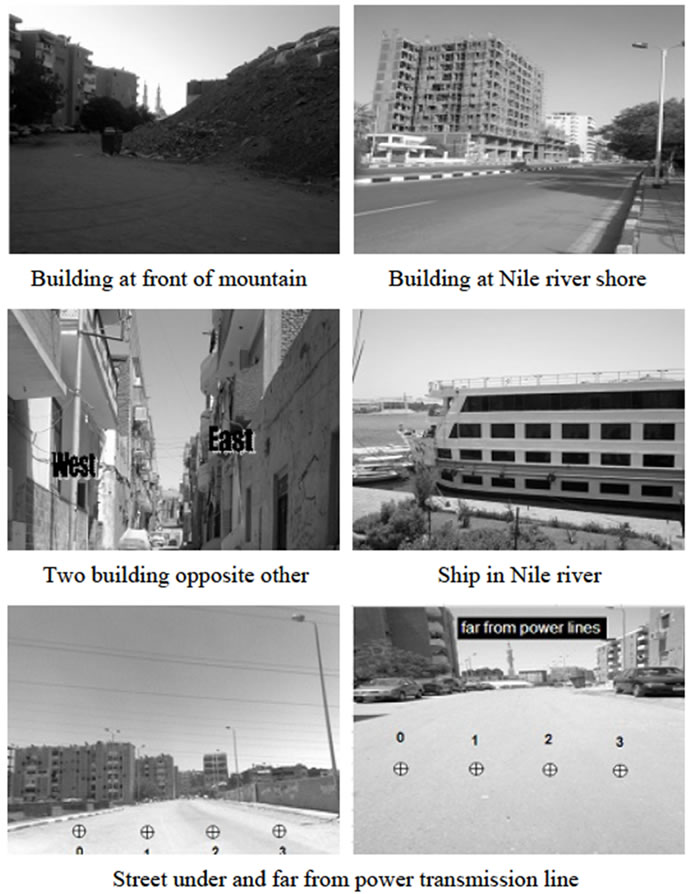
Figure 1. Photo of different urban location studied at Aswan.

Table 1. Experimental runs.
ments consisted of: the performed air and surface temperature measurements in five locations.
3. Measuring Instrumentation
3.1. Air Temperature
The air temperature at different positions in the urban location has been measured by digital air velocity and temperature instrument as shown in Figure 2. It has the capability to be connected to a computer and/or a printer for accessing data and printing it. The specifications of the air velocity and temperature are listed in Table 2. All measuring devices have been monitored throughout the day and their outputs have been recorded every 60 min.
3.2. Surface Temperature
Surface temperatures (as wall and street temperatures) ere also measured with Radiation Pyrometer ARDOCELL PZ Profibus 7MC3060-···-Z-A40 as shown in Figure 3. Measurements were performed from the ground level up to the fourth floor, every 1 h.
4. Description of Field Measurements
The studied canyons (Figure 1), having a range of height to width ratio (H/W) of (1.5 - 2). The canyons are oriented with its long-axis in an N-W direction. The building walls are made of concrete. The vertical distribution of the surface temperatures on the buildings opposite mountain was studied during day and night, since it is important to understand the transfer phenomena between them and the adjacent air.
5. Results and Discussion
In this part, the obtained experimental results will be comprehensively discussed. The results include air temperature and surface temperature (street and wall temperatures) distribution along five urban locations. Finally a comparison between temperature distribution for different locations has been done. Inside the urban street canyon
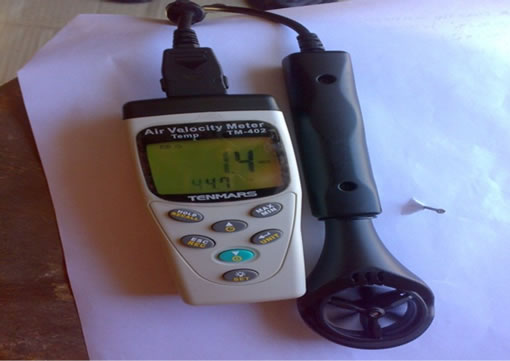
Figure 2. Digital air velocity and temperature instrument.
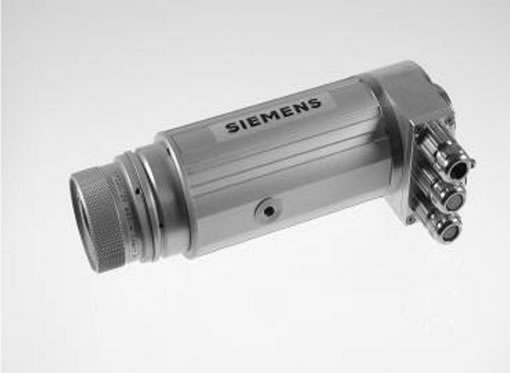
Figure 3. Radiation Pyrometer for surface temperature.
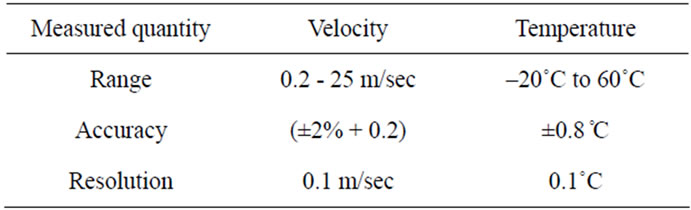
Table 2. Specification of the motive air thermo-anemoter air meter unit.
during June 2012 in Aswan, Egypt.
5.1. Air Temperature near Canyon Facades
In order to understand the mechanisms that determine the distribution of air temperature inside a canyon, air temperature measurements have been performed in close to opposite building facades. The air temperature distribution has been analyses in order to investigate the impact of the street layout and orientation, as well, of the surface temperatures due to convection heat transfer phenomena.
The air temperature distribution across the canyon is of great interest. As temperature in the middle of canyon and near the ground level air temperature was more dependent upon the flux divergence in air volume including that of the horizontal transport. The measured air temperature differences between the two facades vary, as a function of the canyon layout and the surface characteristics.
Air temperature near building walls for different location urban was measured at a distance of 0.5 m from the exterior walls as shown in Figure 4. Measurements were performed from the ground level up to the fourth or sixth floor, every 1 h depend on geometry of building. Figure 5 showed air temperature of different urban at Aswan. It could be seen from Figure 5 that the air temperature at 0.5 m from the exterior walls for most urban location for the same floor number during day time is increase with time to maximum value near a noon then decrease with time as does the general trend of solar radiation. Only the air temperature at 0.5 m from the exterior walls for building facing a mountain for the same floor number during night time is decreasing with time as could be explained by losing heat by convection during night. Also It could be seen that the air temperature at 0.5 m from the exterior walls for most urban location (except ship in Nile river) at the same time decrease with floor number i.e. decrease as far up from land as this go in line with general trend of ambient temperature with vertical distance from land. Also the air temperature at 0.5 m from the exterior walls for ship at Nile river was found to be increased with floor number i.e. increase as far vertically from water surface.
Finally for two building opposite each other the measured air temperature differences between the two facades vary, as a function of the canyon layout and the surface characteristics.
As it was expected, the air temperature close to west facade was higher than near east facade during time range (9:00 am-12:00 am). And vice verse the air temperature close to west facade was lower than near east facade during time range (1:00 pm-2:00 pm).
Comparison between air temperature of building at front of mountain during day and night it could be seen that temperature values for day is more than for night due
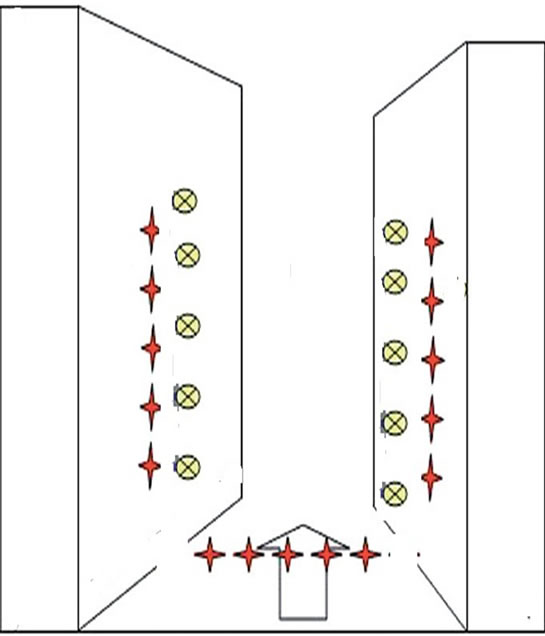
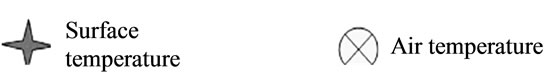
Figure 4. A schematic representation of temperature measurements performed.
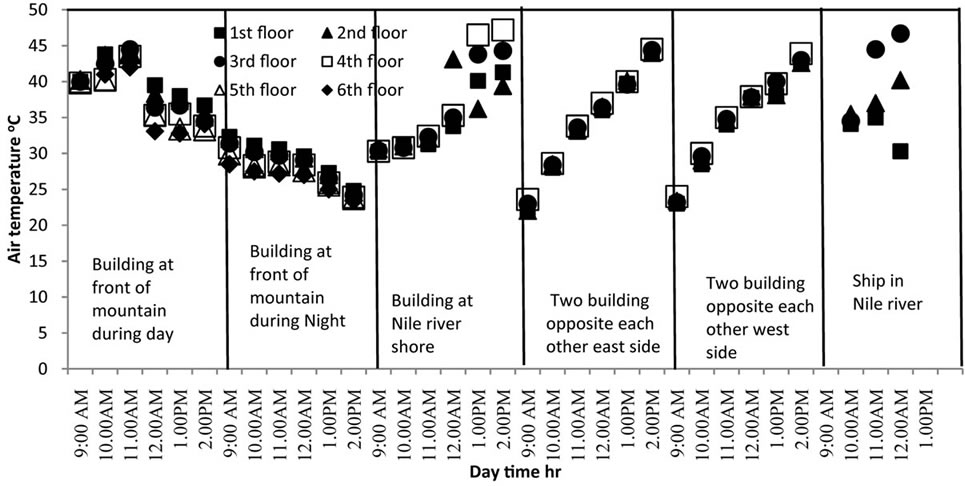
Figure 5. Hourly distributions of air temperatures for different urban locations.
to solar radiation in day. Finally comparing of air temperature for all urban location it could be seen that air temperature for two building opposite each other has a lower value followed by building on Nile river shore followed by building at front of mountain.
5.2. Surface Temperatures
Surface temperatures were conducted on the ground by an infrared thermometer equipped with a laser beam, every one hour. The surface temperatures were recorded across the canyon on the asphalt street and on the sidewalks on each side of the road. The emissivity value used for the measured materials was considered.
Wall Temperature
The vertical distribution of the surface temperatures on the different buildings shown in Figure 4 was studied during day. Since it is important to understand the transfer phenomena between them and the adjacent air. Surface temperatures were measured with the infrared thermometer. Measurements were performed from the ground level up to the fourth or sixth floor, every 1 h.
The surface temperatures on the different buildings wall were reported in Figure 6. It could be seen from Figure 6 that the surface temperature of most building location for the same floor during day increase with time to maximum value then decrease as do solar radiation with time. But the surface temperature for building opposite mountain during night decrease with time due to heat losses during night. Also it could be seen from Figure 6 that the surface temperature for most building location decrease with increase floor number (far from land) as this could be explained as a result of the higher ground temperatures and the reduced wind effect, also this could be explained by the fact that lower level surfaces have lower sky view factors and thus irradiative losses to the sky are smaller. Except surface temperature at ship increase with floor number i.e. as far from water surface. Figure 6 also could show that surface temperatures during night has a lower values than during day for building opposite mountain as this could be due to heat losses by convection during night. Comparing surface temperature for different location it could be seen that building opposite mountain has higher value followed by ship in Nile river followed by two building opposite others followed by building on Nile river shore. It could be seen that although ship was in river it has a higher wall temperature comparing to other building as this could be explained that its wall was from metal which absorb heat thus higher its temperature.
As expected, the thermal behavior of the two opposite walls is more complex due to parameters affecting the thermal balance of building materials (physical properties and canyon geometry) and due to incident solar and emitted infrared radiation. In general, it has been observed that during day period, the west facade presented higher temperatures than the opposite wall as this could be explained due to facing sun for more time than other wall.
5.3. Surface Temperature (Street Temperature)
Surface temperatures were conducted on the ground by an infrared thermometer equipped with a laser beam, on an hourly basis, at a number of some points across the asphalt street. The surface temperatures were recorded across the canyon on the asphalt street for different urban
Figure 6. Hourly distributions of wall temperatures for different urban locations.
location in Figure 7. It could be seen from the figure that the street temperature for all building location during day increase with time to maximum value then decrease as do solar radiation with time. But street temperature at building opposite mountain decrease with time during night. Also it could be seen from Figure 7 that the street temperature increase as far from building as this could be due to shade. Figure 7 could be seen that street temperature increase toward western wall for two building opposite other as this could be explain to facing sun. There are a little bits difference in street temperature under and far from power transmission line as this could be explained for shade or difference in place. Finally the street temperature values are higher than both air and surface temperatures.
5.4. Comparison between (Air, Wall and Street) Temperatures
Comparison of (air, wall and street) temperatures have shown in Figure 8 during daytime shows that in almost all cases the street temperature is highest followed by the wall temperature followed by the air temperature, in some cases, the air temperature is higher than the corresponding surface temperatures which was explained probably due to the warming of the air volume by the combined effects of turbulent sensible heat. The results showed that there were less air temperature variations compared with the surface temperatures due to street geometry and sky view factor.
6. Conclusions
The analysis of temperature distribution in different urban street canyon has been performed in Aswan Egypt under hot summer conditions. The analysis of the field measurements has led to the following observations:
1) The air temperature, wall temperature, and street temperature for most urban location during day time increase with time to a maximum value, then decrease with time. And continuous decreasing during night.
2) The air temperature and wall temperature for most urban location (except ship in Nile river) at the same time decrease with floor number i.e. decrease as far up from land.
3) The air and wall temperatures for ship at Nile river was found to be increased with floor number.
4) For the two building opposite each other the measured air and wall temperatures differences between the two facades vary, as a function of the canyon layout and the surface characteristics.
5) Comparison between air temperature during day and night it could be seen that temperature values for day is more than for night 6) Comparing of air temperature for all urban location it could be seen that air temperature for two building opposite each other has a lower value followed by building on Nile river shore followed by building at front of mountain.
7) Comparison of the hourly surface temperatures measured on the opposite building walls from the ground level up to the fourth floor has shown that the west facade presented greater temperatures than the opposite (east facade). The measured temperature differences between the opposite canyon walls during the day were higher at the fourth floor, because of the increased solar radiation and at the ground floor, as a result of the higher ground
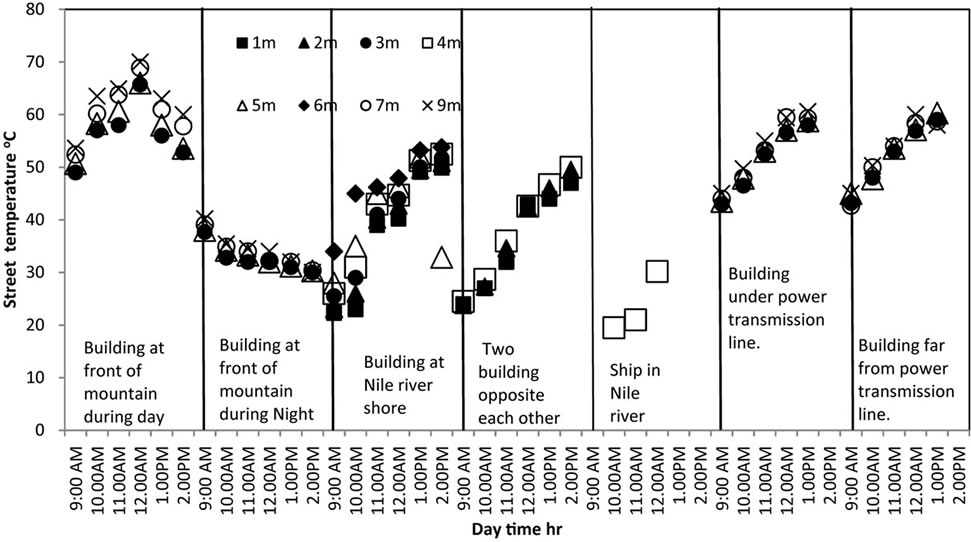
Figure 7. Hourly distributions of street temperatures for different urban locations.
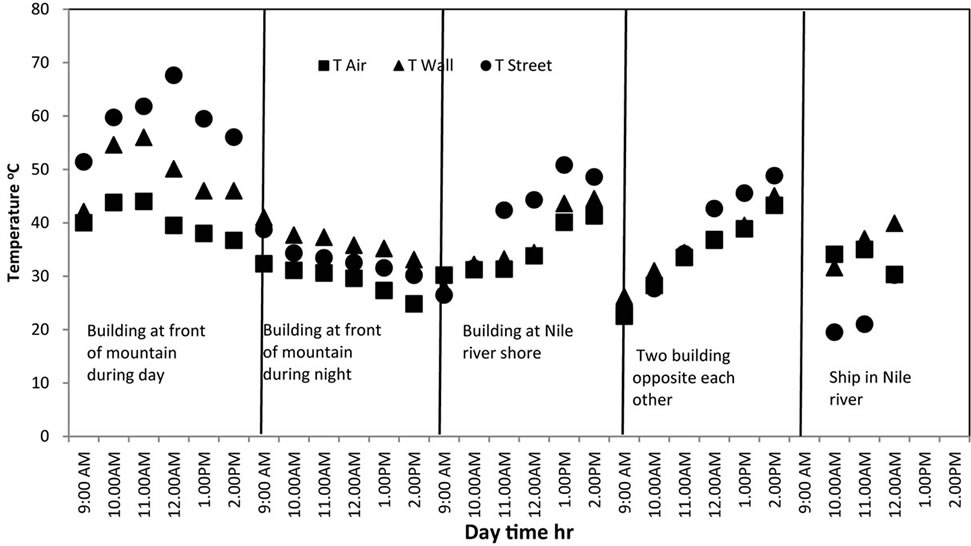
Figure 8. Hourly distributions of (air, wall temperatures at first floor and average street) temperatures for different urban locations.
temperatures and the reduced wind effect.
8) Analysis of the street temperatures across a section fromeasttowest facing mountain revealed the existence of maximum surface temperatures on the asphalt street up to 68.9˚C, during midday, due to the vertical incidence of solar radiation.
9) The above results indicate that the air temperature distribution inside a street canyon is the function of canyon geometry and orientation, as well as, of the optical and thermal properties of building and street materials andambient weather conditions. Furthermore, the understanding of the specific thermal characteristics is essential for the understanding of airflow inside the canyons and for the studies of natural and hybrid ventilation in the urban environment.
REFERENCES
- K. Niachou, I. Livada and M. Santamouris “Experimental Study of Temperature and Airflow Distribution inside an Urban Street Canyon during Hot Summer Weather Conditions Part I: Air and Surface Temperatures,” Building and Environment, Vol. 43, No. 8, 2008, pp. 1383-1392. doi:10.1016/j.buildenv.2007.01.039
- W. Kuttler and A. Strassburger, “Air Quality Measurements in Urban Green Areas, a Case Study,” Atmospheric Environment, Vol. 33, No. 24, 1999, pp. 4101-4108.
- E. Vignati, R. Berkowitz and O. Hertel, “Comparison of Air Quality in Streets of Copenhagen and Milan, in View of the Climatological Conditions,” Science of the Total Environment, Vol. 189-190, 1996, pp. 467-473. doi:10.1016/0048-9697(96)05247-3
- N. H. Wong and C. Yu, “Study of Green Areas and Urban Heat Island in a Tropical City,” Habitat International, Vol. 29, No. 3, 2005, pp. 547-558. doi:10.1016/j.habitatint.2004.04.008
- Y.-W. Zhang, Z.-L. Gu, Y. Cheng and S.-C. Lee, “Effect of Real-Time Boundary Wind Conditions on the Air Flow and Pollutant Dispersion in an Urban Street Canyond Large Eddy Simulations,” Atmospheric Environment, Vol. 45, 2011, pp. 3352-3359.
- B. I. Idris, K. Giskesa, C. Borrell, J. Benach, G. Costa, B. Federico, S. Helakorpi, U. Helmert, E. Lahelma, K. M. Moussa, P.-O. O¨stergren, R. Pra¨tta¨la¨ , N. Kr. Rasmussen, J. P. Mackenbach and A. E. Kunsa, “Higher Smoking Prevalence in Urban Compared to Non-Urbanareas: Time Trends in Six European Countries,” Health & Place, Vol. 13, No. 3, 2007, pp. 702-712. doi:10.1016/j.healthplace.2006.11.001
- H. B. Ren, W. S. Zhou, K. Nakagami, W. J. Gao and Q. Wu, “Feasibility Assessment of Introducing Distributed Energy Resources in Urban Areas of China,” Applied Thermal Engineering, Vol. 30, 2010, pp. 2584-2593.
- J. Yuan and A. Venkatram, “Dispersion within a Model Urban Area,” Atmospheric Environment, Vol. 39, No. 26, 2005, pp. 4729-4743. doi:10.1016/j.atmosenv.2005.04.021
- V. Kalantar, “Numerical Simulation of Cooling Performance of Wind Tower (Baud-Geer) in Hot and Arid Region,” Renewable Energy, Vol. 34, No. 1, 2009, pp. 246- 254. doi:10.1016/j.renene.2008.03.007
- H. Huang, R. Ooka, H. Chen, S. Katoa, T. Takahashia and T. Watanabec, “CFD Analysis on Traffic-Induced Air Pollutant Dispersion under Non-Isothermal Condition in a Complex Urban Area in Winter,” Journal of Wind Engineering and Industrial Aerodynamics, Vol. 96, 2008, pp. 1774-1788. doi:10.1016/j.jweia.2008.02.010
NOTES
*Corresponding author.