Advances in Breast Cancer Research
Vol. 2 No. 3 (2013) , Article ID: 33738 , 6 pages DOI:10.4236/abcr.2013.23013
Mammogram Images Thresholding for Breast Cancer Detection Using Different Thresholding Methods
Department of Mathematics and Computer Science, Beirut Arab University, Beirut, Lebanon
Email: Moumena.alhadithi@yahoo.com, dr_elzaart@yahoo.com
Copyright © 2013 Moumena Al-Bayati, Ali El-Zaart. This is an open access article distributed under the Creative Commons Attribution License, which permits unrestricted use, distribution, and reproduction in any medium, provided the original work is properly cited.
Received April 2, 2013; revised May 5, 2013; accepted May 13, 2013
Keywords: Breast cancer; Mammogram; Segmentation; Threshold; Otsu method
ABSTRACT
The purpose of this study is to apply different thresholding in mammogram images, and then we will determine which technique is the best in thresholding (extraction) malignant and benign tumors from the rest breast tissues. The used technique is Otsu method, because it is one of the most effective methods for most real world views with regard to uniformity and shape measures. Also, we present all the thresholding methods that used the concept of between class variance. We found from the experimental results that all the used thresholding techniques work well in detection normal breast tissues. But in abnormal tissues (breast tumors), we found that only neighborhood valley emphasis method gave best detection of malignant tumors. Also, the results demonstrate that variance and intensity contrast technique is the best in extraction the micro calcifications which represent the first signs of breast cancer.
1. Introduction
Normal cells of the human body grow and divide to generate new cells in order to meet the body needs. If these normal cells grow old or destroyed, they die. So the new cells take their place. Cancer occurs when these new cells are generated and the body does not need them; in addition, the old and destroyed cells do not die as they should, so these additional cells are constructed as a mass tissue known as a lump, growth or tumor [1].
One of the main lethal cancers is breast cancer [1,2]. It occurs in both males and females, but the breast cancer in men is scarce [1,3]. Around 25% of all cancers in woman are breast cancer, and approximately 20% of cancers causing death are breast cancers. It primarily sites in ducts (tubas that transfers milk to the nipple) and in the lobules (glands which make milk) in the breast by taking the form as micro-calcifications or masses [1]. Commonly, breast cancer cannot be avoidable, but at least early detection gives a big opportunity of the treatment of this disease [2]. One of the best tools for scanning the structure of the breast is mammogram [1,2]. Mammogram images are classified depended on the categories as malignant, benign and normal. Where benign and malignant are abnormal; benign tumors can be treated (not cancerous). In contrast, to malignant tumors (cancerous), this can damage neighboring tissues and spread to the rest parts of body [1,2]. Mammogram images are represented as very accurate and complex images to be interpreted [1,3]. Moreover, many cases (about 25%) of cancers are not detected in the screen. Therefore, there is a necessary need to improve computer-aided diagnosis (CAD) systems to help a radiologist in his diagnosis for the cancer [3,4]. For these reasons, our aim in this paper is to put the scope on applying different thresholding techniques on mammogram images as a try to determine which one presents best results.
This paper is organized as follows: Section 2 is a brief introduction of segmentation, and mention types of segmentation used in mammograms. It also defined the thresholding, and related works for thresholding used in mammogram images. Section 3 illustrated the formulation of the structure of an image. Section 4 describes Otsu method, and the techniques related to it. Section 5 is about the thresholding evaluation methods. Section 6 is a discussion for experimental results. Conclusions appear in Section 7.
2. Thresholding
Segmentation in image processing plays a central role in detection the region of interest from background. Its inputs are images and the outputs are the properties were obtained from those images [1,2]. Segmentation of intensity images (such as mammograms), contains four types of methods: thresholding techniques, boundary-based methods, region-based methods, and hybrid techniques that used both boundary and region criteria [1].
The thresholding in mammograms images is based on separated the histogram into background and breast tissues. Depending on the value of threshold all pixels less than the threshold are classified as background, and the reminder pixels are breast or vice versa [1-5]. As a related work there are many researchers used (global or local) thresholds to split the breast region from background; like in [6] presents simple histogram thresholding. Others like in [7-9] used global thresholding to extract the regions of interest (ROI) from the background. In contrary, in [10] local thresholds are used; in addition to region growing and morphological filter. In [5] the researcher applied entropy threshold to segment microcalcifications in mammographic X-ray images. Finally, in [11] a comparison has been done of automatic thresholding methods including Otsu’s method, Kapur ’s method, Pun’s method, Johannes’s method Iterative Selection, Fuzzy Sets, and semi-supervised thresholding method-Black PCT. After the comparison among these methods is done, the experimental outcomes ensured that Otsu method is the best in determination tumor cells.
In general, the previous thresholding techniques have disadvantages including some need manual adjustment of thresholds, and others require local statistics to get the thresholds (local thresholds) [5]. Therefore, we will use one of the best automatic thresholding selection techniques (Otsu method). Its concept based on selected the optimal threshold that maximizes the separability classes in gray levels [12]. Furthermore, many thresholding techniques have been appeared to revise Otsu technique; like [13-16]; each one developed Otsu method in a specific way. This research focuses on implemented thresholding techniques (Otsu method and the techniques related to it) on mammograms.
3. Formulation
To analyze and process any image we should know that an image is generated from a set of pixels denoted as n; for each image level there are a set of pixels denoted as ni. Therefore, the total number of pixels is defined as:
 (1)
(1)
Gray level histogram is normalized and regarded as a probability distribution:
 (2)
(2)
The gray level of an image is [0… L−1]. where the gray level 0 is the darkest and the gray level L−1 is the lightest.
The probability of occurrence of the two classes can be denoted as the following:
 (3)
(3)
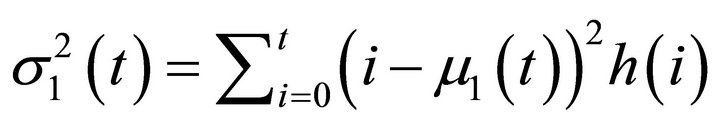
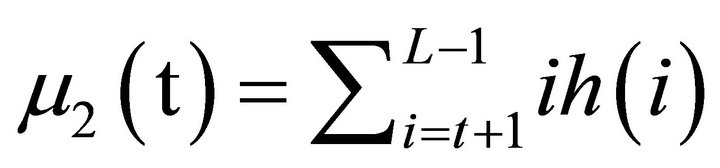
The mean and variance of the foreground and background are denoted respectively as the following:
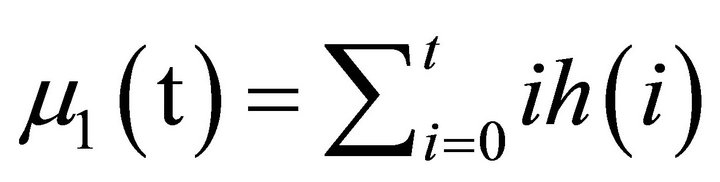 ,
,  (4)
(4)
 ,
, 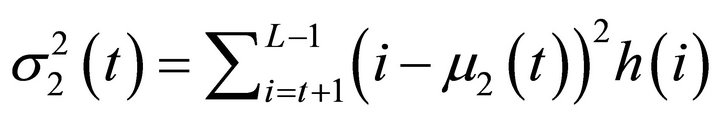 (5)
(5)
It worth to mention that in each image there is a specific thresholding algorithm used to get an optimal threshold, which separated the object from the background.
4. Otsu Method
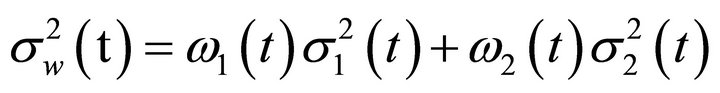
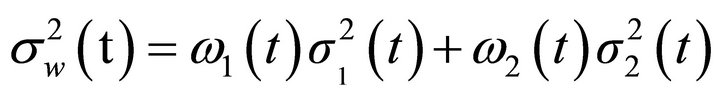
Otsu method is based on established the optimal threshold that (minimizing intra-class variance) or maximizing inter-class variance. The following equations will represent the within-class variance, and the between class variance respectively.
 (6)
(6)
 (7)
(7)
The final form of between-class variance can also be denoted as the following:
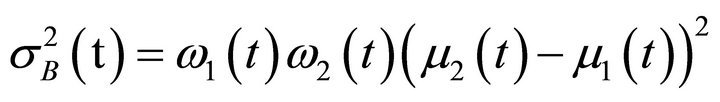 (8)
(8)
Otsu method is known as: It’s simple, effective, easier to apply and choosing the optimal threshold is automatically and stably [12].
The position of the optimal threshold is displayed in Figure 1 where first class represents the background, while the second class represents the object.
4.1. Valley Emphasis Method
The reason for formulating valley emphasis technique is that it can establish an optimal threshold for both bi-
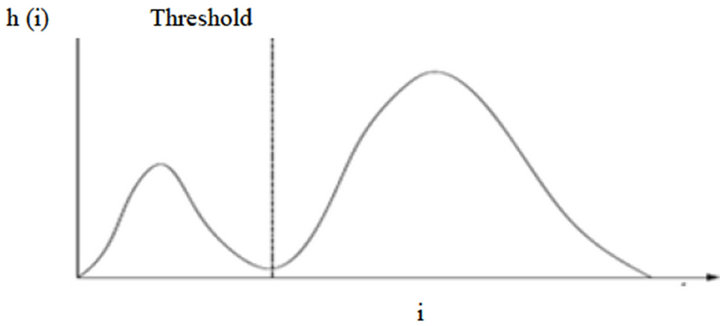
Figure 1. Optimal threshold in the histogram [14].
modal and unimodal histogram. In other word, it can extract large and small objects from the background. This technique can be considered as a modified of Otsu method, which failed in detection small objects. Establishing the optimal threshold will be based on two factors:
• It should have minimum probability of occurrence (valley in the grey level histogram).
• Making between class variance is larger as much as possible like in Otsu method.
The valley-emphasis equation is as in [13].
 (9)
(9)
In this technique the smallest probability of occurrence h (t) value; means the largest the weight (1 − h (t)). The largest weight confirms that the chosen threshold is in the valley between two peaks for (bimodal histogram) as seen in Figure 2(a), or at the bottom rim of a single peak for (unimodal histogram) as seen in Figure 2(b) [13].
4.2. Neighborhood Valley Emphasis Method
To give more reliable segmentation result; a neighbourhood valley emphasis technique is presented. It developed the prior technique by computing the grey values for both the valley point and its neighborhood. So that, selection the optimal threshold will be based on maximum weight  of the valley and its neighborhood.
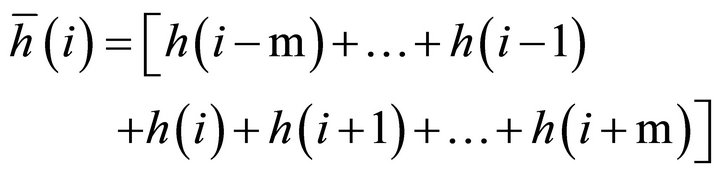
If the image has one dimensional histogram h(i); the neighborhood grey value h(i) of the grey level i is denoted as :
 (10)
(10)
Equation (10) refers to the sum of probability of occurrence for the neighborhood valley point; within the range n = 2m + 1. Where n is denoted as neighborhood length; usually it is odd number.
The neighborhood valley emphasis technique is de-
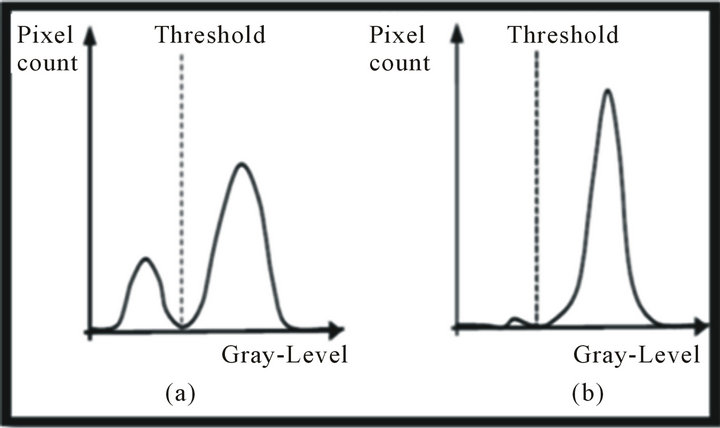
Figure 2. Optimal threshold selection in gray-level histogram. (a) bimodal; (b) unimodal [13].
noted as the following:
 (11)
(11)
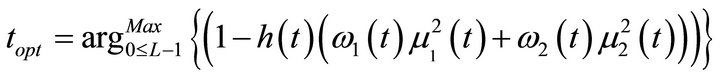
The optimal threshold which increasing between class variance will be denoted as the following:
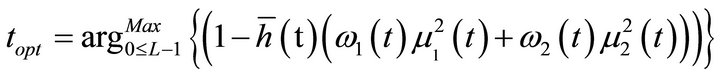 (12)
(12)
Equation (11) represents the smallest probability of occurrence of the valley point and its neighborhood; in contrast, to Equation (9) that has only minimum probability of occurrence of the valley point.
This technique is suitable for processing images with big diversity between the object variance and background variance [14].
4.3. Thresholding Based on Variance and Intensity Contrast
A presented technique used both within-class variance and the intensity contrast at the same time.
This technique succeeded in extraction an object from complex background distribution in an image. It is idea based on attempt to make the within class variance is smallest, and the intensity contrast is largest simultaneously. In addition, there is a parameter λ that represents the important factor in the formula. It’s a weight that balanced the contribution for the (within class variance and intensity contrast).
The proposed formula is defined as the following:
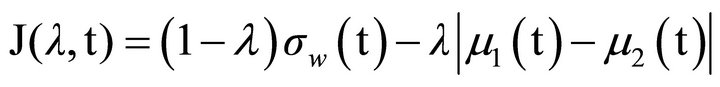 (13)
(13)
where  (t),
(t),  (t) are the mean intensities of the object and background.
  Refers to the square root of within-class variance; the
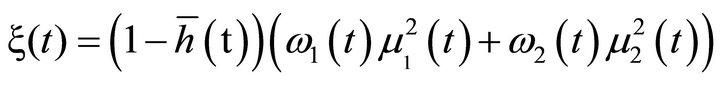
  is formulated from the following equation (14).
 (14)
(14)
In Equation (14), the first term refers to the probability of class occurrence and the standard deviation (variance) of the first class, while the second term refers to the probability of class occurrence and the standard deviation (variance) of the second class.
The optimal threshold will dichotomize the image into object and background to get best segmentation result [15].
4.4. Variance Discrepancy Method
The presented technique is used for segmented images that have large variance discrepancy between the object and background. It computes both the variance sum and variances discrepancy to get effective segmentation outcomes.
The introduced technique is formulated as the following:
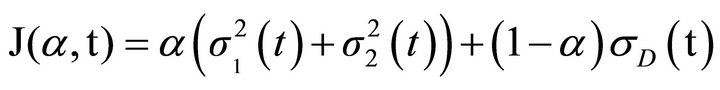 (15)
(15)
where
 (16)
(16)
and
or
 .
.
σD(t) Is a measurement of the two classes. σ01(t), σ02(t) are the standard deviation (variances) for the two classes. α is a main factor that determines the contributions of variance sum and variance discrepancy.
The optimal threshold will tend to make the effect of class variance sum is smallest, and increase the focus of variance discrepancy at the same time [16].
5. Thresholding Evaluation Methods
The quality of thresholding technique is a critical issue; it various depending on the type of the thresholding technique and the kind of image. In order to analyze the performance of the thresholding techniques, there are different evaluation methods used to measure their robustness and efficiency. In our study we used two evaluation methods Region Non-Uniformity (NU) and Inter-Region Contrast (GC) [17]. Then, we compare the results of the five thresholding techniques to determine which technique is the best in determination the region of interest (object) from the background.
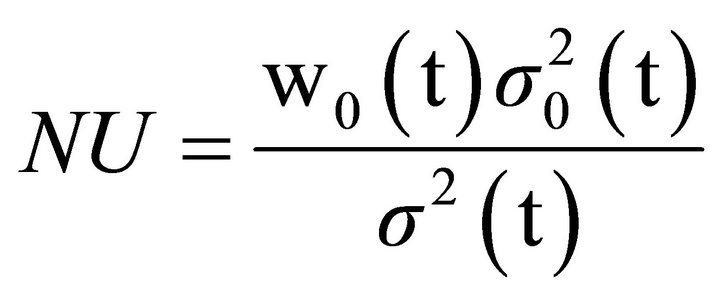
5.1. Region Non-Uniformity (NU)
This method measures the ability to distinguish between the background and object in the thresholded image. A good thresholded image should contain higher intra region uniformity, which is related to the similarity attribute about region element In the following NU Equation (17): σ2(t) denotes to the variance of the whole image, while σ02(t) denotes to the variance of the object (foreground). w0(t) denotes to the probability of occurrence of the object. NU equal to zero denotes to well thresholded image, but NU = 1 denotes to incorrect thresholded image [17].
 (17)
(17)
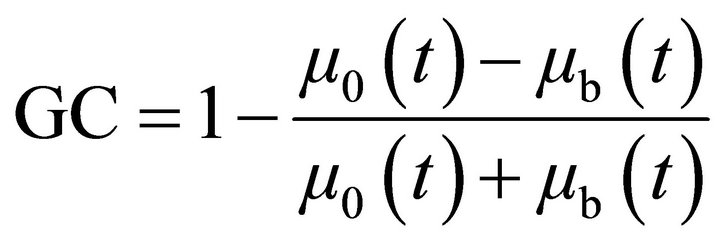
5.2. Inter-Region Contrast (GC)
This method is very important in measure the contrast degree in the thresholded image. A good thresholded image should have higher contrast across adjacent regions. In the following GC Equation (18) the object average gray-level is known as μ0(t), and the background average gray-level is known as μb(t) [17].
 (18)
(18)
6. Experimental Results
In the following examples we applied the thresholding techniques on negative mammogram images in order to bring the part of interest from bright region (second mode) to dark region (first mode) and then determine the threshold values. It is worth to mention that the radiologist diagnosis the first Figure 3(a1) normal breast masses, Figure 4(a2) is an image for micro calcifications, while Figure 5(a3) represents breast tissues with small malignnant tumor. In the following examples we will show the performance of each thresholding techniques.
In the first example Figure 3(a1) is the original image of normal breast tissues. In general, and as we see all the five thresholding techniques detect the normal breast tissues. In Figure 3(b), the result of Otsu method that separated the object from the background successfully with T = 157. Figure 3(c), Valley emphasis method also extracted the object from the background with T = 150. Figure 3(d) The third method neighborhood valley emphasis method gave the same result of segmentation of the valley emphasis method with T = 149. Figure 3(e), Variance and intensity contrast method gave T = 141 to separate the object from the background. Finally, Figure 3(f) is the variance discrepancy method with T = 141 that also extracted the normal tissues from the background. The best region non uniformity NU = 0.112841 is introduced from Otsu method, on the other side the best inter region contrast GC = 0.556721 is get from both variance and intensity contrast technique and variance discrepancy technique.
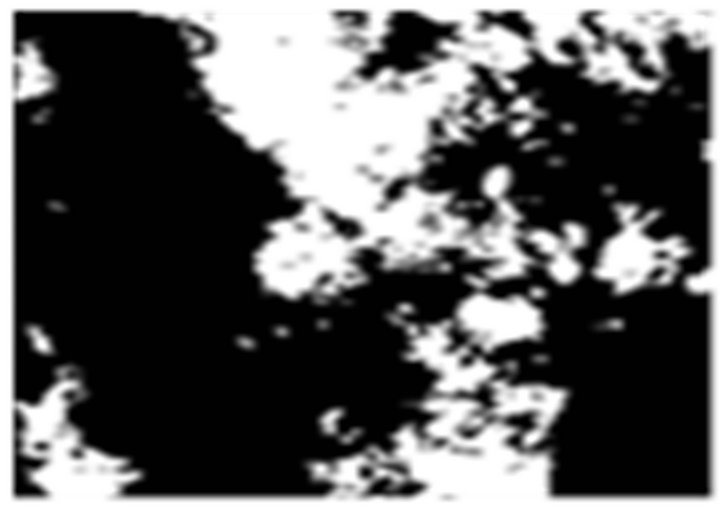
Most early breast cancer can be diagnosed by detecting micro calcifications in the mammogram image. Figure 4(a) is an example for the micro calcifications in the mammogram image. As we see in Figure 4(b) Otsu method did not detect the micro calcifications, and its optimal threshold T = 53. In Figure 4(c) valley emphasis method failed in isolated the micro calcifications from the background; its optimal threshold T = 49. The third method is neighborhood valley emphasis method with threshold T = 78 gives bad results as shown in Figure 4(d). Variance and intensity method succeed in isolation the micro calcifications from the complex intensity background. Its optimal threshold is get from λ = 0.05. Moreover, this method presents the smallest value of region non uniformity NU = 0.00799638 and the smallest
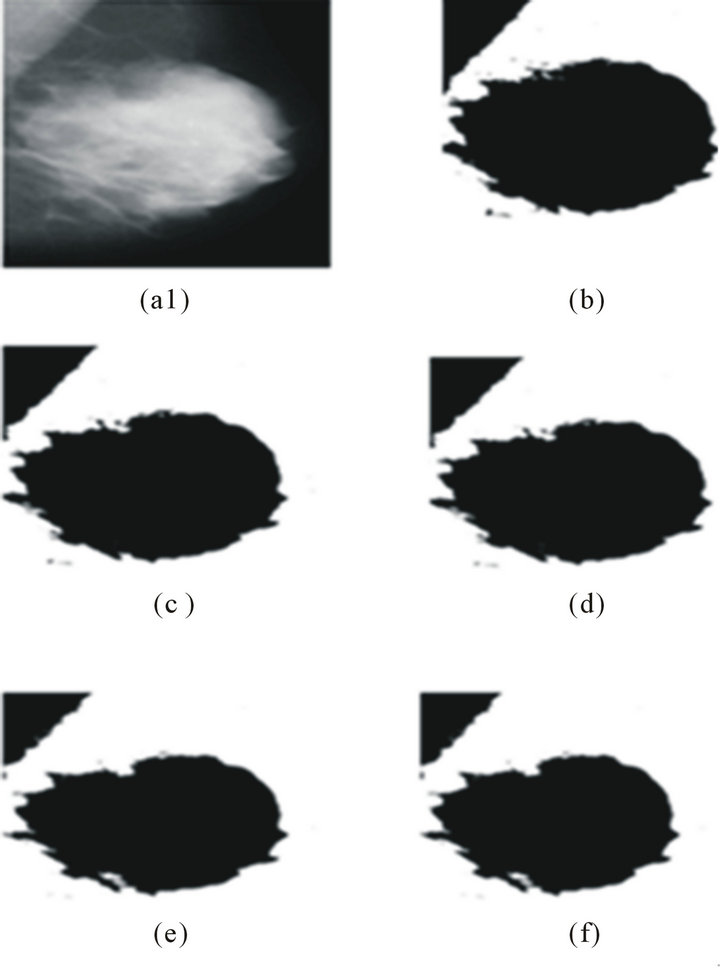
Figure 3. (a1) Original image; (b) Otsu technique T = 157; (c) Valley emphasis technique T = 150; (d) Neighborhood valley emphasis T = 149; (e) Variance and intensity contrast T = 141; (f) Variance discrepancy T = 141.
average = 0.169415. On the other hand, the smallest inter region contrast GC = 0.319315 is presented from variance discrepancy method.
Figure 5(a3) is the original image with a small tumor. Figure 5(b) Otsu method with T = 190 did not detect the tumor; moreover, the object details are not clear. The reminder methods like Figure 5(c) valley emphasis method failed to extract the tumor from the rest normal tissues. Figure 5(e) variance and intensity contrast method also failed in detection the tumor, and it reported incorrect threshold with white image. Figure 5(f) is variance discrepancy method also failed in detection the tumor from the background. Only, Figure 5(d) the threshold that is obtained from neighborhood valley emphasis method succeeded in detection the tumor from the background with optimal threshold T = 114 NU = 0.614376, GC = 0.606957, and the average = 0.610667. Moreover, the radiologist diagnoses the tumor with all its protrusions as malignant tumor. Table 1 displays the results of the five thresholding methods including the optimal threshold, region non uniformity, inter region contrast and the average.
7. Conclusion
In conclusion, we studied and implemented five different methods of thresholding. These methods are based on
 (a2)
(a2)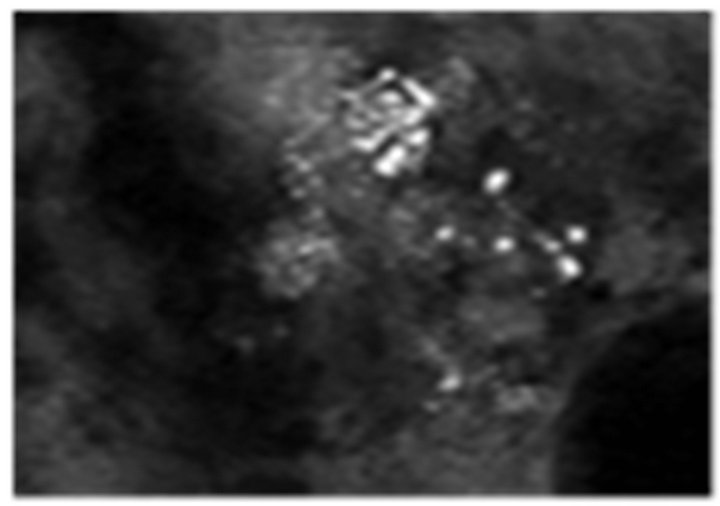 (b)
(b)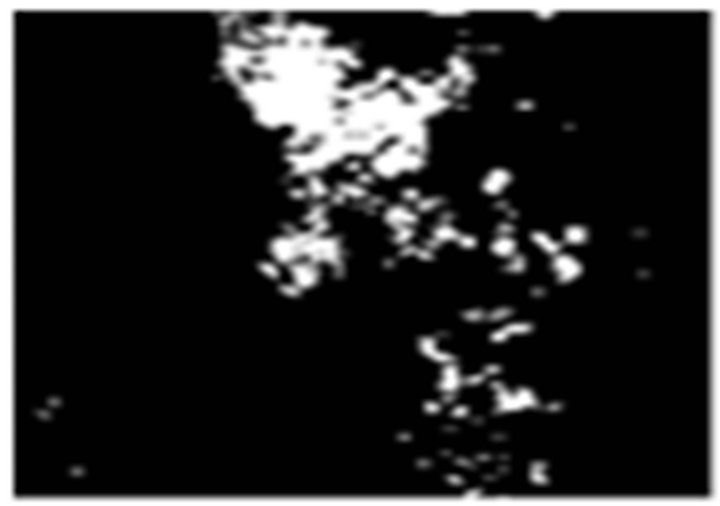 (c)
(c)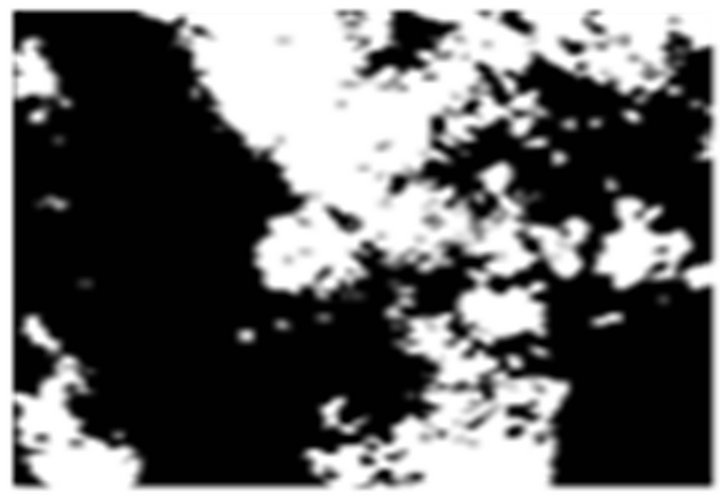 (d)
(d)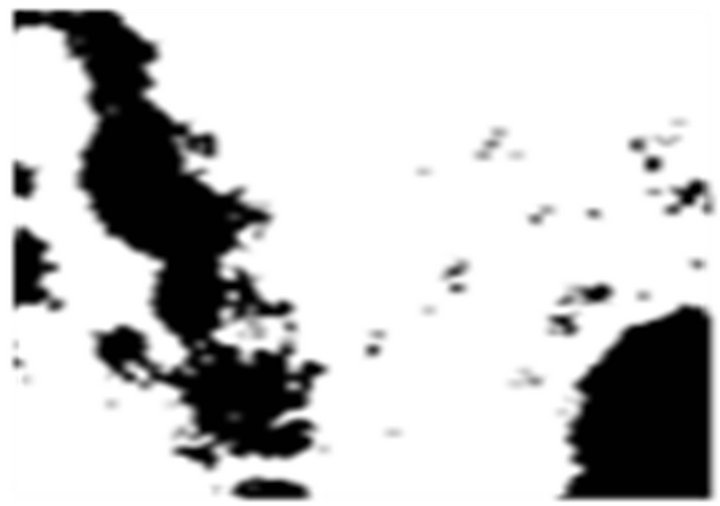 (e)
(e)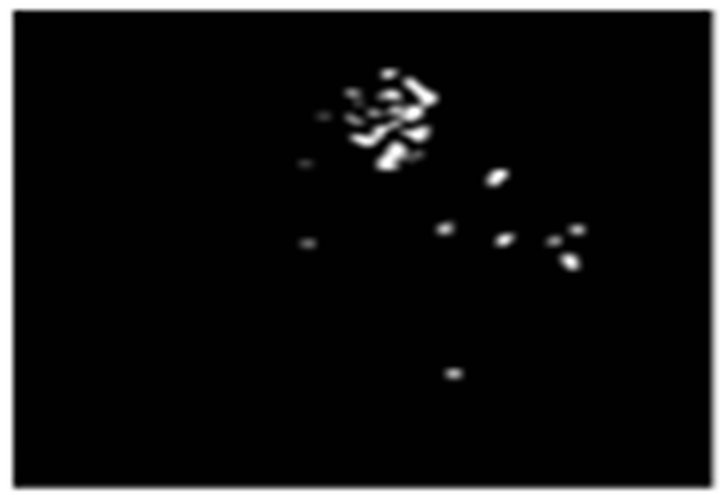 (f)
(f)
Figure 4. (a2) Original image; (b) Otsu technique T = 53; (c) Valley emphasis technique T = 49; (d) Neighborhood valley emphasis T = 78; (e) Variance and intensity contrast T = 161; (f) Variance discrepancy T = 20.
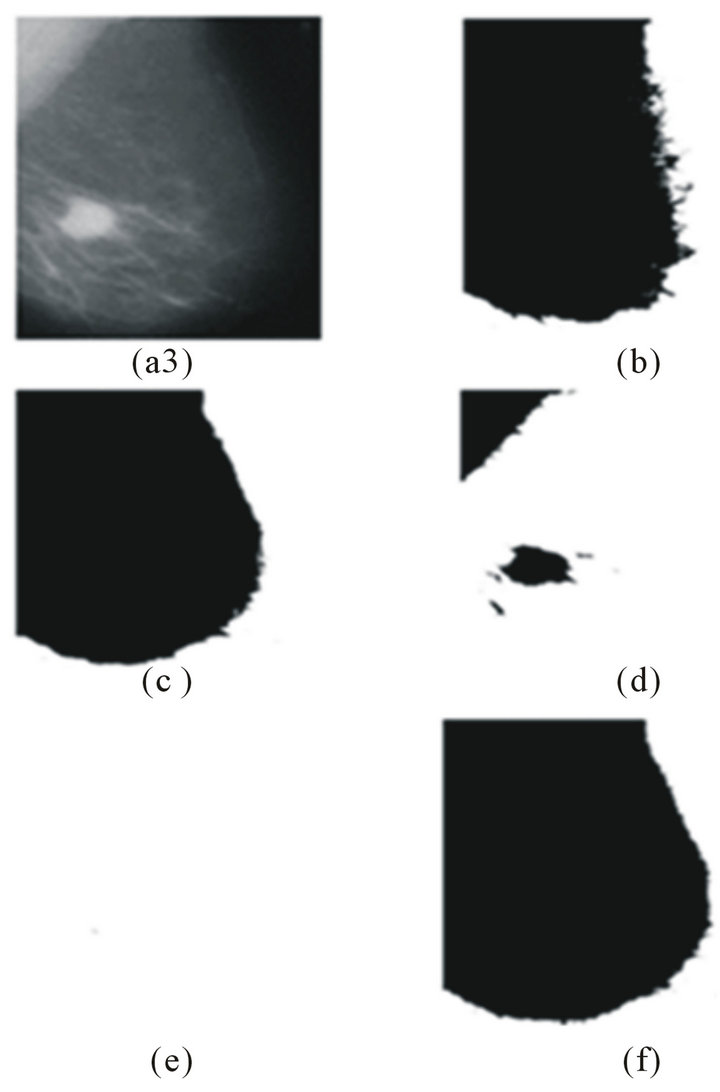
Figure 5. (a3) Original image; (b) Otsu technique T = 190; (c) Valley emphasis technique T = 215; (d) Neighborhood valley emphasis T = 114; (e) Variance and intensity contrast T = 48; (f) Variance discrepancy T = 223.
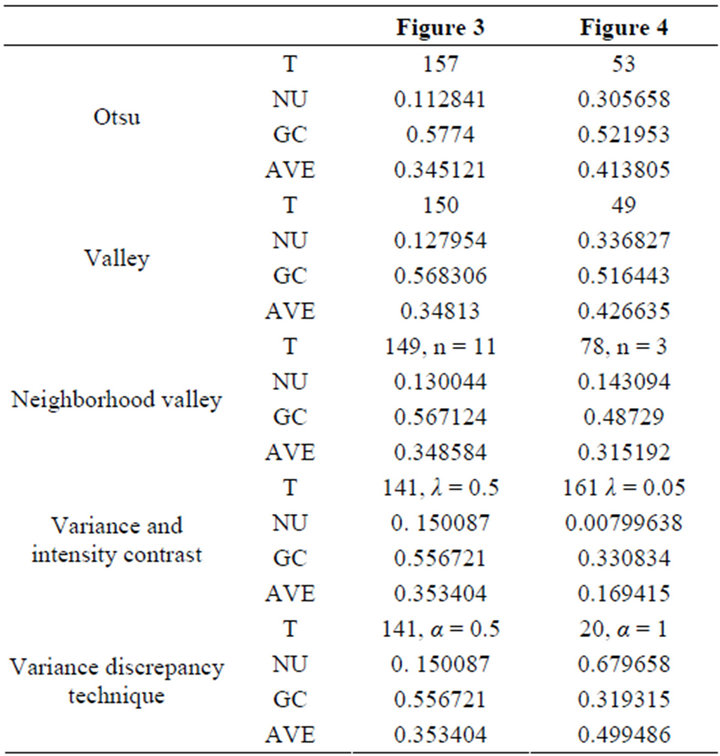
Table 1. show the values of (T, NU, GC, AVE) of the five thresholding methods in Figures 3 and 4.
Otsu method. The experimental results ensure that when we have big region of bright object inside the breast, the five methods are well detected the bright tissues. Furthermore, one of our efficient results represents that the micro calcifications are detected by using variance and intensity contrast. This contribution is very useful in detection breast cancer early. Then, this gives a big opportunity for the women patients to handle the breast cancer early. Also, we found, for breast tumors, only neighborhood valley emphasis method can detect the small region of bright tissue inside the breast, and it can help in other cases of diagnosis breast tumors.
8. Acknowledgements
This work is supported by the National Plan for Science and Technology (NPST), King Saud University, Riyadh, Saudi Arabia under the project 08-INF325-02. We wish to thank Dr. Yamama Al-hadithi Head of the department Gynecology and Obstetrics hospital of Tikrit, and the radiologist Dr. Jinan Al-rawi, for their diagnosis for the mammogram images.
REFERENCES
- D. Pnraj, M. Jenifer, P. Poongodi and J. Manoharan, “A Survey on the Preprocessing Techniques of Mammogram for the Detection of Breast Cancer,” Journal of Emerging Trends in Computing and Information Sciences, Vol. 2, No. 12, 2011, pp. 656-664. http://www.cisjournal.org
- M. Vasntha, “Classifications of Mammogram Images Using Hybrid Features,” European Journal of Scientific Research, Vol. 57, No. 1, 2011, pp. 87-96. http://www.eurojournals.com/ejsr.htm
- B. Hong and M. Brady, “Segmentation of Mammograms in Topographic Approach,” Medical Vision Laboratory, University of Oxford, Oxford, 2003, pp. 157-160.
- S. Dehghani and M. Dezfooli, “A Method for Improve Preprocessing Images Mammography,” International Journal of Information and Education Technology, Vol. 1, No. 1, 2011, pp. 90-93.
- M. Melloul and L. Joskowicz, “Segmentation of Micro Calcification in X-Ray Mammograms Using Entropy Thresholding,” CARS/Springer, Berlin, 2002.
- A. Hoyer and W. Spiesberg, “Computerized Mammogram Processing,” Phillips Technical Review, Vol. 38, 1979, pp. 347-355.
- T. Lau and W. Bischoff, “Automated Detection of Breast Tumors Using the Asymmetry Approach,” Computers and Biomedical Research, Vol. 24, No. 3, 1991, pp. 273-295. doi:10.1016/0010-4809(91)90049-3
- Yin and M. Giger, “Computerized Detection of Masses in Digital Mammogram: Analysis of Bilateral Subtraction Images,” Medical Physics and Biology, Vol. 28, 1991, pp. 955-963.
- J. Byng and N. Boyd, “Automated Analysis of Mammographic Densities,” Medical Physics and Biology, Vol. 41, No. 5, 1996, pp. 909-923. doi:10.1088/0031-9155/41/5/007
- U. Bick and M. Giger, “Automated Segmentation of Digitized Mammograms,” Academic Radiology, Vol. 2, No. 1, 1995, pp. 1-9. doi:10.1016/S1076-6332(05)80239-9
- H. Jeong, T. Kim, H. Hwang, H. Choi, H. Park and H. Choi, “Comparison of Thresholding Methods for Breast Tumor Cell Segmentation,” 2005, pp. 392-395.
- N. Otsu, “A threshold Selection Method from Gray Level Histograms,” IEEE Transactions on Systems, Man and Cybernetics, Vol. SMC-9, No. 1, 1979, pp. 62-66.
- H. Ng, “Automatic Thresholding for Defect Detection,” Pattern Recognition Letters, Vol. 27, No. 14, 2006, pp. 1644- 1649. doi:10.1016/j.patrec.2006.03.009
- J. Fan and B. Lei, “A Modified Valley-Emphasis Method for Automatic Thresholding,” Pattern Recognition Letters, Vol. 33, No. 6, 2012, pp. 703-708. doi:10.1016/j.patrec.2011.12.009
- Y. Qiaoa, Q. Hua, G. Qiana, S. Luob and W. Nowinskia, “Thresholding Based on Variance and Intensity Contrast,” Pattern Recognition, Vol. 40, No. 2, 2007, pp. 596-608. doi:10.1016/j.patcog.2006.04.027
- Z. Li, C. Liu, G. Liu ,Y. Cheng, X. Yang and C. Zhao, “A Novel Statistical Image Thresholding Method,” International Journal of Electronics and Communications, Vol. 64, No. 12, 2010, pp. 1137-1147. doi:10.1016/j.aeue.2009.11.011
- Y. J. Zhang, “A Survey on Evaluation Methods for Image Segmentation,” Pattern Recognition, Vol. 29, No. 8, 1996, pp. 1335-1346.