Advances in Alzheimer's Disease
Vol.2 No.3(2013), Article ID:37288,8 pages DOI:10.4236/aad.2013.23014
Calcineurin overexpression regulates APP metabolism
![]()
Department of Biology, Drexel University, Philadelphia, USA; *Corresponding Author: Aleister.Saunders@drexel.edu, suruchiu86@gmail.com, seanjmiller90@gmail.com,
Copyright © 2013 Suruchi Utreja et al. This is an open access article distributed under the Creative Commons Attribution License, which permits unrestricted use, distribution, and reproduction in any medium, provided the original work is properly cited.
Received 23 May 2013; revised 2 July 2013; accepted 11 July 2013
Keywords: Alzheimer’s Disease; Calcineurin; APP; Aβ; FK506
ABSTRACT
Alzheimer’s disease (AD) is a complex neurodegenerative disease, pathologically characterized by the accumulation of β-amyloid peptide (Aβ) and intraneuronal neurofibrillary tangles. Production of the Aβ peptide by the regulated intra-membrane proteolysis of the β-amyloid precursor protein (APP) is a central event in AD. Cognitive decline observed in AD models is dependent on Aβ generation. One of the downstream effects mediated by soluble Aβ oligomers includes the hyperactivation of calcineurin (CaN), a Ca2+ and calmodulin (CaM)-dependent, serinethreonine protein phosphatase. CaN is one of the major phosphatase associated with cognitive and neurodegenerative effects of Aβ. A specific isoform of CaN, CaNAβ, is one of the most up-regulated mRNAs in brains of early stage AD patients. While Aβ’s ability to activate CaN has been well studied, not much is known about how increased levels of CaN in AD brain can contribute towards Aβ generation. In this study we specifically investigate if increased levels of CaNAβ regulate APP metabolism. Our results demonstrate that increased CaNAβ expression leads to increased APP levels and increased proteolytic products of APP, including Aβ. The data suggest that upregulation of CaN levels could contribute to neurodegeneration observed in AD by increasing levels of Aβ, potentially forming a pathogenic feed forward loop.
1. INTRODUCTION
Alzheimer’s disease (AD) is a progressive neurodegenerative brain disorder characterized by global cognitive decline involving memory, orientation, judgment, and reasoning [1]. The characteristic neuropathological hallmarks of AD include the presence of neurofibrillary tangles, senile plaques, and massive loss of neurons primarily in cerebral cortex and hippocampus in the brain [2]. The neurofibrillary tangles are paired helical filaments containing hyperphosphorylated form of the microtubule binding protein Tau. Senile plaques are extracellular deposits composed of β-amyloid (Aβ) peptide [2]. The Aβ peptides are generated by proteolytic processing of thelarge, type-I transmembrane protein, β-amyloid precursor protein (APP) [3]. Initially, APP is cleaved by β-secretase (BACE) to produce sAPPβ and a carboxy terminal fragment of 99 amino acids (CTF-99). Subsequently, CTF-99 is then cleaved by γ-secretase to produce Aβ and AICD (APP intracellular domain) [4]. Alternatively, nonamyloidogenic processing of APP can also occur. In this scenario, APP is initially cleaved by α-secretase (ADAM 9, 10, 17) to produce sAPPα and a CTF of 83 amino acids in length (CTF-83). This shorter CTF-83 is then cleaved by γ-secretase to produce p3 and AICD. Because Aβ is generated as part of the normal APP processing, deregulation of APP processing can alter the levels of Aβ being produced. Excessive production and accumulation of the Aβ peptide plays a fundamental role in AD pathology. Therefore, APP proteolysis is considered a central event in the development of AD.
Aβ’s ability to activate Calcineurin (CaN), a member of the serine/threonine protein phosphatase family, has been well studied [5-7]. Specifically, increased Aβ levels perturb intracellular calcium (Ca2+) levels which, in turn, lead to CaN hyperactivity. This Aβ-mediated increase in CaN activity has been shown to play a role in altered synaptic plasticity, neuronal apoptosis, loss of dendritic spines, simplification of dendritic arborization and neuritic dystrophies, elevation in glutamate, excitotoxic cell death and behavioral impairments observed in some AD mouse models [6-10]. Pharmacologic inhibition of CaN activity, using FK506, has been shown to partially attenuate these effects.
CaN is a heterodimer consisting of a 58 - 64 kDa catalytic subunit (CaNA) tightly bound to a 19 kDa regulatory subunit (CaNB) [11]. CaNA is composed of a catalytic domain and a regulatory domain that contains a CaNB binding sequence, a calmodulin (CaM) binding domain and an autoinhibitory domain. The phosphatase is activated when Ca2+/CaM binds to it, triggering a conformational change that releases the autoinhibitory domain from catalytic active site [12]. CaNA can also be activated by proteolytic cleavage of the autoinhibitory domain, resulting in a Ca2+/CaM-independent active phosphatase [13-16]. Three mammalian isoforms of CaNA (α, β, γ) have been identified, and their amino acid sequences have been highly conserved between different organisms [17]. CaNAα and CaNAβ are ubiquitously distributed, while CaNAγ is specifically expressed in the testis. The regulatory subunit CaNB, has two mammalian isoforms CaNB1 and CaNB2, which are also highly conserved and have four Ca2+ binding “EF-hands” each. CaNB1 is ubiquitously expressed as a heterodimer with CaNAα or β, while CaNB2 binds to CaNAγ and is expressed only in testis [11].
CaN is widely expressed in mammalian tissues, but its concentration in brain is 10 - 20 times higher than that found in other tissues [11]. In the brain, CaN accounts more than 1% of the total protein content [18,19]. Interestingly, levels of CaNAβ have been reported to be significantly upregulated in the Alzheimer’s disease hippocampus [20,21]. CaNAβ has also been shown to modulate tau phosphorylation state suggesting its role in development of neurofibrillary tangles [22]. In our study we investigate if CaNAβ overexpression, in HEK293 cells, alters levels of APP and its proteolytic products including Aβ.
2. EXPERIMENTAL PROCEDURES
2.1. Plasmids
CaNAβ (PPP3CB) overexpression plasmid (pCMVSPORT6) was purchased from Open Biosystems. Swedish APP695 plasmid (pCMV-SPORT5) was generated in our lab by mutating APP695 (pCMV-SPORT5).
2.2. Antibodies
Primary antibodies utilized were: a polyclonal antibody raised to the C-terminus of APP (A8717; Sigma Aldrich, Inc), C1/6.1 monoclonal antibody recognizing the Cterminus of APP was kindly provided by P. M. Mathews, an Anti-APP monoclonal antibody was used to detect levels of sAPP total (22C11, Millipore), a monoclonal anti-β-Actin antibody (A5441, Sigma Aldrich, Inc), a polyclonal antibody that recognizes APP phosphorylated at Thr668 (D90B8; Cell Signaling Technologies), a monoclonal antibody to the CaN catalytic subunit (C1956; Sigma, Inc).Secondary antibodies used were: goat antiRabbit IR-Dye800 CW (926-3211;LiCor Inc) and/or goat anti-Mouse IR Dye 680 (926-3200; LiCor Inc).
2.3. Cell Culture and Overexpression Experiments
HEK-293 cells were purchased from the American Type Culture Collection (ATCC) (Manassas, VA). HEK-293 cells were cultured in Dulbecco’s modified Eagles medium (DMEM), supplemented with 10% fetal bovine serum, penicillin (25,000 U/ml) and streptomycin (25,000 μg/ml). HEK293 cells were then transiently transfected with CaNAβ overexpression construct and an appropriate empty vector control. 48 hours post-transfection, cell lysates were collected and used for Western Blot analysis. Conditioned media from the above experiment was used to detect s-APP total and Aβ levels.
2.4. Western Blot Analysis
After the treatments, cells were washed twice with cold PBS and then lysed in RIPA Buffer (50 mM Tris, 150 mM NaCl, 1% SDS, 1% NP-40, 0.5% deoxycholate, pH 8.0) containing HALT protease and phosphatase inhibitor cocktail (ThermoFisher). 10 μl of the whole cell lysates were used to determine protein concentration (BCA Protein Assay Kit; Pierce, Inc.). Based on the protein concentrations, samples for Western Blot analysis were prepared using the 4× Nupage LDS sample buffer (InVitrogen, Inc.) containing 0.2% BME (β-Mercaptoethanol, Sigma Aldrich). Equal concentrations of protein were loaded into each well of NuPAGE 4% - 12% Bis Tris Gel. A molecular weight ladder (Two color protein standard, 928-40001, Li-COR) was always run alongside of the experimental samples. Proteins were then transferred from the gel to a 0.25 μm PVDF membrane (Millipore) using a semi-dry transfer apparatus. Blots were blocked (Blocking buffer, Li-COR) and then probed with primary and secondary antibodies. Target protein densitometry was quantified using the software (ODYSSEY Infrared imaging system, Application software) and normalized to the densitometry of β-actin. All Western blot experiments were performed in triplicates.
2.5. RNA Extraction and Quantitative PCR
48 hours post-transfection, cells were washed with cold PBS and total RNA was isolated using RNeasy Mini Kit (Qiagen Inc.). To quantify APP mRNA levels, cDNA was synthesized using total RNA, N6 random primers and SuperScript II Reverse Transcriptase (Invitrogen). cDNA was then diluted 1:15 using RNase free water and mixed with APP or GAPDH primer/probe sets (Applied Biosystems, Inc.; APP Catalog # Hs00169098_m1; GAPDH Catalog # Hs99999905_m1), 2× PCR Universal Master Mix (Applied Biosystems, Inc.) and amplified using an ABI 7500 Real Time PCR system following the manufacturer’s directions. GAPDH was used as an internal control. To determine differences in APP mRNA levels, we utilized the ΔΔCt method and calculated fold change.
2.6. Aβ ELISA
Aβ levels were determined using commercially available Human/Rat β Amyloid (40) ELISA Kit Wako (Wako Catalog #294-62501, 96 tests) according to the manufacturer’s instructions. Conditioned media obtained from the treatments were diluted 1:30 in manufacturer supplied sample buffer. Conditioned media was then used for measuring secreted Aβ40. In brief, Aβ40 levels (pg/ml) were quantified following the manufacturer’s instructions.
2.7. Statistical Analysis
Values in the text and figures are presented as means ± standard errors of at least three independent experiments. Equal variance or separate variance two-sample student’s t-test were used, as appropriate, to compare two groups. “*” indicates p < 0.05, “**” indicates p < 0.01, and “***” indicates p < 0.001. “n.s.” indicates p-values greater than 0.05.
3. RESULTS
3.1. CaNAβ Overexpression Increases Levels of FL-APP, APP-CTF & sAPP-Total and Aβ40
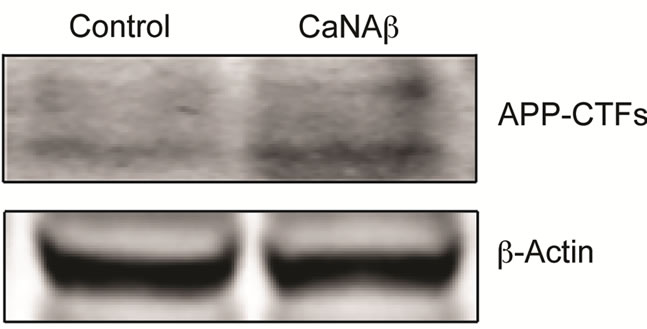
To test whether CaNAβ alters APP metabolism, CaNAβ was overexpressed in HEK293 cells (Figure 1(a)). The effect of overexpression on levels of endogenous, full-length APP770 and APP751 (FL-APP) and their proteolytic fragments was assessed. Upon CaNAβ overexpression, we observed a significant increase in levels of endogenous FL-APP levels (Figures 1(a) & (b)) and APP-CTF’s (CTF-83 and CTF-99) (Figures 1(c) & (d)). Both CTF-83 and CTF-99 were significantly increased when they were quantified individually and normalized to β-actin (data not shown). To determine if this increase observed in levels of APP-CTF’s was due to increase in FL-APP levels, we normalized APP-CTF levels to FLAPP levels and observed no significant change, suggesting that the increase we observe in APP-CTF’s levels is solely due to the increase in FL-APP levels (Figure 1(e)).
Next, we wanted to determine if CaNAβ overexpres-
 (a)
(a)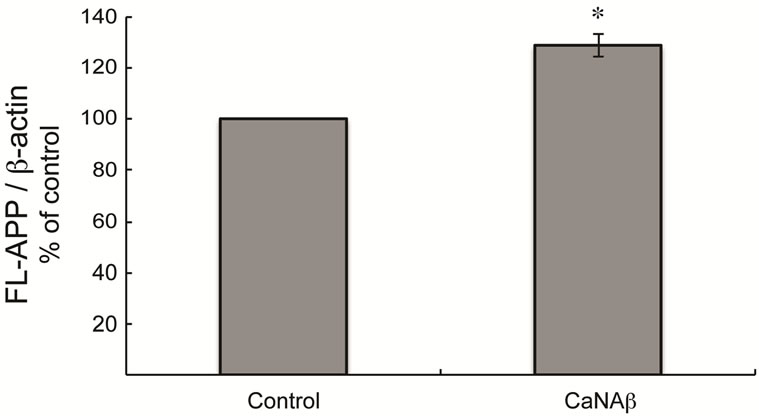 (b)
(b)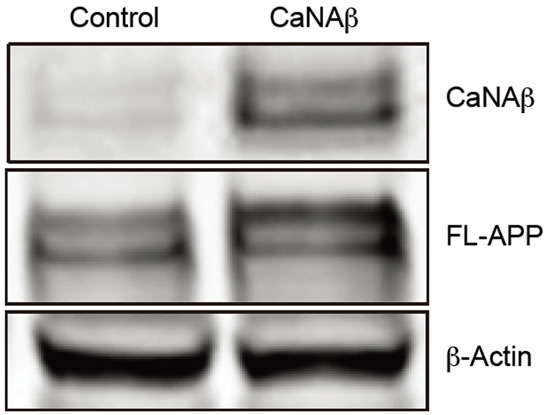 (c)
(c)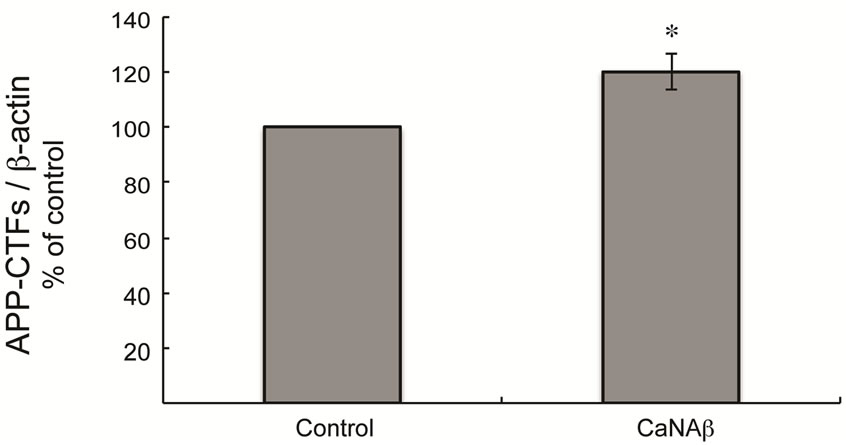 (d)
(d)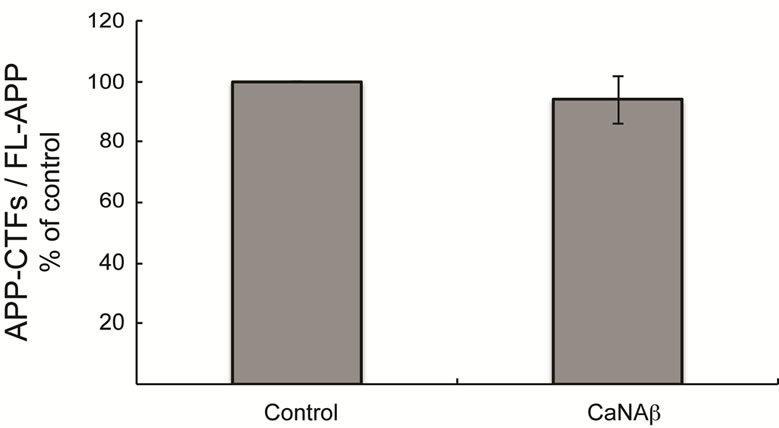 (e)
(e)
Figure 1. CaNAβ overexpression alters levels of endogenous APP and APP-CTF’s. CaNAβ or an empty vector was transiently transfected into HEK293 cells. (a) Representative western blot showing an increase in levels of CaNAβ and endogenous FL-APP when CaNAβ is overexpressed; (b) Quantification shows a significant increase in levels of endogenous FL-APP. β-Actin was used as a loading control; (c) A representative Western blot showing an increase in levels of endogenous APP-CTF’s upon CaNAβ overexpression; (d) Quantification shows that the increase observed in levels of APP-CTF’s is significant; (e) APP-CTF’s levels were normalized to FL-APP levels and no significant difference in the ratio is observed. Values are means ± standard error of 3 independent experiments. “*”: p < 0.05and “n.s.”: p-values > 0.05 (Student’s t-test).
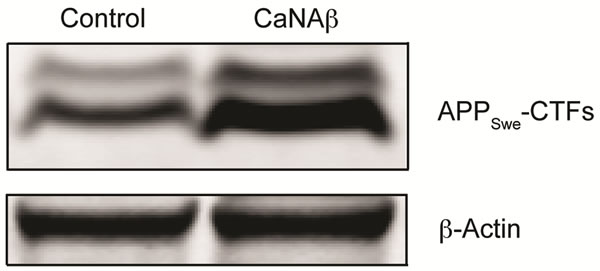
sion in HEK293 could alter levels of other APP proteolytic products. Therefore, CaNAβ was co-overexpressed with Swedish APP695 (APPSwe) in HEK293 cells. Similar to what we observed with endogenous FL-APP, CaNAβ co-overexpression resulted in a significant increase in FL-APPSwe levels (Figures 2(a) & (b)) and in APPSwe- CTF levels (CTF-83 and CTF-99) (Figures 2(c) & (d)). Increase in both CTF-83 and CTF-99 was observed when normalized to β-actin (data not shown). Again the increase observed in APPSwe-CTF’s levels was dependent on the increase in FL-APPSwe levels (Figure 2(e)). Given that CaNAβ overexpression lead to an increase in FLAPPSwe and APPSwe-CTF levels, next we used the conditioned media collected from these cells to probe for soluble APP levels (sAPPSwe Total). We observed a significant increase in levels of sAPPSwe total with CaNAβ cooverexpression with Swedish APP695 (Figures 2(f) & (g)). Lastly, we measured levels of Aβ40 in the conditioned media and observed a significant increase in levels of Aβ40 with CaNAβ overexpression (Figure 2(h)). This increase in Aβ40 levels was again dependent on the increase in FL-APPSwe levels (Figure 2(i)).
3.2. CaNAβ Overexpression Increases Phospho-APPSwe and Phospho-APPSwe-CTF Levels
Given CaNAβ’s role as a phosphatase we investigated the effect of CaNAβ overexpression on APP phosphorylation. Co-overexpressing CaNAβ and APPSwe lead to a significant increase in phospho-Thr668 FL-APPSwe levels (Figures 3(a) & (b)). A significant increase in phos-
 (a)
(a)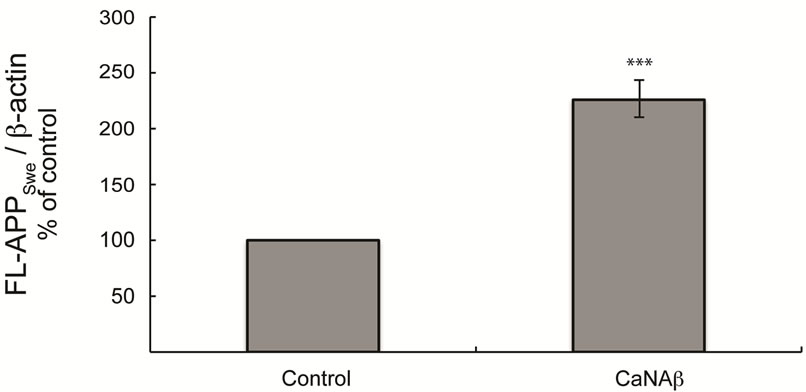 (b)
(b)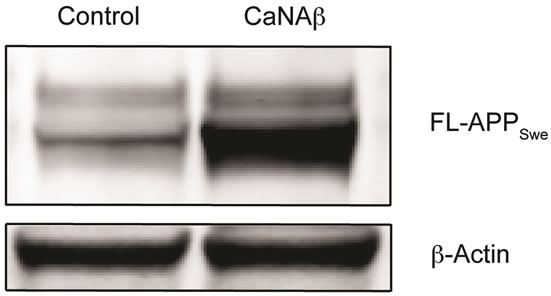 (c)
(c)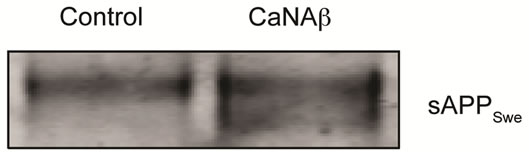 (d)
(d)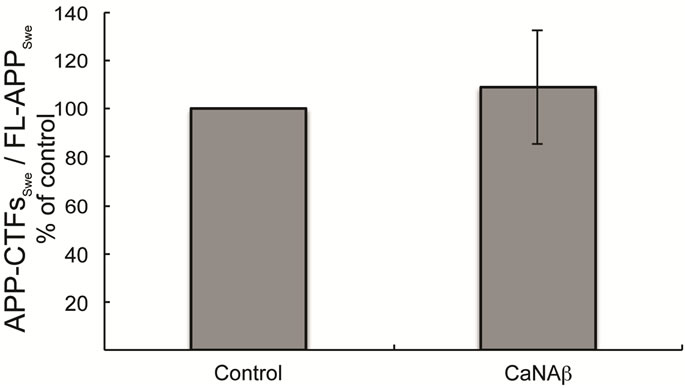 (e)
(e)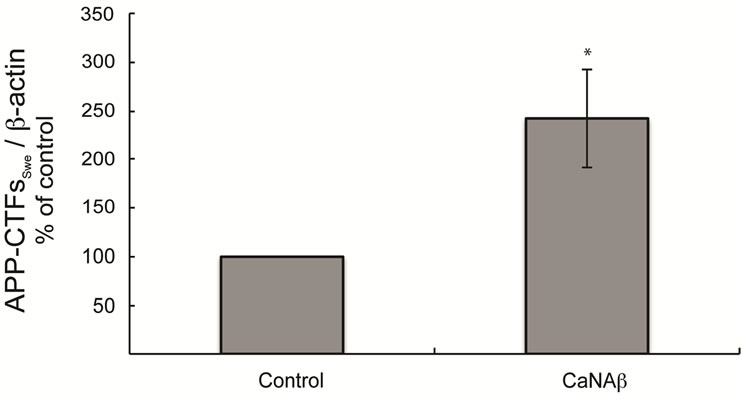 (f)
(f)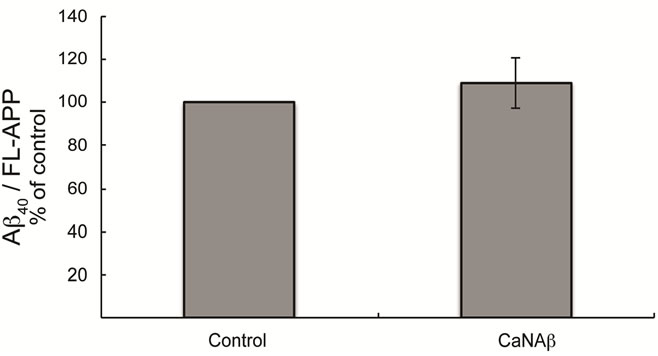 (g)
(g)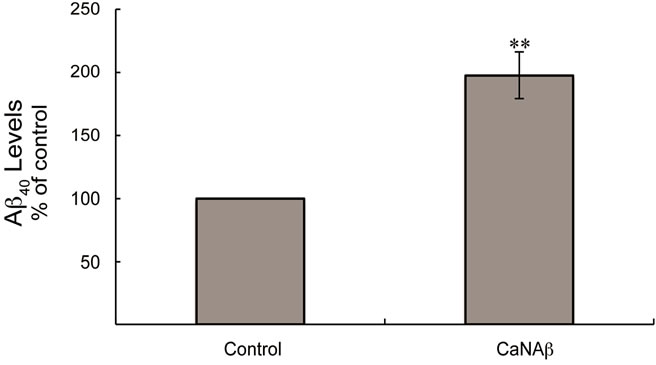 (h)
(h)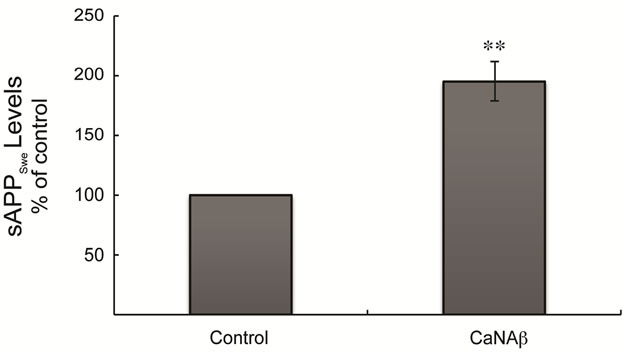 (i)
(i)
Figure 2. CaNAβ co-overexpression with APPSwe alters levels of APP and APP proteolytic products. CaNAβ and APPSwe were co-overexpressed in HEK293 cells. An empty vector was also co-overexpressed with APPSwe plasmid as the control for the experiment. (a) A representative Western blot showing an increase in levels of FL-APPSwe upon CaNAβ overexpression; (b) Quantification of the above data demonstrates that the increase in FL-APPSwe levels is significant. β-Actin was used as the loading control; (c) An increase in levels of APPSwe-CTF’s was also observed with CaNAβ overexpression; (d) Quantification of the above data shows that the increase in APPSwe-CTF’s is significant; (e) APPSwe-CTF levels were normalized to FL-APPSwe levels and no significant difference is observed; (f) Conditioned media from co-transfected cells was used to assess sAPP total levels; (g) Quantification of the sAPP total Western blot data shows a significant increase in levels of sAPP total with CaNAβ overexpression; (h) CaNAβ overexpression led to a significant increase in levels of Aβ40 as assessed by ELISA assay; (i) Aβ40 levels were normalized to levels of FL-APP and no significant difference is observed. Values are means ± standard errors of 3 independent experiments. “*”: p < 0.05, “**”: p < 0.01, “***”:p < 0.001 and “n.s.”: p-values > 0.05 (Student’s t-test).
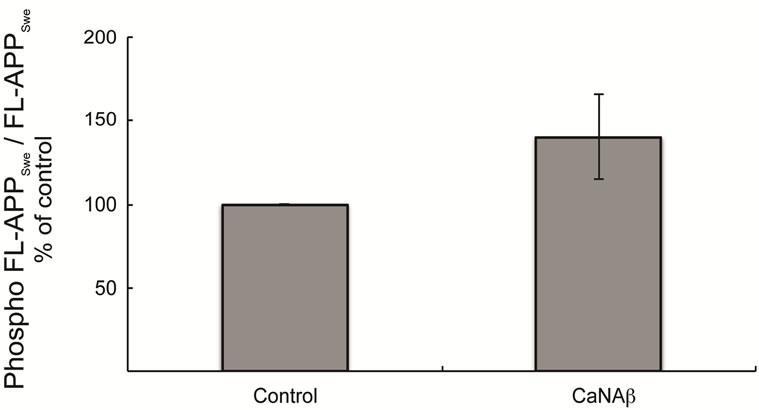
pho-Thr668 APPSwe-CTF levels was also observed upon co-overexpression (Figures 3(d) & (e)). In order to determine the proportion of FL-APPSwe that was phosphorylated on CaNAβ co-overexpression, we normalized levels of phospho-Thr668 FL-APPSwe to total FL-APPSwe and observed no significant change (Figure 3(c)). However, when phospho-Thr668 APPSwe-CTF’s were normalized to total APPSwe-CTFs, a significant increase in the proportion of phospho-Thr668 APPSwe-CTFs was observed (Figure 3(f)).
3.3. CaNAβ Overexpression Does Not Alter APP mRNA Levels
Since we observe an increase in levels of endogenous and exogenous FL-APP upon CaNAβ overexpression it is unlikely that CaNAβ is altering APP expression via a transcriptional mechanism. It is possible that the mRNA stability could be affected. To assess both of these possibilities we utilized RT-QPCR to determine if CaNAβ overexpression resulted in altered APP mRNA levels. As expected, overexpression of CaNAβ in HEK293 cells had no significant effect on endogenous APP mRNA levels suggesting that CaNAβ alters APP levels posttranscriptionally (Figure 4).
4. DISCUSSION
In our study, we demonstrate that CaNAβ overexpression can regulate APP metabolism. We have undertaken a systematic search for regulators of APP metabolism utilizing an APP-Gal4/Gal4-UAS luciferase reporter system [24-25]. Using this approach we identified CaNAβ as a positional candidate gene that could function in regulating APP metabolism. Specifically, we observed that CaNAβ knockdown in SH-SY5Y APP-Gal4 cells that stably carry this reporter system, leads to a significant decrease in AICD-Gal4 mediated luciferase activity when compared to the non-silencing shRNA control. CaNAβ, when overexpressed in the same cell line, led to a significant increase in AICD-Gal4 mediated luciferase activity compared to the appropriate empty vector (Utreja et al, submitted). Knockdown and overexpression of the CaNAβ subunit resulted in consistent and opposite effects on APP proteolysis as measured by this assay, suggesting that CaNAβ plays a reproducible role in APP metabolism regulation in this cellular model. Here, we have extended these initial studies by investigating whether CaNAβ expression alters other aspects of APP proteolysis.
Overexpression of CaNAβ in HEK293 cells lead to a
 (a)
(a)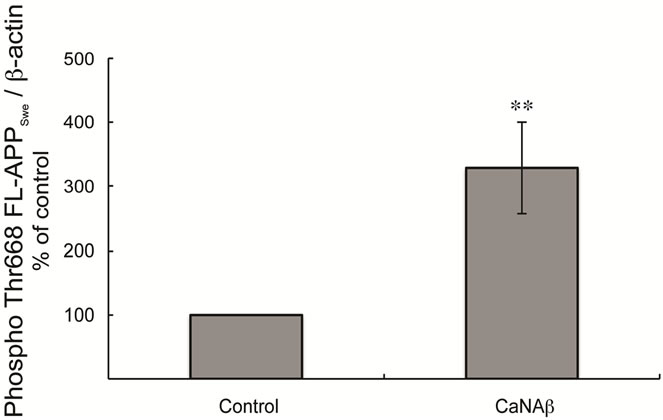 (b)
(b)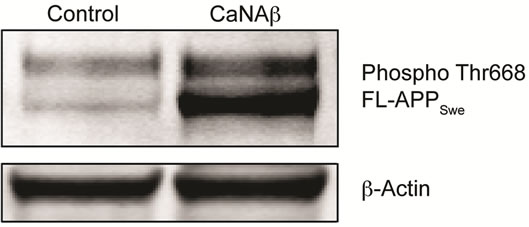 (c)
(c)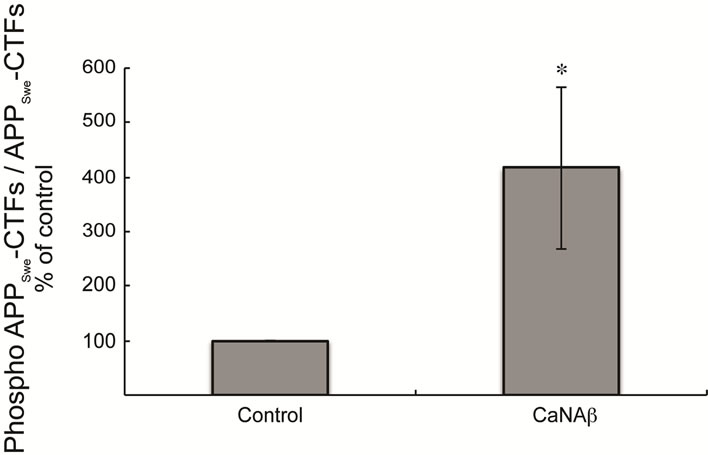 (d)
(d)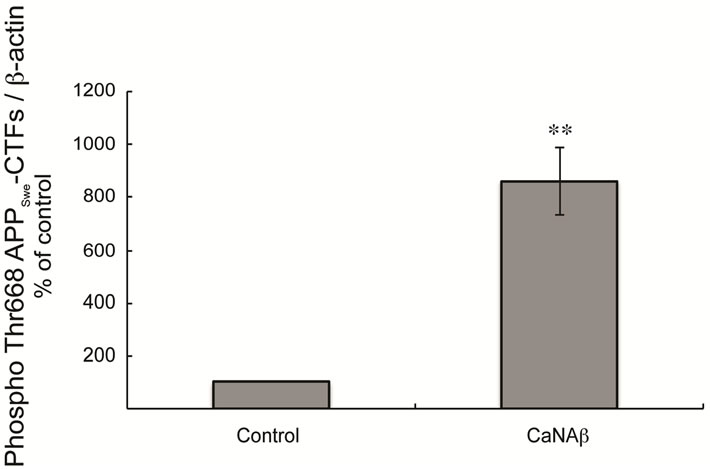 (e)
(e)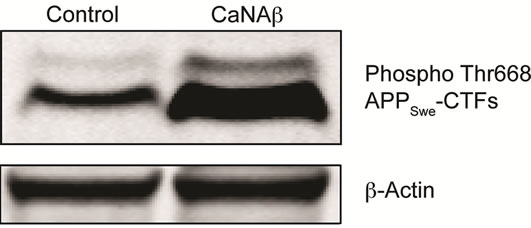 (f)
(f)
Figure 3. CaNAβ co-overexpression with APPSwe leads to increase in Thr668 Phosphorylation (a) Representative western blot from the HEK293 cell lysates co-overexpressing CaNAβ and APPSwe; (b) Quantification of the above experiment shows an increase in levels of phospho-Thr668 FL-APPSwe; (c) When phospho-Thr668 FL-APPSwe levels were normalized to total FL-APPSwe levels, no significant difference is observed showing that this increase is proportional to the levels of FL-APPSwe; (d) Western blot showing an increase in levels of phospho-Thr668 APPSwe-CTF’s on CaNAβ overexpression; (e) Quantification of the above experiment reveals that the increase is significant; (f) Normalization of phospho-Thr668 APPSwe-CTF levels to total APPSwe-CTF’s shows a significant increase in the proportion APPSwe-CTF that are phosphorylated at Thr668. 14 Values are means ± standard errors of 3 independent experiments. “*”: p < 0.05, “**”: p < 0.01 and “n.s.”: p-values > 0.05 (Student’s t-test).
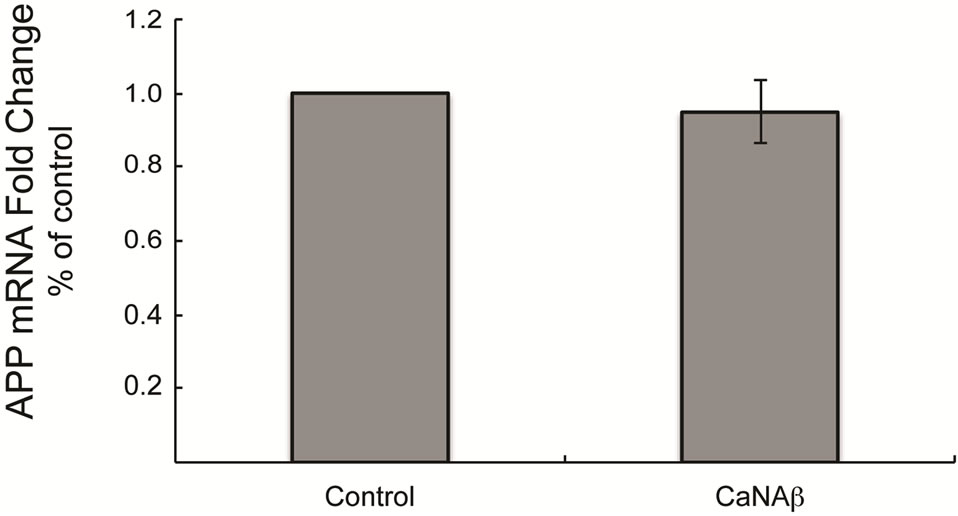
Figure 4. CaNAβ overexpression does not alter APP mRNA levels No differences in fold change of endogenous APP mRNA is observed upon CaNAβ overexpression in HEK 293 cells, suggesting that CaNAβ overexpression does not regulate APP transcription.
significant increase in levels of FL-APP, and APP-CTF’s (CTF-83 and CTF-99), sAPP total and Aβ40 levels. This increase in FL-APP and APP-CTF’s was observed with endogenous levels of APP and overexpressed APPSwe. The increase in APP levels observed are most likely due to post-transcriptional effects as no change in APP mRNA levels was observed upon CaNAβ overexpression. Given CaN’s role as a serine/threonine specific phosphatase, we also examined affect of CaNAβ expression on APP phosphorylation state. FL-APP and APP-CTF, which increased upon CaNAβ overexpression, were found to be phosphorylated at Thr668 residue. When phosphoThr668 FL-APP and phospho-Thr668 APP-CTF’s levels were normalized to total FL-APP and APP-CTF levels, respectively, no increase was observed in overall phosphorylation of FL-APP but a significant increase inphospho-Thr668 APP-CTF’s was observed. Taken together, we conclude that increased expression of CaNAβ can alter APP metabolism and lead to increased production of Aβ, one of the main causes of Alzheimer’s disease. Therefore, down regulating levels of CaNAβ could be used as a potential therapeutic for decreasing Aβ levels.
CaN is an interesting and an important target in AD because of its critical role in learning and memory [11]. CaN being a serine/threonine specific phosphatase mediates the dephosphorylation of several cellular proteins and is involved in different signaling pathways. CaN mediated dephosphorylation of pCREB [25], pNFAT [26], p-PP1 [27,28], p-GSK-3 [29], and pBAD [30,31] could putatively explain its individual role in synaptic protein loss, neuroinflammation (neuronal and astrocytic), decreased neurotransmission, hyperphosphorylated tau, and cell death observed in AD models. However, the role of CaN in the brain may be very complicated. Overexpression of CaN in mice results in altered synaptic function and deficits in memory retention [32, 33]. Knockdown of CaN activity facilitates PKA-dependent long-term potentiation and increased learning and memory [33]. Yet, completely knocking out calcineurin in Purkinje cells or in the anterior cortex impairs postsynaptic long-term potentiation and worsens cognition [34]. In aged rats, upregulation of CaN activity negatively correlates with cognitive performance [27]. Conversely, downregulation of CaN activity using autoinhibitory peptide has shown to improve memory in rodents [33]. Transgenic Tg2576 mice (AD mouse model), which accumulate Aβ and develop cognitive impairments prior to plaque deposition, have high CaN activity in central nervous system (CNS). Treatment of these mice with CaN inhibitor FK506 improves memory function, indicating that CaN is part of the Aβ mediated memory loss pathway [35]. It has been shown that exogenous application of synthetic amyloid-β or oligomeric aggregates to cultured cells leads to a rapid and sustained rise in Ca2+ levels along with increase in CaN activity [8]. Furthermore, in vitro evidence indicates that Aβ induces neuronal apoptosis through a CaN-dependent mechanism [36]. Taken together, these studies suggest that CaN is the major phosphatase involved in cognitive and neurodegenerative effects of Aβ. However, the ability of CaN to alter Aβ levels has not been investigated thoroughly.
Previously, cDNA microarray analysis has shown that CaNAβ is the most up-regulated gene in brain lesions of the early stage of AD [20]. RT-PCR analysis from the same study also confirmed that CaNAβ was generally upregulated in the hippocampus of the early stage of AD [20]. The exact mechanism for upregulation of CaNAβ in the AD brain remains unknown. In our study we report that overexpression of CaNAβ increases levels of FLAPP and its proteolytic products including Aβ. Hence, this increase in levels of CaNAβ observed in AD brains could account for the increase in Aβ levels and Aβ mediated neurodegenerative affects. Our results indicate that this increase in APP levels observed with CaNAβ overexpression is post-transcriptional. Possibly, CaNAβ could alter APP protein synthesis or protein degradation affecting the levels of APP and APP proteolytic products. Also, an increase in APP-CTF’s Thr668 phosphorylation was observed upon CaNAβ overexpression. CaN being a phosphatase, it’s intriguing to observe an increase in APPCTF phosphorylation on CaNAβ overexpression. This could suggest that either CaNAβ overexpression does not account for or lead to a change in the overall phosphatase activity of CaN, or CaNAβ has an indirect effect on APP-CTF phosphorylation. There has been evidence suggesting that overexpression of CaN leads to dephosphorylation of GSK-3β at Ser-9, increasing its activity and leading to an increase in Tau phosphorylation [29]. Therefore it is possible that CaNAβ could affect GSK-3β phosphorylation/activity leading to an increase in levels of APP-CTF phosphorylation at Thr668. Lastly, activity and levels of CaN in AD brains/AD models are differentially regulated. Specifically, CaN activity is globally reduced in AD brains and during aging [37,38]. Conversely, protein levels of CaN are inversely correlated with dementia severity [38]. Therefore it will be important to determine if increased levels of CaNAβ leads to altered CaN activity.
To our knowledge our study is the first to show that CaNAβ overexpression regulates APP levels and proteolysis leading to an increase in Aβ levels. Results presented in our study provide an important link between clinically observed increase in CaNAβ levels in AD brains and the experimentally observed increase in Aβ levels. The results suggest the presence of potentially pathogenic feed forward loop between CaN and Aβ.
5. ACKNOWLEDGEMENTS
The authors would like to thank the members of the Saunders laboratory for helpful discussions. This work was support by grants from the National Institute of Neurologic Disease and Stroke (NS057295 to AJS).
REFERENCES
- Tanzi, R.E. and Bertram, L. (2005) Twenty years of the Alzheimer’s disease amyloid hypothesis: A genetic perspective. Cell, 120, 545-555. doi:10.1016/j.cell.2005.02.008
- Selkoe, D.J. (2003) Aging, amyloid, and Alzheimer’s disease: A perspective in honor of CarlCotman. Neurochemical Research, 28, 1705-1713. doi:10.1023/A:1026065122854
- Shoji, M., et al. (1992) Production of the Alzheimer amyloid beta protein by normalproteolytic processing. Science, 258, 126-129. doi:10.1126/science.1439760
- De Strooper, B. and Annaert, W. (2000) Proteolytic processing and cell biological functions of theamyloid precursor protein. Journal of Cell Science, 113, 1857-1870.
- Kuchibhotla, K.V. et al. (2008) Abeta plaques lead to aberrant regulation of calcium homeostasis in vivo resulting in structural and functional disruption of neuronal networks. Neuron, 59, 214-225. doi:10.1016/j.neuron.2008.06.008
- Wu, H.Y., et al. (2010) Amyloid beta induces the morphological neurodegenerative triad of spine loss, dendritic simplification, and neuritic dystrophies through calcineurin activation. The Journal of Neuroscience, 30, 2636- 2649. doi:10.1523/JNEUROSCI.4456-09.2010
- Loo, D.T., et al. (1993) Apoptosis is induced by betaamyloid in cultured central nervous system neurons. Proceedings of the National Academy of Sciences of the United States of America, 90, 7951-7955. doi:10.1073/pnas.90.17.7951
- Reese, L.C., Zhang, W., Dineley, K.T., Kayed, R. and Taglialatela, G. (2008) Selective induction of calcineurin activity and signaling by oligomeric amyloid beta. Aging Cell, 7, 824-835. doi:10.1111/j.1474-9726.2008.00434.x
- Agostinho, P., Lopes, J.P., Velez, Z. and Oliveira, C.R., (2008) Overactivation of calcineurin induced by amyloid-beta and prion proteins. Neurochemistry International, 52, 1226-1233. doi:10.1016/j.neuint.2008.01.005
- Abdul, H.M., et al. (2009) Cognitive decline in Alzheimer’s disease is associated with selective changes in calcineurin/NFAT signaling. The Journal of Neuroscience, 29, 12957-12969. doi:10.1523/JNEUROSCI.1064-09.2009
- Rusnak, F. and Mertz, P. (2000) Calcineurin: Form and function. Physiological Reviews, 80, 1483-1521
- Klee, C.B., Crouch, T.H. and Krinks, M.H. (1979) Calcineurin: A calciumand calmodulin-binding protein of the nervous system. Proceedings of the National Academy of Sciences of the United States of America, 76, 6270-6273. doi:10.1073/pnas.76.12.6270
- Klee, C.B., Ren, H. and Wang, X. (1998) Regulation of the calmodulin-stimulated protein phosphatase, calcineurin. The Journal of Biological Chemistry, 273, 13367-13370. doi:10.1074/jbc.273.22.13367
- Perrino, B.A., Ng, L.Y. and Soderling, T. R. (1995) Calcium regulation of calcineurin phosphatase activity by its B subunit and calmodulin. Role of the autoinhibitory domain. The Journal of Biological Chemistry, 270, 7012.
- Wu, H.Y., et al. (2004) Critical role of calpain-mediated cleavage of calcineurin inexcitotoxic neurodegeneration. The Journal of Biological Chemistry, 279, 4929-4940. doi:10.1074/jbc.M309767200
- Mohmmad Abdul, H., Baig, I., Levine H., Guttmann, R.P. and Norris, C.M. (2011) Proteolysis of calcineurin is increased in human hippocampus during mild cognitive impairment and is stimulated by oligomeric Abeta in primary cell culture. Aging Cell, 10, 103-113. doi:10.1111/j.1474-9726.2010.00645.x
- Shibasaki, F., Hallin, U. and Uchino, H. (2002) Calcineurin as a multifunctional regulator. The Journal of Biochemistry, 131, 1-15. doi:10.1093/oxfordjournals.jbchem.a003063
- Klee, C.B., Draetta, G.F. and Hubbard, M.J. (1988) Calcineurin. Advances in Enzymology and Related Areas of Molecular Biology, 61, 149-200.
- Yakel, J.L. (1997) Calcineurin regulation of synaptic function: From ion channels to transmitter release and gene transcription. Trends in Pharmacological Sciences, 18, 124-134. doi:10.1016/S0165-6147(97)01046-8
- Hata, R., et al. (2001) Up-regulation of calcineurin Abeta mRNA in the Alzheimer’s disease brain: Assessment by cDNA microarray. Biochemical and Biophysical Research Communications, 284, 310-316. doi:10.1006/bbrc.2001.4968
- Taguchi, K., et al. (2005) Identification of hippocampus-related candidate genes for Alzheimer’s disease. Annals of Neurology, 57, 585-588. doi:10.1002/ana.20433
- Wei, Q., Holzer, M., Brueckner, M. K., Liu, Y. and Arendt, T. (2005) Dephosphorylation of tau protein by calcineurin triturated into neural living cells. Cellular and Molecular Neurobiology, 22, 13-24.
- Zhang, C., et al. (2007) An AICD-based functional screen to identify APP metabolism regulators. Molecular Neurodegeneration, 2, 15. doi:10.1186/1750-1326-2-15
- Zuchner, S., et al. (2008) Linkage and association study of late-ons et al zheimer disease families linked to 9p21.3. Annals of Human Genetics, 72, 725-731. doi:10.1111/j.1469-1809.2008.00474.x
- Bito, H., Deisseroth, K. and Tsien, R.W. (1996) CREB phosphorylation and dephosphorylation: A Ca(2+)- and stimulus duration-dependent switch for hippocampal gene expression. Cell, 87, 1203-1214. doi:10.1016/S0092-8674(00)81816-4
- Abdul, H.M., et al. (2009) Cognitive decline in Alzheimer’s disease is associated with selective changes in calcineurin/NFAT signaling. The Journal of Neuroscience, 29, 12957-12969. doi:10.1523/JNEUROSCI.1064-09.2009
- Foster, T.C., Sharrow, K.M., Masse, J.R., Norris, C.M. and Kumar, A. (2001) Calcineurin links Ca2+ dysregulation with brain aging. The Journal of Neuroscience, 21, 4066-4073.
- Mulkey, R.M., Endo, S., Shenolikar, S. and Malenka, R.C. (1994) Involvement of acalcineurin/inhibitor-1 phosphatase cascade in hippocampal long-term depression. Nature, 369, 486-488. doi:10.1038/369486a0
- Kim, Y., et al. (2009) Calcineurin dephosphorylates glycogen synthase kinase-3 beta atserine-9 in neuroblast-derived cells. Journal of Neurochemistry, 111, 344-354. doi:10.1111/j.1471-4159.2009.06318.x
- Wang, H.G., et al. (1999) Ca2+-induced apoptosis through calcineurin dephosphorylation of BAD. Science, 284, 339- 343. doi:10.1126/science.284.5412.339
- Asai, A., et al. (1999) High level calcineurin activity predisposes neuronal cells to apoptosis. The Journal of Biological Chemistry, 274, 34450-34458. doi:10.1074/jbc.274.48.34450
- Kayyali, U.S., Zhang, W., Yee, A.G., Seidman, J.G. and Potter, H. (1999) Cytoskeletal changes in the brains of mice lacking calcineurin A alpha. Journal of Neurochemistry, 68, 1668-1678 (1997). doi:10.1046/j.1471-4159.1997.68041668.x
- Malleret, G., et al. (2001) Inducible and reversible enhancement of learning, memory, andlong-term potentialtion by genetic inhibition of calcineurin. Cell, 104, 675- 686.
- Zeng, H., et al. (2001) Forebrain-specific calcineurin knockout selectively impairs bidirectional synaptic plasticity and working/episodic-like memory. Cell, 107, 617- 629. doi:10.1016/S0092-8674(01)00585-2
- Dineley, K.T., Hogan, D., Zhang, W.R. and Taglialatela, G. (2007) Acute inhibition of calcineurin restores associative learning and memory in Tg2576 APP transgenic mice. Neurobiology of Learning and Memory, 88, 217-224. doi:10.1016/j.nlm.2007.03.010
- Agostinho, P. and Oliveira, C.R. (2003) Involvement of calcineurin in the neurotoxic effects induced by amyloid-beta and prion peptides. European Journal of Neuroscience, 17, 1189-1196. doi:10.1046/j.1460-9568.2003.02546.x
- Ladner, C.J., Czech, J., Maurice, J., Lorens, S.A. and Lee, J.M. (1996) Reduction of calcineurin enzymatic activity in Alzheimer’s disease: Correlation with neuropathologic changes. Journal of Neuropathology & Experimental Neurology, 55, 924-931.
- Karch, C.M., Jeng, A.T. and Goate, A.M. (2013) Calcium phosphatase calcineurin influences tau metabolism. Neurobiology of Aging, 34, 374-386. doi:10.1016/j.neurobiolaging.2012.05.003