American Journal of Climate Change
Vol.2 No.4(2013), Article ID:40679,5 pages DOI:10.4236/ajcc.2013.24026
Lightning Enhancement in the Amazon Region Due to Urban Activity
1Atmospheric Electricity Group, Earth System Science Center, National Institute of Space Research, S. J. Campos, Brazil
2Camilo Castelo Branco University (Unicastelo), S. J. Campos, Brazil
Email: osmar.pinto@inpe.br, iara.pinto@inpe.br, osmarpintoneto@hotmail.com
Copyright © 2013 Osmar Pinto Jr. et al. This is an open access article distributed under the Creative Commons Attribution License, which permits unrestricted use, distribution, and reproduction in any medium, provided the original work is properly cited.
Received June 23, 2013; revised July 27, 2013; accepted August 29, 2013
Keywords: Lightning; Urban Effects; Amazon Region
ABSTRACT
Urbanization has an increasing contribution to anthropogenic climate forcing. The impact arises mainly from the Urban Heat Island (UHI) effect and aerosol anthropogenic emissions. An important but not completely understood consequence of this forcing is its effect on local lightning activity. Changes in lightning activity may result in a feedback on the climate system. In this article, it investigates changes in the lightning activity in the city of Manaus, located in the Amazon region of Brazil. It is found that, over the city, the lightning activity is larger than that in the regions around it and it has been increasing in the last four decades simultaneously with the increasing of its urban area. Our results suggest that such changes are caused by the UHI effect. The observations reported here are unique and relevant because Manaus is located in the central part of the Amazon rainforest and inside one of the three global lightning chimneys in the world.
1. Introduction
Lightning future scenario is one of the most important open questions of the Earth’s climate science. In the present time, our ability to predict future climate changes in the global lightning activity is very limited because it depends on a better understanding of the climate system, including the impact of the anthropogenic activity on lightning, and the influence of external factors such as solar activity on lightning.
Another aspect that contributes to our inability to predict future changes on global lightning is the lack of long time series of direct lightning observations in the tropics, where most lightning occurs [1]. The longest time series of lightning data available in the tropics is that observed by the Lightning Imaging Sensor (LIS), an optical sensor on board the Tropical Rainfall Measuring Mission (TRMM) satellite since 1997. The time series does not show any significant positive trend; however, the lack of positive trend may be attributed to the small (less than 0.2˚C) change in the surface air temperature in the tropics since 1997.
In addition, the limited spatial resolution of the present Global Climate Models (GCMs), which are not able to resolve thunderstorm electrification and evolution in details [2], makes the simulation of convection heavily parameterized and introduces large uncertainties in the GCM lightning projections. Depending on the convection parameterization adopted, it is possible to obtain GCM projections indicating an increase or, even, a decrease in the global lightning activity [3]. This limitation may explain at least partially why there is no mention to future lightning scenarios in the last Intergovernmental Panel on Climate Change (IPCC) report in 2007.
From a theoretical point of view, the non-linear relation of water vapor content with air surface temperature expressed by the so-called Clausius-Clapeyron relationship suggests an increase in the vapor pressure with increasing temperature [4]. In consequence, in a warmer future scenario there will be more water vapor in the atmosphere to release latent heat during condensation and freezing, a vital process to thunderstorm development and lightning. As a result, more lightning would be expected. However, future lightning activity will also depend on the vertical air temperature profile in the troposphere, which defines how the Convective Potential Available Energy (CAPE) will change. There is no consensus on how the CAPE will response to warming scenarios. Some GCM predictions suggest an increasing CAPE [5,6]while others do not show any positive trend in CAPE7. Differently, CAPE observations show a positive trend in the 1970-1990 period, with no trends in the last two decades [7,8].
While the surface air temperature change observed in the tropics in the last decades is small, large temperature changes (greater than 1˚C) have been observed during this period over urban areas of large tropical cities. The rise of temperature in urban areas, called the Urban Heat Island (UHI) effect [9,10], is believed to be caused by many physical differences between urban and rural areas, among them absorption of sunlight, increased heat storage of artificial surfaces, obstruction of re-radiation by buildings, absence of plant transpiration, and differences in air circulation [11,12]. The UHI magnitude, defined as the difference between urban and rural temperatures, is influenced by synoptic weather conditions, urban morphology, timing of temperature observations, and categorization of “rural” areas adjacent to the city [13,14]. A comprehensive review about UHI effect can be found elsewhere [15].
Urban areas may play a key role in the climate change, in some cases producing an impact as large as the impact of doubling CO2 [16]. The effects of urbanization will likely increase because the world’s population living in urban regions is expected to go up to more than 60 percent by 2030 [17].
The goal of this article is to present and discuss the lightning observations in the city of Manaus, State of Amazonas, Brazil, as observed by the World Wide Lightning Location Network (WWLLN) and the Lightning Imaging Sensor (LIS) in the last decade in the context of the impact of the UHI effect on the lightning activity. For this purpose, data showing the evolution of the urban area of the city in the last four decades and information about the apparent surface temperature obtained from satellite are presented. The lightning data are complemented by thunderstorm day observations in the last four decades.
2. Manaus Urban Area
Manaus is centered on the geographic coordinates 3˚8'S and 60˚1'W and has an average elevation of 21 m above mean sea level. The city is located in the central part of the largest tropical forest in the world, the Amazon rainforest, and has a population of approximately 2 million inhabitants. In the last three decades the surface air temperature in Manaus increased by 0.7˚C while in the tropics it increased by approximately 0.4˚C. In addition, the maximum daily temperature in the urban area of Manaus is 3˚C higher than the temperature in the forest around the city [18].
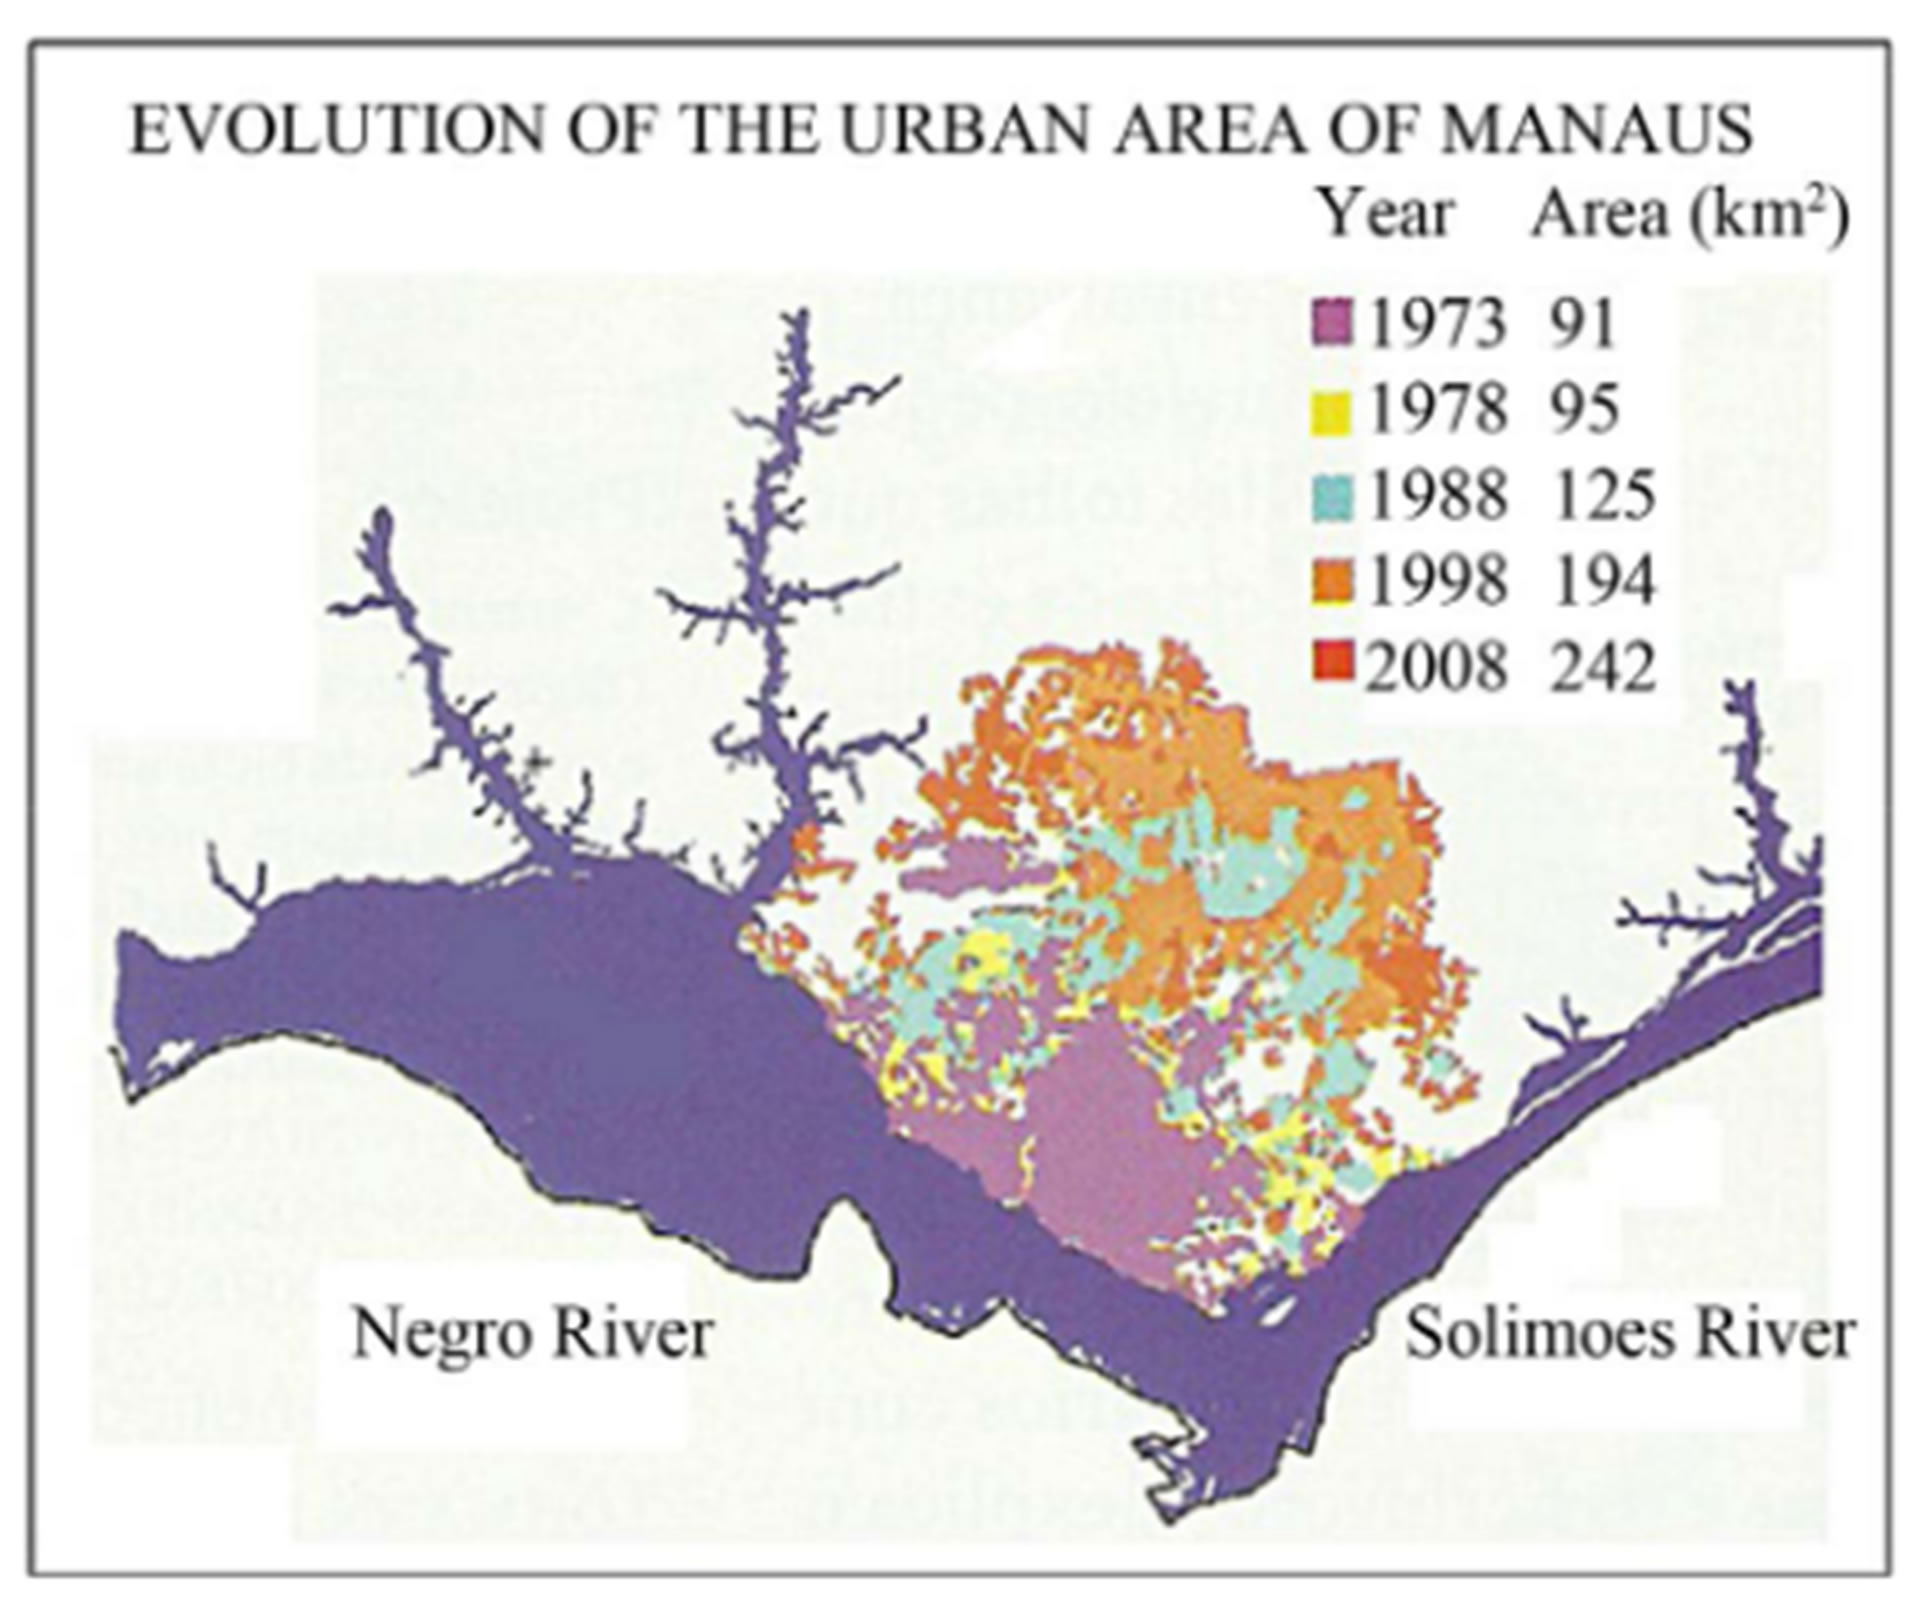
Figure 1(a) shows the time evolution of the urban area of the city of Manaus since 1973, indicating that the urban area of Manaus increased from 91 km2 in 1973 to 242 km2 in 2008. In the same period the population increased from 400,000 to 170,000 inhabitants. Figure 1(b) shows a map of the apparent mean surface temperature anomaly in the region of the city of Manaus in ˚C and corresponds to observations in the period from August to September, 2009, obtained from the AQUA satellite observations with a 1 km resolution [19]. In Figure 1(b) it is indicated the contours of the Negro and Solimoes rivers and the urban area of Manaus in 2009. The comparison of Figures 1(b) with (a) suggests that the increase in the apparent mean surface temperature in the urban area of Manaus is related to the UHI effect.
 (a)
(a)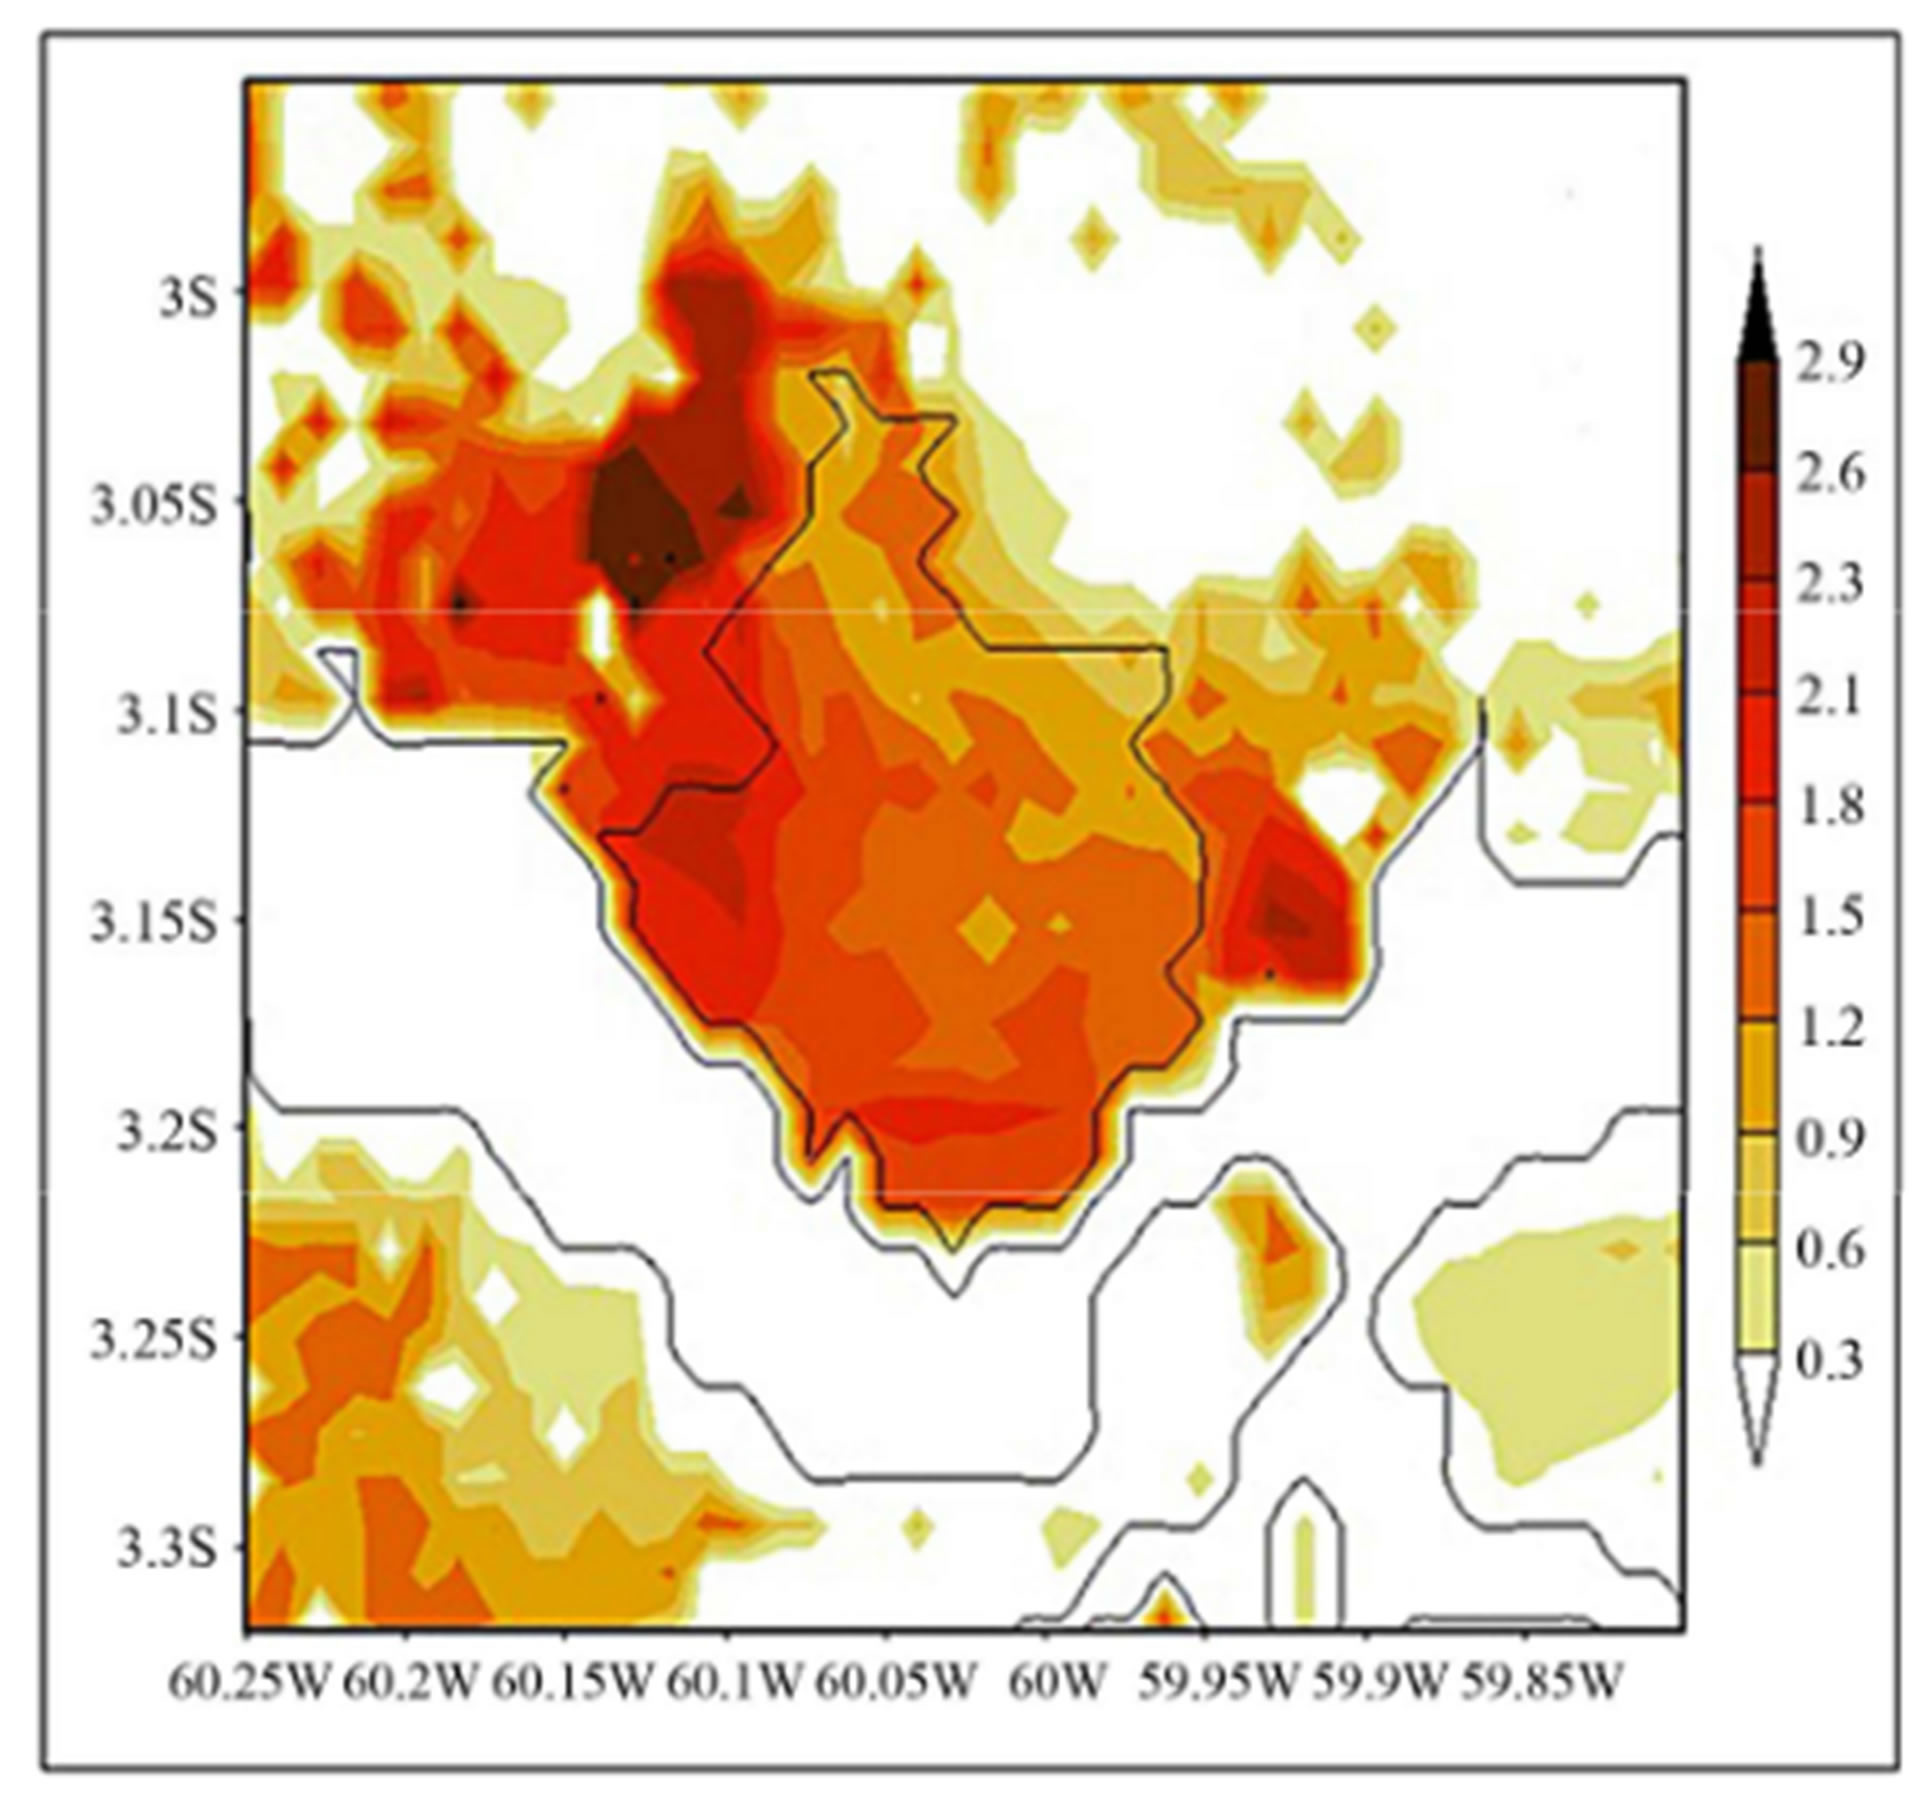 (b)
(b)
Figure 1. (a) The time evolution of the urban area of the city of Manaus since 1973; (b) map of the apparent mean surface temperature anomaly (in ˚C) in the region of the city of Manaus for the period of August and September, 2009. The contours of the Negro and Solimoes rivers and the urban area of Manaus in 2009 are also indicated.
3. Lightning Data
Lightning data in the Amazon region were obtained from the World-Wide Lightning Location Network (WWLLN) and the Lightning Imaging Sensor (LIS). WWLLN is a ground-based network consisting of 62 sensors, which monitors very low frequency (VLF) radio waves from lightning. The network uses a time of group arrival technique on the detected sferic waveforms to locate lightning to within ~5 km and <10 μs, with preferential detection of high peak current cloud to ground strokes. The global detection efficiency of the network is estimated to be ~10% and it is sufficient to enable the network to detect almost all lightning-producing storms [20].
LIS is an optical sensor on board the Tropical Rainfall Measuring Mission (TRMM) satellite that was launched in 1997 into a 35˚ inclination orbit [21]. Lightning climatology was based on 10 years of WWLLN data from 2004 to 2013 and 17 years of 0.1˚ spatial resolution LIS data from 1997 to 2013.
4. Observations in the Amazon Region
Evidences for UHI effects on lightning activity have been studied by many authors [22-28]. However, no previous study about UHI effect on lighting activity has been done for a city inside a tropical rainforest and far away from the mountains and the ocean. Here we present and discuss lightning observations in the city of Manaus, State of Amazonas, Brazil, as observed by the World Wide Lightning Location Network (WWLLN) and the Lightning Imaging Sensor (LIS) in the last decade.
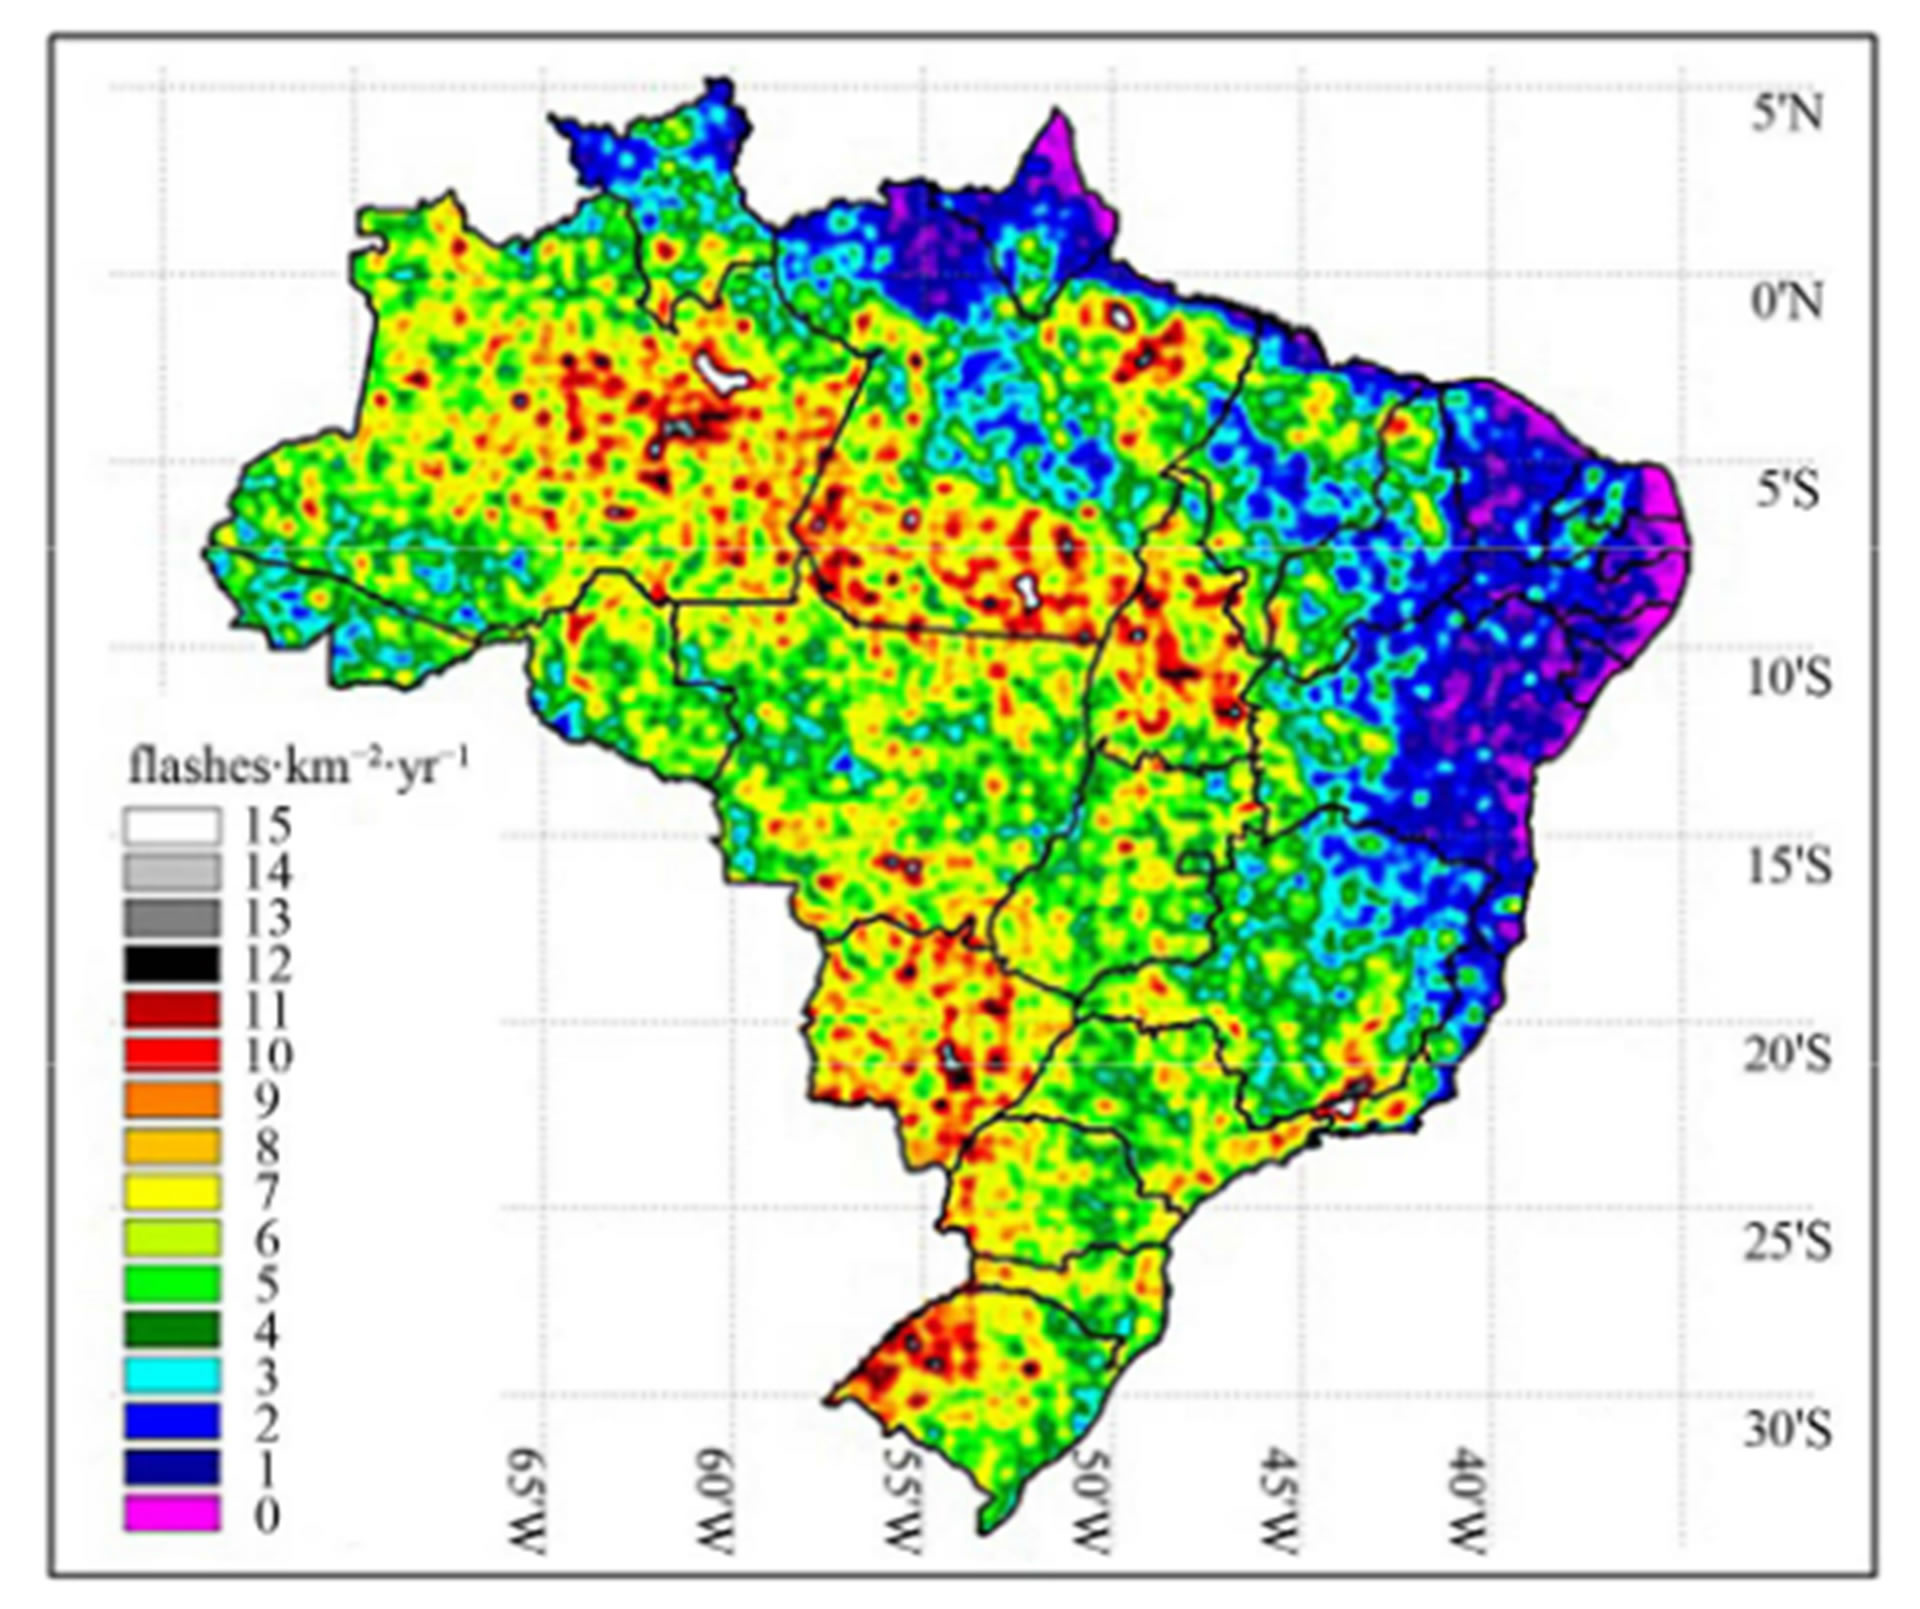
Figure 2(a) shows the total lightning density in flashes∙km−2∙year−1 observed by LIS sensor in Brazil in the period from 1999 to 2013 with a spatial resolution of 0.1˚ (~11 km). The approximate location of Manaus is indicated by a black circle. A large flash density (~15 flashes∙km−2∙year−1) is observed in the region of Manaus. Figure 2(b) shows the lightning activity in terms of the number of strokes observed by the WWLLN (the network does not group strokes in flashes like LIS) in the region around Manaus with a spatial resolution of 1 km. Figure 2(b) corresponds to observations in the period from 2004 to 2013. Both observations show an increase in the lightning activity in the area of Manaus. The comparison of Figures 2(b) with 1(b), in spite they correspond to different time periods, shows a close relationship between stroke density and apparent mean surface temperature anomaly, suggesting that the enhancement in the lightning activity observed in the urban area of Manaus is caused by the UHI effect.
It is also observed in Figure 2(b) that the maximum stroke density is slightly shifted to northwest with respect to the urban area what it is probably caused by trade winds, which are the prevailing easterly surface winds
 (a)
(a)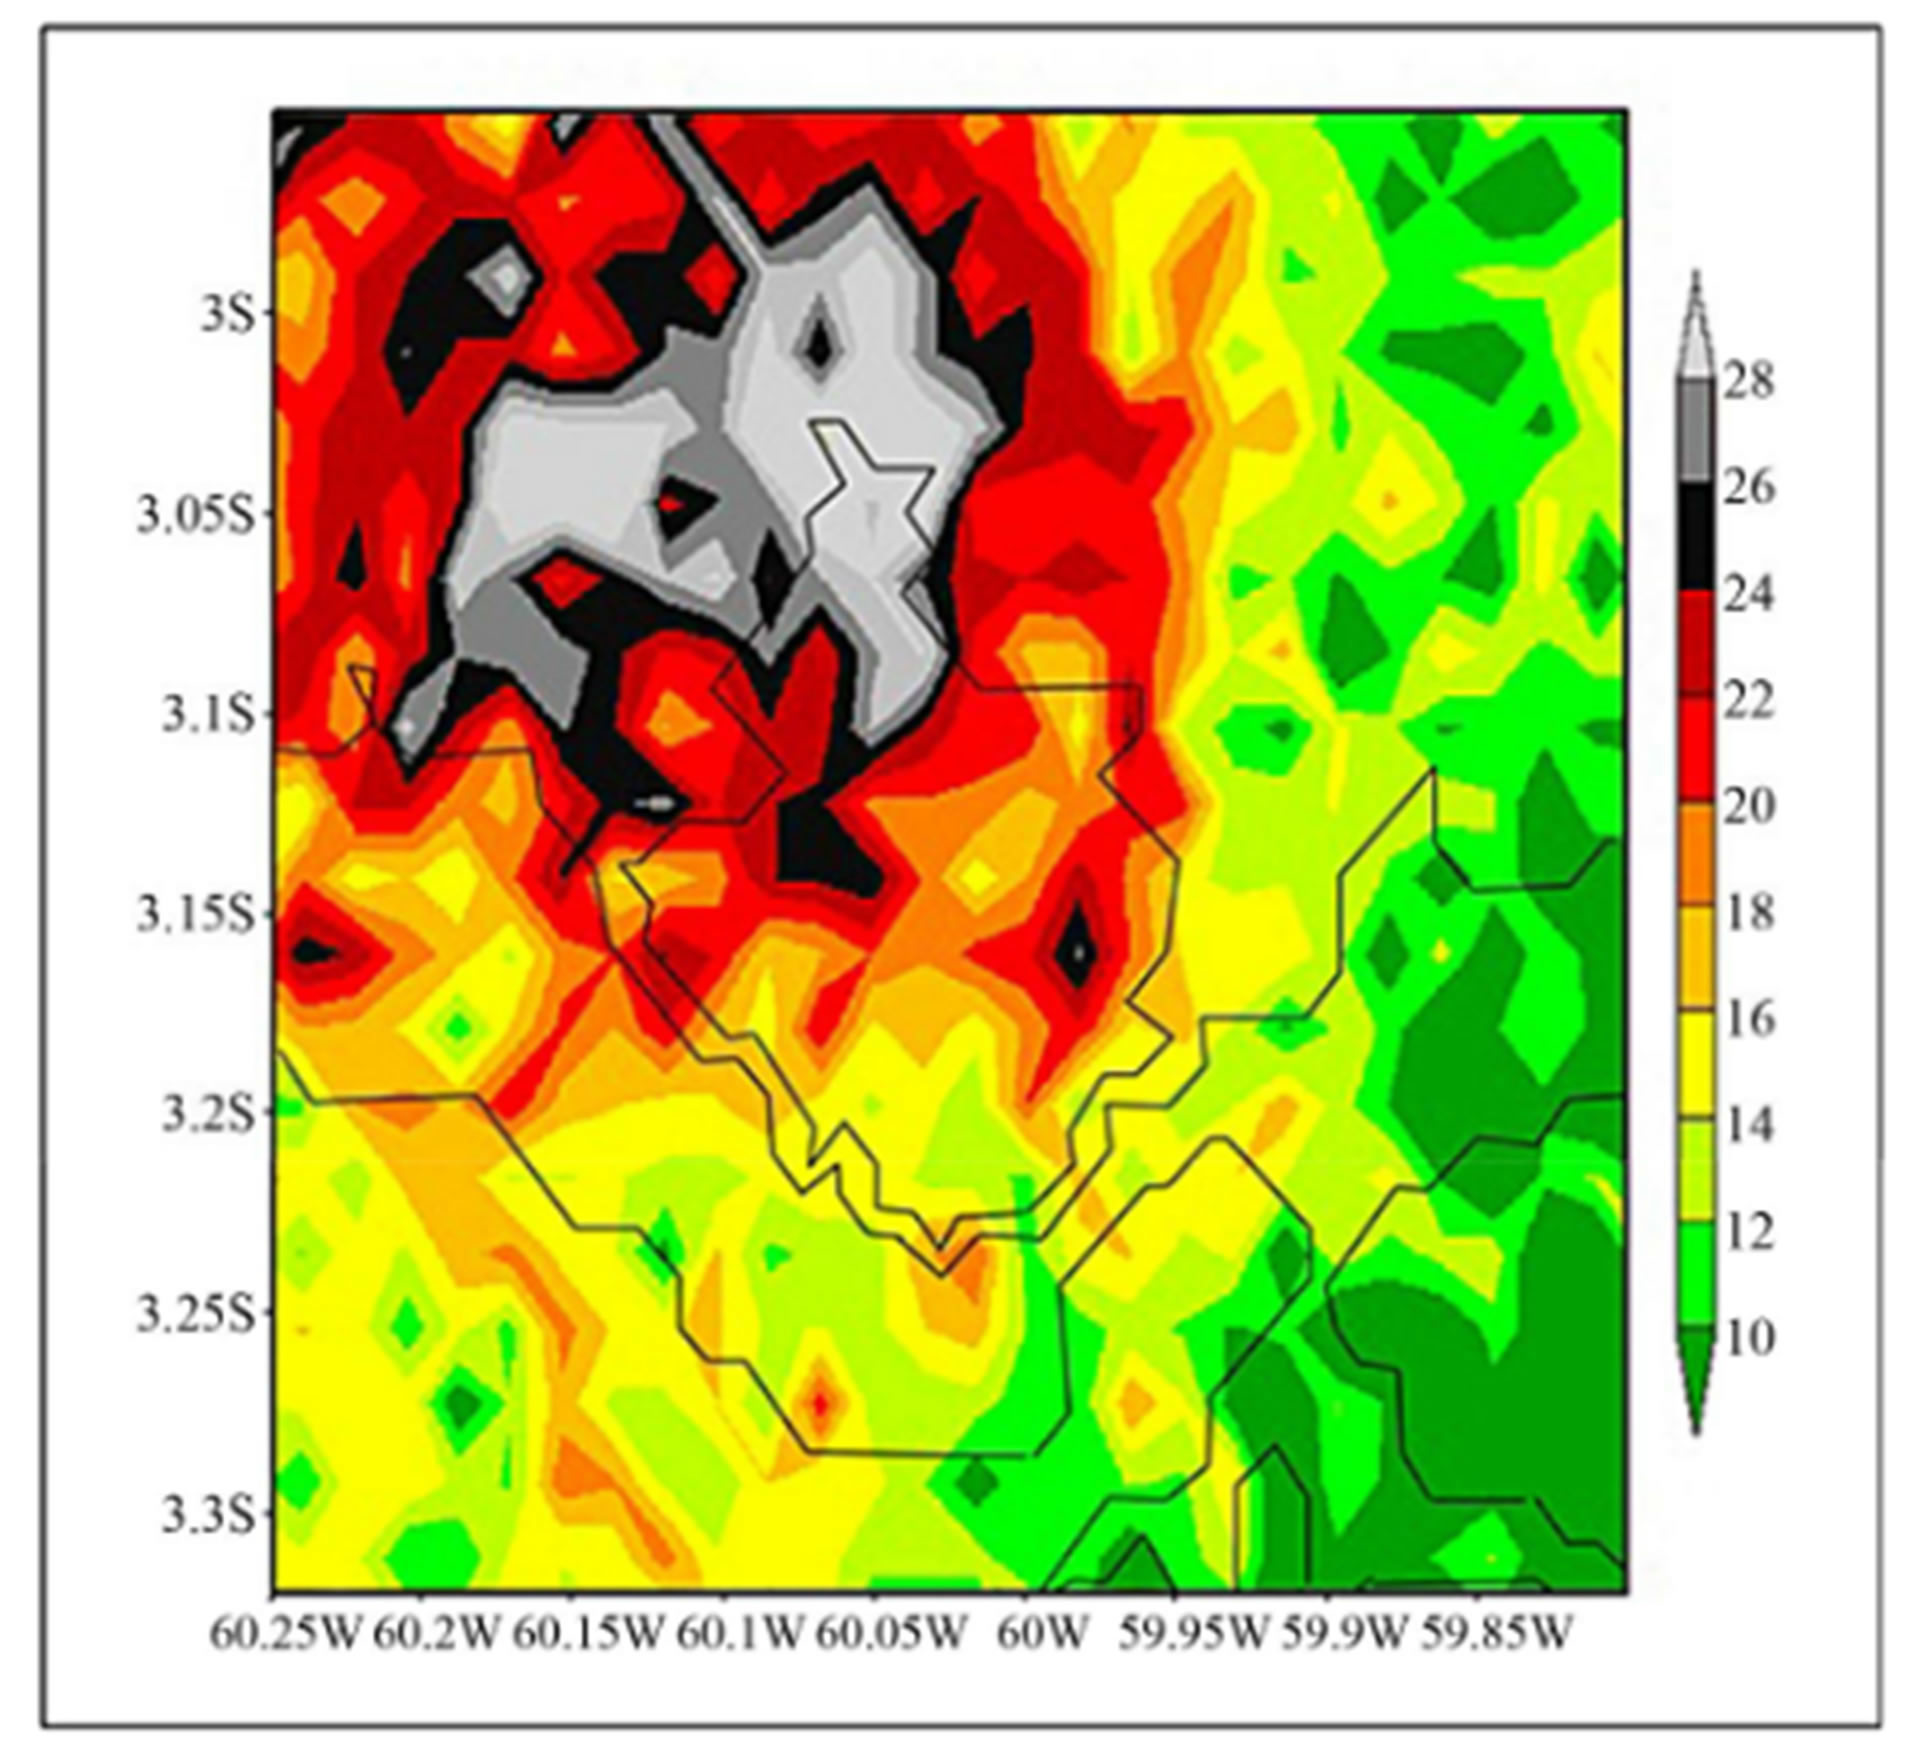 (b)
(b)
Figure 2. Lightning activity observed by: (a) LIS sensor in Brazil in the period from 1999 to 2013. A black circle indicates the approximate location of Manaus; (b) WWLLN in the same region of Figure 1(b) in the period from 2004 to 2013. The contours of the Negro and Solimoes rivers and the urban area of Manaus in 2009 are also indicated.
found in the tropics near the Earth’s equator.
Since the UHI effect has becoming more prominent along the last decades with the growth of the urban area of Manaus, we have also investigated the time variation of the lightning activity during this period using thunderstorm day data [29]. Thunderstorm day data is the unique information available in Manaus for a long time period.
Figure 3 shows the time series of monthly thunderstorm days in Manaus from January 1973 to March 2013, the same period in Figure 1(a), indicating a positive trend in agreement with what it would be expected as-
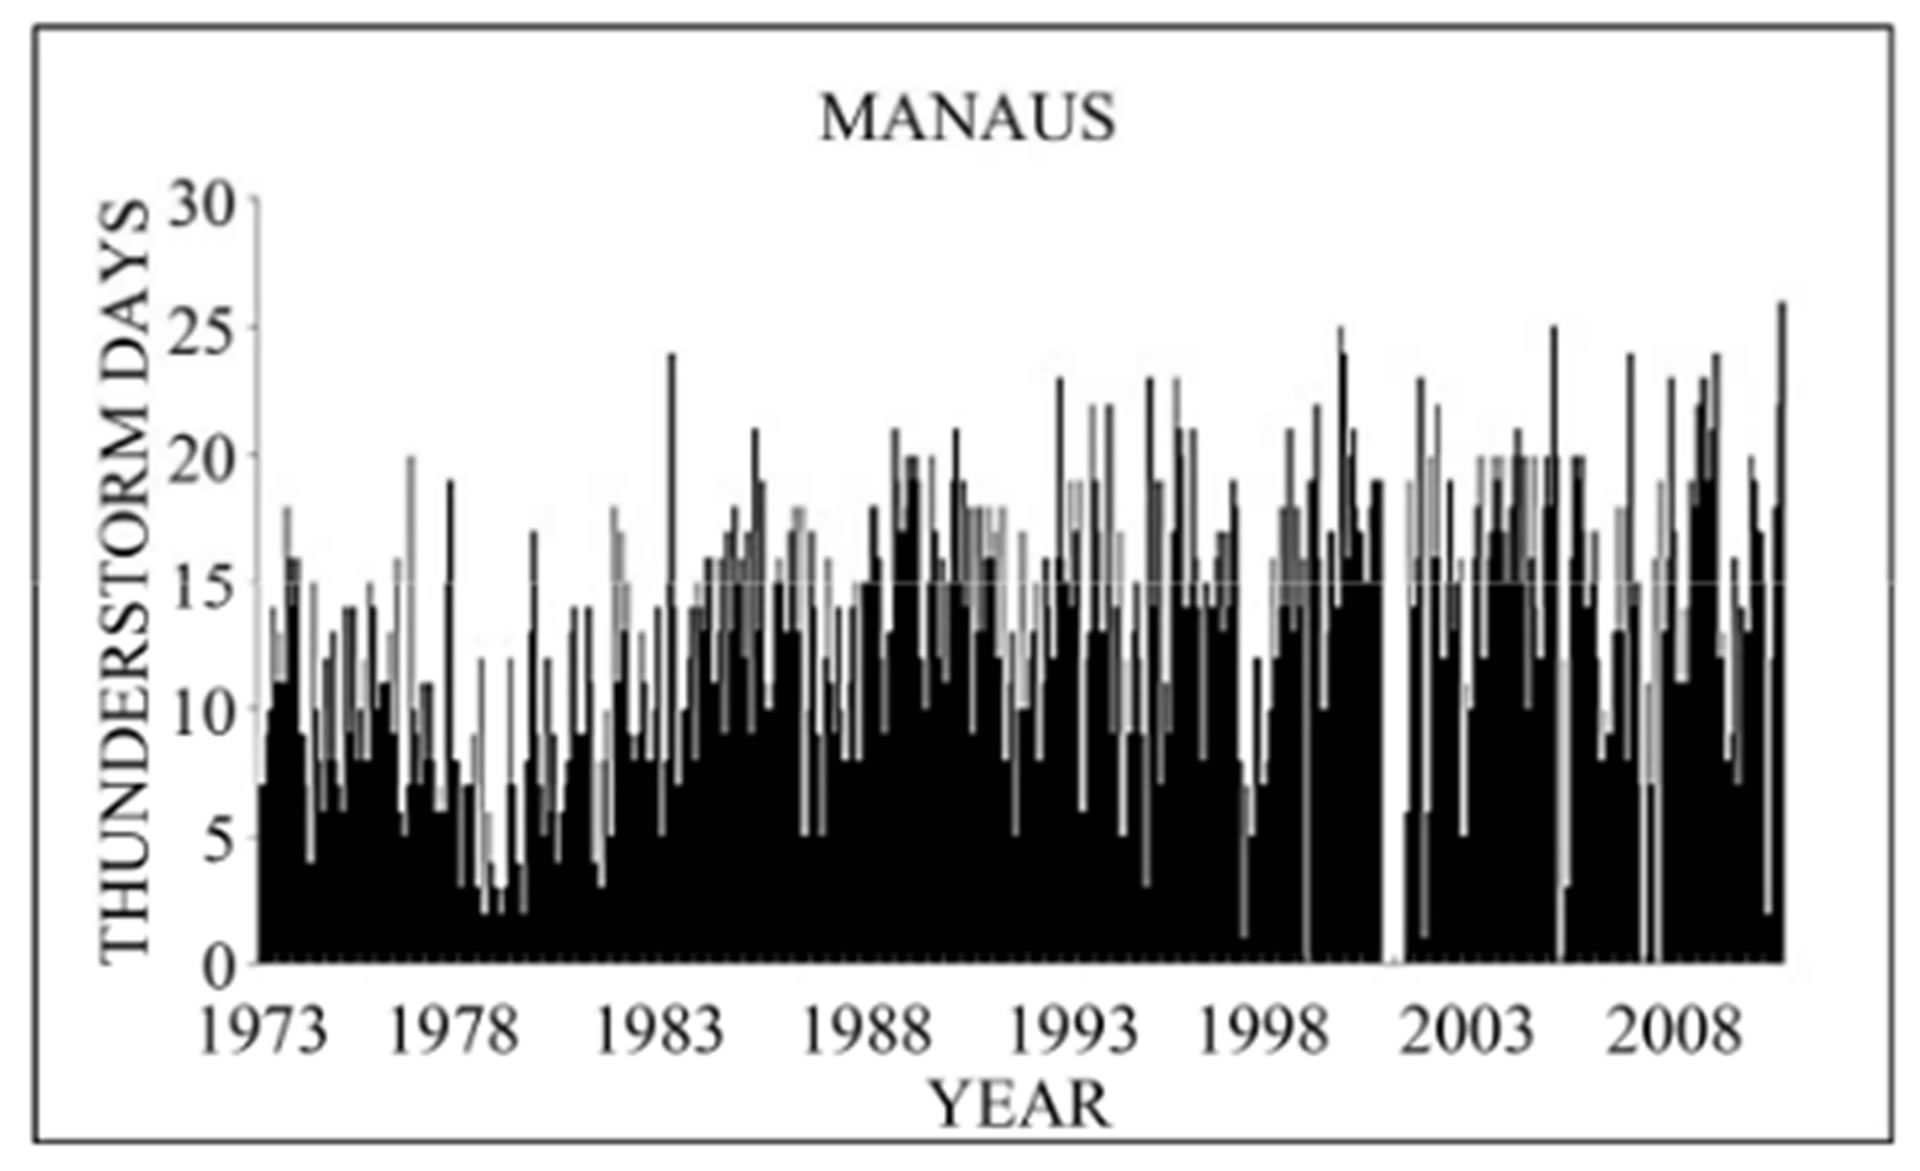
Figure 3. Time series of monthly thunderstorm days recorded in Manaus from January 1973 to March 2013.
suming that the increase in the lightning activity is caused by UHI effect. This result supports the relationship between lightning activity and the UHI effect previously discussed.
5. Conclusions
We showed that the lightning activity in the city of Manaus is larger than that in the regions around the city and it has been increasing in the last four decades with the increasing of the urban area of the city. These results suggest that these spatial and time variations are related to the UHI effect, since it is believed that the UHI effect influences thunderstorm formation and evolution and, in consequence, the lightning activity. Such an influence has been identified over small cities that have grown to become large urban areas, as it is the case for Manaus, and it has been reported in many other studies.
However, the observations reported here are unique in two senses. Firstly, Manaus is located in the central part of the largest tropical forest in the world, the Amazon rainforest, far away from the mountains, minimizing a possible influence of this aspect on lightning observations. Secondly, Manaus is located inside an area considered as one of the three global lightning chimneys of the world [30], so that any effect observed in this region may have a direct influence on the global lightning activity and, in consequence, on the climate system.
The results present here also suggest that the replacement of the forest by urban areas tends to increase the lightning activity in the Amazon region. The impact of this fact on the environment and climate of the Amazon remains to be investigated and a significant advance is expected with the launch of the Geostationary Lightning Mapper (GLM) on board the Geostationary Operational Environmental Satellite R-series (GOES-R) that planned to occur in late 2015 [31].
6. Acknowledgements
This article is a contribution of the Brazilian National Institute of Science and Technology (INCT) for Climate Change funded by CNPq Grant Number 573797/2008-0 and FAPESP Grant Number 2008/57719-9, and FAPESP project 2008/56711-4.
REFERENCES
- O. Pinto Jr., “Lightning in the Tropics: From a Source of Fire to a Monitoring System of Climate Changes,” Nova Science Publishers, Hauppauge, 2009.
- H. Le Treut, R. Somerville, U. Cubasch, Y. Ding, C. Mauritzen, A. Mokssit, T. Peterson and M. Prather, “Historical Overview of Climate Change,” In: S. Solomon, D. Qin, M. Manning, Z. Chen, M. Marquis, K. B. Averyt, M. Tignor and H. L. Miller, Eds., Climate Change 2007: The Physical Science Basis. Contribution of Working Group I to the Fourth Assessment Report of the Intergovernmental Panel on Climate Change, Cambridge University Press, Cambridge, New York, 2007, pp. 95-127.
- H. Tost, P. Jockel and J. Lelieveld, “Lightning and Convection Parameterisations—Uncertainties in Global Modelling,” Atmospheric Chemistry Physics, Vol. 7, No. 17, 2007, pp. 4553-4568. http://dx.doi.org/10.5194/acp-7-4553-2007
- E. R. Williams, “Global Circuit Response to Seasonal Variations in Global Surface Air Temperature,” Monthly Weather Review, Vol. 122, No. 8, 1994, pp. 1917-1929. http://dx.doi.org/10.1175/1520-0493(1994)122<1917:GCRTSV>2.0.CO;2
- B. Ye, A. D. Del Genio and K. K.-W. Lo, “CAPE Variations in the Current Climate and in a Climate Change,” Journal of Climate, Vol. 11, No. 8, 1998, pp. 1997-2015. http://dx.doi.org/10.1175/1520-0442-11.8.1997
- C. A. DeMott and D. A. Randall, “Observed Variations of Tropical Convective Available Potential Energy,” Journal of Geophysical Research, Vol. 109, No. 2, 2004, pp. 438- 453.
- A. Gettelman, D. J. Seidel, M. C. Wheeler and R. J. Ross, “Multidecadal Trends in Tropical Convective Available Potential Energy,” Journal of Geophysical Research, Vol. 107, No. 21, 2002, pp. 4606-4613. http://dx.doi.org/10.1029/2001JD001082
- K. Riemann-Campe, K. Fraedricha and F. Lunkeit, “Global Climatology of Convective Available Potential Energy (CAPE) and Convective Inhibition (CIN) in ERA-40 reanalysis,” Atmospheric Research, Vol. 93, No. 1-3, 2009, pp. 534-545. http://dx.doi.org/10.1016/j.atmosres.2008.09.037
- B. Stone, “Urban and Rural Temperature Trends in Proximity to Large US Cities: 1951-2000,” International Journal of Climatology, Vol. 27, No. 13, 2007, pp. 1801-1807. http://dx.doi.org/10.1002/joc.1555
- F. Fujibe, “Detection of Urban Warming in Recent Temperature Trends in Japan,” International Journal of Climatology, Vol. 29, No. 12, 2009, pp. 1811-1822. http://dx.doi.org/10.1002/joc.1822
- T. Oke, “The Energetic Basis of the Urban Heat Island,” Quarterly Journal of the Royal Meteorological Society, Vol. 108, No. 455, 1982, pp. 1-24.
- A. J. Arnfield, “Two Decades of Urban Climate Research: A Review of Turbulence, Exchanges of Energy and Water, and the Urban Heat Island,” International Journal of Climatology, Vol. 23, No. 1, 2003, pp. 1-24. http://dx.doi.org/10.1002/joc.859
- W. T. L. Chow and M. Roth, “Temporal Dynamics of the Urban Heat Island of Singapore,” International Journal of Climatology, Vol. 26, No. 15, 2006, pp. 2243-2260. http://dx.doi.org/10.1002/joc.1364
- I. D. Stewart, “A Systematic Review and Scientific Critique of Methodology in Modern Urban Heat Island Literature,” International Journal of Climatology, Vol. 31, No. 2, 2011, pp. 200-217. http://dx.doi.org/10.1002/joc.2141
- I. D. Stewart and T. R. Oke, “Local Climate Zones for Urban Temperature Studies,” Bulletin American Meteorological Society, Vol. 93, No. 12, 2012, pp. 1879-1900. http://dx.doi.org/10.1175/BAMS-D-11-00019.1
- M. P. McCarthy, M. J. Best and R. A. Betts, “Climate Change in Cities Due to Global Warming and Urban Effects,” Geophysical Research Letter, Vol. 37, No. 9, 2010, pp. 1-5. http://dx.doi.org/10.1029/2010GL042845
- G. Martine, “State of World Population 2007, Unleashing the Potential of Urban Growth,” UNFPA Report, United Nations Population Fund, New York, 2007.
- D. O. Souza and R. C. S. Alvalá, “Observational Evidence of the Urban Heat Island of Manaus City, Brazil,” Meteorological Applications, 2012, in Press. http://dx.doi.org/10.1002/met.1340
- F. W. S. Correia and R. A. F. Souza, “Urban Heat Island in the City of Manaus: An Observational and Numeric Study,” University of Amazonas State (UEA) Report, Internal Report, Manaus, 2012 (in Portuguese).
- M. L. Hutchins, R. H. Holzworth, J. B. Brundell and C. J. Rodger, “Relative Detection Efficiency of the World Wide Lightning Location Network,” Radio Science, Vol. 47, No. 6, 2012, pp. 1-24. http://dx.doi.org/10.1029/2012RS005049
- H. J. Christian, R. J. Blakeslee, S. J. Goodman, D. M. Mach, M. F. Stewart, D. E. Buechler, W. J. Koshak, J. M. Hall, W. L. Boeck, K. T. Driscoll and D. J. Boccippio, “The Lightning Imaging Sensor,” Proceedings of the 11th International Conference on Atmospheric Electricity (ICAE), Guntersville, 23 June 1999, pp. 746-749.
- N. E. Westcott, “Summertime Cloud-to-Ground Lightning Activity around Major Midwestern Urban Areas,” Journal of Applied Meteorology, Vol. 34, No. 7, 1995, pp. 1633-1642. http://dx.doi.org/10.1175/1520-0450-34.7.1633
- R. E. Orville, G. R. Huffines, J. Nielsen-Gammon, R. Zhang, B. Ely, S. Steiger, S. Phillips, S. Allen and W. Read, “Enhancement of Cloud-to-Ground Lightning over Houston, Texas,” Geophysical Research Letter, Vol. 28, No. 13, 2001, pp. 2597-2600. http://dx.doi.org/10.1029/2001GL012990
- S. Steiger, R. E. Orville and G. Huffines, “Cloud-toGround Lightning Characteristics over Houston, Texas: 1989-2000,” Journal of Geophysical Research, Vol. 107, No. 11, 2002, pp. 4117-4129. http://dx.doi.org/10.1029/2001JD001142
- K. P. Naccarato, O. Pinto Jr. and I. R. C. A. Pinto, “Evidence of Thermal and Aerosol Effects on the Cloud-toGround Lightning Density and Polarity over Large Urban Areas of Southeastern Brazil,” Geophysical Research Letter, Vol. 30, No. 13, 2003, pp. 1674-1677. http://dx.doi.org/10.1029/2003GL017496
- I. R. C. A. Pinto, O. Pinto Jr., M. A. S. S. Gomes and N. J. Ferreira, “Urban Effect on the Characteristics of Cloud-toGround Lightning over Belo Horizonte-Brazil,” Annales Geophysicae, Vol. 22, No. 2, 2004, pp. 697-700. http://dx.doi.org/10.5194/angeo-22-697-2004
- S. K. Kar, Y.-A. Liou and K.-J. Há, “Characteristics of Cloud-to-Ground Lightning Activity over Seoul, South Korea in Relation to an Urban Effect,” Annales Geophysicae, Vol. 25, No. 10, 2007, pp. 2113-2118. http://dx.doi.org/10.5194/angeo-25-2113-2007
- O. Pinto Jr. and I. R. C. A. Pinto, “On the Sensitivity of Cloud-to-Ground Lightning Activity to Surface Air Temperature Changes at Different Time Scales in São Paulo, Brazil,” Journal of Geophysical Research, Vol. 113, No. 20, 2008, pp. 22334-22343.
- O. Pinto Jr., I. R. C. A. Pinto and M. A. S. Ferro, “A Study of the Long-Term Variability of Thunderstorm Days in Southeast Brazil,” Journal of Geophysical Research, Vol. 118, No. 5, 2013, pp. 1-16.
- E. R. Williams and G. Sátori, “Lightning, Thermodynamic and Hydrological Comparison of the Two Tropical Continental Chimneys,” Journal of Atmospheric and Solar Terrestrial Physics, Vol. 66, No. 13-14, 2004, pp. 1213- 1231. http://dx.doi.org/10.1016/j.jastp.2004.05.015
- S. J. Goodman, R. J. Blakeslee, W. J. Koshak, D. Mach, J. Bailey, D. Buechler, L. Carey, C. Schultz, M. Bateman, E. McCaul Jr. and G. Stano, “The GOES-R Geostationary Lightning Mapper (GLM),” Atmospheric Research, Vol. 125-126, 2013, pp. 34-49. http://dx.doi.org/10.1016/j.atmosres.2013.01.006