Open Journal of Fluid Dynamics
Vol.08 No.01(2018), Article ID:83412,14 pages
10.4236/ojfd.2018.81005
Unsteady Behavior of Necklace Vortex Produced by a Square Plate Protrusion
Keita Toda1, Tsukasa Haraoka1, Teruyoshi Sadahiro2, Hidemi Yamada1
1Department of Mechanical and Energy Systems Engineering, Oita University, Oita, Japan
2Department of Mechanical Engineering, National Institute of Technology, Sasebo College, Sasebo, Japan
Copyright © 2018 by authors and Scientific Research Publishing Inc.
This work is licensed under the Creative Commons Attribution International License (CC BY 4.0).
http://creativecommons.org/licenses/by/4.0/


Received: January 30, 2018; Accepted: March 26, 2018; Published: March 29, 2018
ABSTRACT
In this study, the unsteady behavior of necklace vortices formed in front of a square flat plate was experimentally investigated by flow visualization and PIV analysis by using a water channel. As a result, the necklace vortices started to oscillate when the Reynolds number increased beyond approximately 2000. Then, an amalgamation behavior of the necklace vortices took place when the Reynolds number increased beyond approximately 2650. Furthermore, in the same Reynolds number range, a breakaway behavior appeared when the relative height of the square plate was beyond approximately h/δ = 4.0. The features of the necklace vortices behaviors in the oscillation, amalgamation and breakaway states were explained by observing the time-series image of path lines and by analyzing the frequency of velocity fluctuation.
Keywords:
Necklace Vortex, Unsteady Flow, Square Plate, Visualization, PIV Analysis

1. Introduction
It is well known that the necklace vortex system is formed around a three-dimensional bluff body. Regarding the steady necklace vortex, a circular cylinder, a rectangular cylinder or a flat plate was mainly selected as a three-dimensional bluff body. The steady necklace vortex around a circular cylinder was experimentally studied by Baker [1] . The rectangular cylinder was dealt with by Seal et al. [2] . The flat plate was dealt with by Lin et al. [3] and Nakahara et al. [4] . In particular, the characteristics of the unsteady necklace vortex are shown below. Baker experimentally studied an unsteady necklace vortex system formed around a short circular cylinder with a diameter-to-height ratio of 2. Then, he showed that nature of complex oscillatory behavior was described by measuring the velocity distribution [5] . Visbal showed streamlines of the steady necklace vortices and the unsteady processes by using numerical calculations [6] . Seal et al. studied a breakaway behavior of the necklace vortices formed by a long rectangular cylinder which protrudes through the water surface [7] . Tsuruno et al. and Matsuguchi et al. studied the transition process of an unsteady necklace vortex system in front of a short square cylinder with a width-to-height ratio of 2 [8] [9] [10] . Lin et al. investigated the oscillation and breakaway processes of a necklace vortex upstream from a vertical rectangular plate (h/w = 0.5 - 4.0) and a short square cylinder (h/w = 1.08) on a ground wall. They explained that the boundary layer thickness is an important length scale controlling the cycle in the oscillation and breakaway processes of the necklace vortex [3] [11] .
In studies on the necklace vortex, various three-dimensional bluff body shapes have been used, as mentioned above. Among them, a thin plate can be regarded as a typical bluff body, because there is no reattachment to itself downstream of the separation on the plate edge. However, there are few reports on unsteady necklace vortices produced by the thin square flat plate, except the reports of Lin et al. Lin et al. did not distinguish between flat plates having different aspect ratios, w/h, in his experiment results. The necklace vortex produced by the thin square flat plate should be researched in more details, because it is thought to be the most basic shape among vertical thin plates.
Therefore, we focused on the unsteady necklace vortices produced in front of the thin square flat plate protrusion perpendicular to the ground wall on which the laminar boundary layer exists. The purpose of this paper is to clarify the influence of the Reynolds number Re and the reference laminar boundary layer thickness δ on the behavior of the unsteady necklace vortices produced by the thin square plate on the ground wall. On this account, flow visualization and PIV analysis were carried out while an unsteady necklace vortex state appeared in the Reynolds numbers between 2000 and 3250.
2. Experimental Apparatus and Procedure
Figure 1 shows an open test section of a water channel used in this experiment. The test section is made of transparent acrylic walls, and has a width of 300 mm, a height of 300 mm and a length of 1100 mm. The coordinate system and nomenclature also are shown in the same figure. The contraction area ratio of the inlet nozzle is 0.5. A perforated plate, a honeycomb and four woven wire screens are installed upstream of the inlet nozzle. A ground wall, which let a square plate protrusion stand, is an acrylic plate with a width of 300 mm, a length of 1000 mm and a thickness of 5 mm. The ground wall, whose leading-edge shape is one half the major axis of an ellipse, was submerged in a position 50 mm above the test section floor. Therefore, a new laminar boundary layer was formed on the ground wall.
The unsteady necklace vortices were produced by the protrusion of a thin square plate with a thickness of 1.5 mm standing perpendicularly to the ground
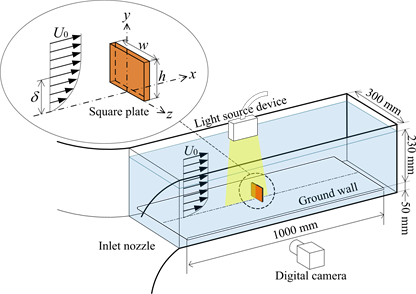
Figure 1. Schematic diagram of experimental apparatus and coordinate system.
wall on which the laminar boundary layer exists. The sizes h or w of the square plate and the blockage ratio are shown in Table 1. The blockage effect of the square plate on this flow field will not need to be considered, because the maximum blockage ratio is 4.38%. The square plate was stood at position 100, 150, 320, 500 or 800 mm from the front edge of ground wall.
In the experimental procedure, fine nylon particles, with an average diameter of 50 μm (specific gravity about 1.03), were mixed in the water channel. The particle-images in the flow field were visualized by a metal-halide light irradiating from a slit of about 2 mm, and were successively taken by a digital camera (1280 × 1024 pixels) at a frame rate of 100 or 200 fps. Each path lines-image was created by mutually superposing 50 particle-images. The resolution of the pixel was set in the range of 0.07 to 0.09 mm/pixel.
The velocity profile upstream of the square plate protrusion was obtained by using a time-series PIV. The uncertainty of velocity measurement by PIV was estimated to be approximately 6.2%, by comparing the Blasius’ boundary layer velocity profile with the velocity profile measured by PIV at 320 mm position downstream from the front edge of the ground wall. On this account, the original boundary layer can be determined by the Blasius’ solution. Therefore, the reference laminar boundary layer thickness δ (=δ99) at the position assumed to stand the square plate was also obtained by the Blasius’ solution. The flow visualization and PIV analysis were carried out by varying the relative plate height h/δ between approximately 2.0 and 5.0, and by varying the Reynolds numbers Re ( = U0∙h/ν) between approximately 2000 and 3250.
3. Experimental Results and Discussions
When the Reynolds number was larger than approximately 2000, the waveform of velocity fluctuation became wavy and the turbulent intensity also increased in

Table 1. Square plate size and blockage ratio.
the vicinity of the necklace vortices. In addition, the dominant frequency appeared in FFT analysis of the velocity fluctuation. However, the necklace vortices were not always completely steady in Re < 2000, because the turbulent intensity in the vortex region increased gradually as the Reynolds number approached 2000. Therefore, the unsteady state in the necklace vortices may be induced by the turbulence inherent in the vortices.
3.1. Oscillation Behavior
Figure 2(a)-(e) shows the path lines-images in about one period in the oscillation behavior of the necklace vortices in the case of Re = 2040 and h/δ = 2.0. Blue, yellow and gray lines indicate the x-positions of each vortex center against the time of t = 8.5 s in order to investigate a vortex movement. The velocity measurement positions P1, P2 and P3 were also placed in a slightly upper position on V1, V2 and V3 at the same time. Four clockwise necklace vortices (first vortex V1, second vortex V2, third vortex V3 and fourth vortex V4) oscillated upstream and downstream, as shown in Figure 2. When the first vortex V1 moved downstream, the second vortex V2 also moved downstream belatedly. Following this, the third vortex V3 also moved downstream by following V2.
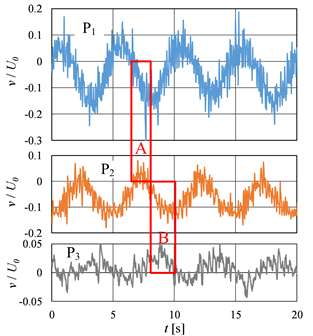
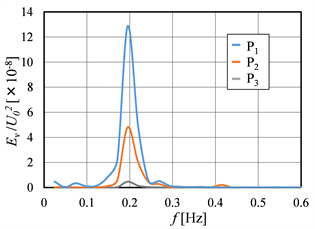
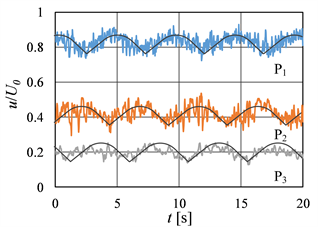
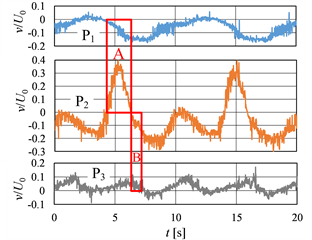
Figure 3(a) shows the waveforms of y-direction velocity v measured simultaneously at measurement positions P1, P2, and P3. The waveforms had a phase shift to one another as mentioned above. The positive velocity in the waveform at each measurement position means that each corresponding vortex moves downstream, and negative velocity means vortex moving upstream. The waveforms at P1 and P2 were almost opposite phases, and the waveform at P3 was later about 1/4 the period than that at P2. Therefore, it is assumed that vortex V1 and vortex V2 approach each other in the time zone of A, as shown in Figure 3(a). In addition, V2 and V3 approach each other in the time zone of B. Figure 3(b) shows a frequency analysis of the y-direction velocity component measured in a time length of 41 s at the positions P1, P2, and P3. The dominant frequency was fD = 0.195 Hz at three measurement positions, and corresponds to the Strouhal number St (= f∙h /U0) of 0.15. This means that the necklace vortices V1, V2 and V3 oscillate at the same period of T = 5.1 s. Figure 4(a) shows the waveforms of x-direction velocity u measured at the measurement positions P1, P2 and P3. The phase of the waveforms almost corresponded with the phase of the y-direction velocity waveforms at P1, P2 and P3, respectively. The x-direction velocity waveforms also indicated fD = 0.195 Hz, as shown in Figure 4(b).
3.2. Amalgamation Behavior
Figures 5(a)-(l) shows the path lines-images in about one period in the
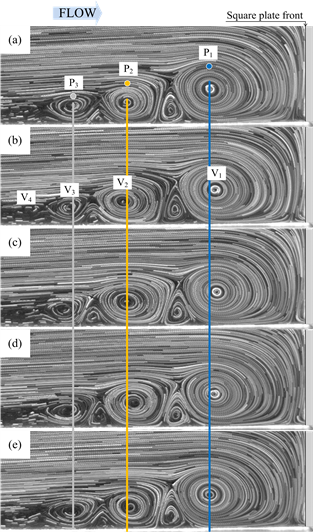
Figure 2. Time-series path lines-images in the oscillation behavior: (a) t = 8.5 s; t/T = 0; (b) t = 9.5 s; t/T = 0.20; (c) t = 10.5 s; t/T = 0.39; (d) t = 11.5 s; t/T = 0.59; (e) t = 12.5 s; t/T = 0.78: Position P1 (x/h; y/h) = (−0.48, 0.29); Position P2 (−0.89, 0.20); Position P3 (−1.21, 0.13).
amalgamation behavior of the necklace vortices in the case of Re = 3020 and h/δ = 3.0. Blue, yellow and gray lines indicate the x-positions of each vortex center against the time of t = 0 s. The first vortex V1 clearly moved downstream in the time of t = 2 - 5 s and moved upstream in t = 6 - 8 s. The second vortex V2 lately started to move downstream beyond t = 4 s. After the third vortex V3 amalgamated the fourth vortex V4 in the time of t = 4 - 5 s, V3 lately started to move downstream together with V2. For that reason, V2 was enclosed in the narrow region between V1 and V3 in the time of t = 5.5 - 6.5 s. When V2 closely approached V1, a part of V2 was amalgamated by V1 in the time of t = 5.5 - 6 s. Successively, the remaining part of V2 was amalgamated by V3 in the time of t = 6.5 - 7 s. After V3 amalgamated the remaining part of V2, V3 and V4 moved downstream until the original positions of V2 and V3, respectively. They became newly V2 and V3 at the end time of period.
 (a)
(a)
 (b)
(b)
Figure 3. Analysis of y-direction velocity v in each measurement position in oscillation behavior: (a) Waveforms of velocity fluctuation; (b) FFT analysis of velocity fluctuation.
Figure 6(a) shows the waveforms of y-direction velocity v measured simultaneously at the measurement positions P1, P2 and P3 seen in Figure 5. Each waveform indicated evidently periodic patterns. The measurement positions P1, P2 and P3 were placed in a slightly upper position on V1, V2 and V3 at the time of t = 0 s. When the velocity is negative at P1 and positive at P2, it is expected that the vortices V1 and V2 approach each other. In fact, V1 and V2 amalgamated in the time zone A, written in Figure 6(a). In similar manner, V2 and V3 amalgamated in the time zone B when the velocity was negative at P2 and positive at P3. Figure 6(b) shows a frequency analysis of the y-direction velocity component measured in a time length of 170 s at the positions P1, P2, and P3. The vortex V1 would oscillate with 0.11 Hz, because the dominant frequency at the positions P1
 (a)
(a)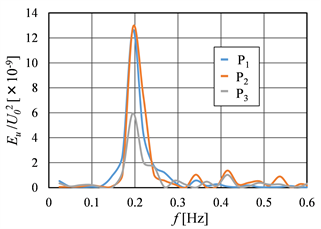 (b)
(b)
Figure 4. Analysis of x-direction velocity u in each measurement position in oscillation behavior: (a) Waveforms of velocity fluctuation; (b) FFT analysis of velocity fluctuation.
was fD = 0.11 Hz. The period is T = 9.1 s. The waveform at the positions P2 was distorted due to V2 being periodically amalgamated by V1 and V3, as mentioned above. On this account, the dominant frequency at the position P2 became fD = 0.11 and 0.22 Hz, which was equal with the dominant frequency fD at the position P3. The Strouhal number for these dominant frequencies were St = 0.11 and 0.23.
3.3. Breakaway Behavior
Figures 7(a)-(e) shows the path lines-images in about one period in the breakaway behavior of the necklace vortices in the case of Re = 3250 and h/δ = 5.0. Blue and yellow lines indicate the x-positions of each vortex center against the time of t = 11 s. The feature of breakaway behavior is that the second vortex V2 in the upstream position of the first vortex moves downstream with growing and amalgamates with the first vortex V1, as mentioned by Lin et al. The time-series path lines-images in Figure 7 also support the same feature. In addition, the vortex downstream moving occurred for all vortices except the first vortex. The
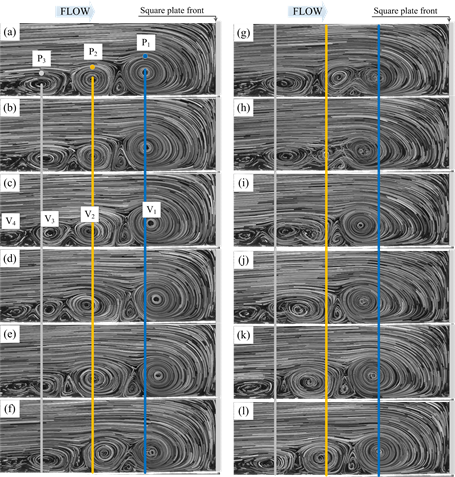
Figure 5. Time-series path lines-images in the amalgamation behavior: (a) t = 0 s; t/T = 0; (b) t = 1.0 s; t/T = 0.11; (c) t = 2.0 s; t/T = 0.22; (d) t = 3.0 s; t/T = 0.33; (e) t = 4.0 s; t/T = 0.44; (f) t = 5.0 s; t/T = 0.55; (g) t = 5.5 s; t/T = 0.60; (h) t = 6.0 s; t/T = 0.66; (i) t = 6.5 s; t/T = 0.71; (j) t = 7.0 s; t/T = 0.77; (k) t = 8.0 s; t/T = 0.88; (l) t = 9.0 s; t/T = 0.99: Position P1 (x/h, y/h) = (−0.47, 0.35), Position P2 (−0.81, 0.18), Position P3 (−1.01, 0. 16).
first vortex V1 was pushed downstream by the second vortex V2 coming downstream at first, and was amalgamated in the time of t = 13 s. Soon after that, the coming vortex V2 became a new first vortex V1 in approximately a time of t = 14 s in the upstream position of P1 line.
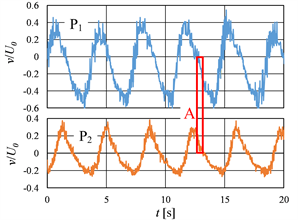
Figure 8(a) shows the waveforms of y-direction velocity v at the measurement positions P1 and P2 which were placed in a slightly upper position on V1 and V2 at the time of t = 11 s. Though the waveform at the position P1 seems to mean a oscillation of the same vortex V1, V1 is exchanged with the new vortex V1 in the middle of the period. Similarly, though the waveform at the position P2 seems to indicate an oscillation of the same vortex V2, V2 also is exchanged with a new vortex V2 in the end of the period. Since V2 was always moving downstream, V1 was amalgamated by V2 when V1 started to move upstream of the original position P1, as indicated by the time zone A. Figure 8(b) shows a frequency analysis of the y-direction velocity component measured in a time length of 82 s at the positions P1, P2, and P3. The breakaway process would be repeated with 0.27 Hz,
 (a)
(a)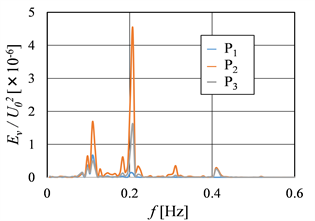 (b)
(b)
Figure 6. Analysis of y-direction velocity v in each measurement position in amalgamation behavior: (a) Waveforms of velocity fluctuation; (b) FFT analysis of velocity fluctuation.
because the dominant frequency at the positions P1 and P2 were fD = 0.27 Hz (St = 0.29). The period is T = 3.7 s.
3.4. Classification of Unsteady Behavior
When the Reynolds number was smaller than 2000, the velocity measured in a slightly upper position on the first vortex V1 did not provide such wavy waveform and dominant frequency as shown in Figure 3. On the other hand, the necklace vortices indicated the obvious oscillation state at Re = 2040, as shown in Figure 3. Therefore, the boundary in the Reynolds number between the steady and unsteady necklace vortex states is considered to be approximately 2000.
In the Reynolds number investigated in this experiment, the unsteady necklace vortex was classified to the oscillation state, the amalgamation state and the breakaway state. Figure 9 shows what kinds of unsteady necklace vortex appear in both conditions of the Reynolds number Re and the relative plate height h/δ. The necklace vortex indicated the oscillation behavior between Re = 2000 and 2650.
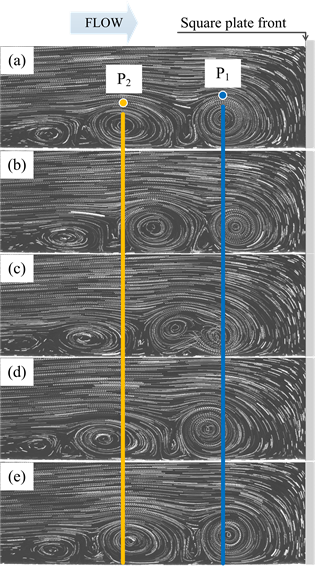
Figure 7. Time-series path lines-images in the breakaway behavior: (a) t = 11.0 s; t/T = 0; (b) t = 12.0 s; t/T = 0.27; (c) t = 13.0 s; t/T = 0.54; (d) t = 14.0 s; t/T = 0.81; (e) t = 15.0 s; t/T = 1.08: Position P1 (x/h, y/h) = (−0.35, 0.17), Position P2 (−0.65, 0.17).
The amalgamation behavior started beyond Re = 2650. The transition boundary from the oscillation state to the amalgamation state depended on only the Reynolds number. In addition, the breakaway state appeared in about Re ≥ 3200 and h/δ ≥ 4.0. Therefore, only the breakaway state is dependent on the Reynolds number and the relative plate height.
3.5. Feature of Unsteady Necklace Vortex
The Strouhal number was calculated from the dominant frequency of the velocity waveform measured in a slightly upper position on the first vortex V1 against the various cases of Re and h/δ. Figure 10 shows the distribution of the Strouhal number. There is only one dominant frequency in the oscillation and breakaway states, as mentioned in Session 3.1 and 3.3. On the other hand, two dominant
 (a)
(a)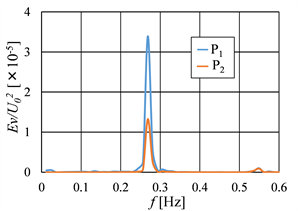 (b)
(b)
Figure 8. Analysis of y-direction velocity v in each measurement position in breakaway behavior: (a) Waveforms of velocity fluctuation; (b) FFT analysis of velocity fluctuation.
frequencies appeared in the amalgamation state, as mentioned in Session 3.2. The Strouhal number in the oscillation state was almost constant with each h/δ. Then, the Strouhal number was approximately St = 0.15 in the case of h/δ = 2.0, and approximately St = 0.19 in h/δ = 3.0. The first Strouhal number in the amalgamation state gradually increased from St = 0.15 with increasing the Reynolds number. The second Strouhal number was approximately half of the first Strouhal number. The Strouhal number in the breakaway state was larger than that in the amalgamation state.
4. Conclusions
In this study, the unsteady behavior of necklace vortices formed in front of a square flat plate protrusion was clarified based on the time-series image of path lines and the frequency analysis of velocity fluctuation. The following results were gained:
1) There exist three kinds of unsteady necklace vortices in the range of 2000 ≤ Re ≤ 3250, those are the oscillation state, the amalgamation state, and the breakaway state.
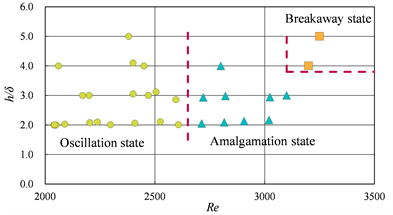
Figure 9. Classification of unsteady necklace vortex state. Red broken lines show the transition boundary of the unsteady necklace vortex state.
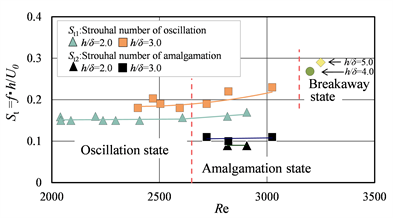
Figure 10. Strouhal number in unsteady necklace vortex movement. Red broken lines show the transition boundary of the unsteady necklace vortex state.
2) In the oscillation state, four clockwise necklace vortices (V1, V2, V3 and V4 vortices) periodically move downstream and upstream. The Strouhal number is almost constant against the Reynolds number with each h/δ. It is approximately St = 0.15 in the case of h/δ = 2.0.
3) In the amalgamation state, each vortex periodically moves, and amalgamates when adjacent vortices closely approach each other. Therefore, there are two kinds of dominant frequencies which correspond with the oscillation and amalgamation phenomena. The first Strouhal number gradually increases from St = 0.15. The second Strouhal number is approximately half of the first Strouhal number.
4) In the breakaway state, all vortices in the upstream position of the first vortex moves downstream with growing. Successively, the second vortex V2 amalgamates the first vortex V1, and replaces V1 as a new V1. The Strouhal number of the breakaway process would be larger than that of the amalgamation state.
5) The necklace vortex starts to oscillate when the Reynolds number increases beyond approximately 2000. Then, an amalgamation behavior takes place when the Reynolds number increases beyond approximately 2650. Furthermore, in the same Reynolds number range, a breakaway behavior appears when the relative height of the square plate is beyond approximately h/δ = 4.0.
Cite this paper
Toda, K., Haraoka, T., Sadahiro, T. and Yamada, H. (2018) Unsteady Behavior of Necklace Vortex Produced by a Square Plate Protrusion. Open Journal of Fluid Dynamics, 8, 59-72. https://doi.org/10.4236/ojfd.2018.81005
References
- 1. Baker, C.J. (1979) The Laminar Horseshoe Vortex. Journal of Fluid Mechanics, 95, 347-367. https://doi.org/10.1017/S0022112079001506
- 2. Seal, C.V., Smith, C.R., Akin, O. and Rockwell, D. (1995) Quantitative Characteristics of a Laminar, Unsteady Necklace Vortex System at a Rectangular Block-Flat Plate Juncture. Journal of Fluid Mechanics, 286, 117-135. https://doi.org/10.1017/S002211209500067X
- 3. Lin, C., Chiu, P.H. and Shieh, S.J. (2002) Characteristics of Horseshoe Vortex System near a Vertical Plate-Base Plate Juncture. Experimental Thermal and Fluid Science, 27, 25-46. https://doi.org/10.1016/S0894-1777(02)00215-7
- 4. Nakahara, Y. and Yamada, H. (2015) Visualization of a Laminar Necklace Vortex System in Front of a Vertical Rectangular Plate on a Ground Wall. Journal of Flow Control, Measurement & Visualization, 3, 75-85. https://doi.org/10.4236/jfcmv.2015.32008
- 5. Baker, C.J. (1991) The Oscillation of Horseshoe Vortex Systems. Journal of Fluids Engineering, 113, 489-495. https://doi.org/10.1115/1.2909523
- 6. Visbal, M.R. (1991) Structure of Laminar Juncture Flows. AIAA Journal, 29, 1273-1282. https://doi.org/10.2514/3.10732
- 7. Seal, C.V., Smith, C.R. and Rockwell, D. (1997) Dynamics of the Vorticity Distribution in Endwall Junctions. AIAA Journal, 35, 1041-1047. https://doi.org/10.2514/2.192
- 8. Tsuruno, S., Matsuguchi, A. and Tsuda, N. (1997) Study on Transition Process of Unsteady Horse-Shoe Vortex by PIV. Journal of the Visualization Society of Japan, 17, 137-140. (In Japanese) https://doi.org/10.3154/jvs.17.Supplement1_137
- 9. Matsuguchi, A., Tsuda, N. and Tsuruno, S. (1999) Study on Transition Process of Unsteady Horse-Shoe Vortex. The Japan Society of Mechanical Engineers, 65, 28-35. (In Japanese)
- 10. Matsuguchi, A., Kagawa, N., Tsuda, N. and Tsuruno, S. (2001) Study on Transition Process of Horse-Shoe Vortex (Examination of the Similarity). National Heat Transfer Symposium of Japan, 667-668. (In Japanese)
- 11. Lin, C., Lai, W. and Chang, K. (2003) Simultaneous Particle Image Velocimetry and Laser Doppler Velocimetry Measurements of Periodical Oscillatory Horseshoe Vortex System near Square Cylinder-Base Plate Juncture. Journal of Engineering Mechanics, 129, 1173-1188. https://doi.org/10.1061/(ASCE)0733-9399(2003)129:10(1173)
Nomenclatures
(x, y, z): Cartesian coordinate system
h: Height of square flat plate [m]
δ: Reference laminar boundary layer thickness (=δ99) [m]
U0: Free stream velocity [m/s]
u: x-direction velocity component [m/s]
v: y-direction velocity component [m/s]
t: time [s]
T: One period in unsteady necklace vortex behavior
h/δ: Relative height of square plate
Re: Experimental Reynolds number
ν: Kinematic viscosity [m2/s]
St: Strouhal number (=f∙h/U0)
f: Frequency of velocity fluctuation [Hz]
fD: Dominant frequency [Hz]