Open Journal of Applied Sciences
Vol.06 No.13(2016), Article ID:73047,35 pages
10.4236/ojapps.2016.613078
Intelligent Bio-Detector
Sabr Ahmed
Department of Biomedical Engineering, University of Bridgeport, Bridgeport, CT, USA

Copyright © 2016 by author and Scientific Research Publishing Inc.
This work is licensed under the Creative Commons Attribution-NonCommercial International License (CC BY-NC 4.0).
http://creativecommons.org/licenses/by-nc/4.0/


Received: November 16, 2016; Accepted: December 25, 2016; Published: December 28, 2016
ABSTRACT
The objective of this document is to describe the design and implementation of an intelligent biomedical system. The system consists of an array of multiple sensors. The sensors are connected to the Arduino Uno device to allow data capture and processing. The captured signals from the sensors are then digitized by the microcontroller. The data from the microcontroller are accessible via two different portals: the LCD display and the LabVIEW graphical user interface. The microcontroller is also equipped with a GSM module to send the alert message to the user upon occurrence of events that simulate abnormal activity in the biological parameters of the user.
Keywords:
Bio-Detector, Biosensors, Biomedical, Hospital’s Devices, Biotechnology, Biomedical Engineering

1. Introduction
Intelligent systems are programmed to perform the intelligent management between the source and the controlling device. The transfer of data is usually two-way. Both source and controlling devices can transfer the data. Control signal is mostly used for transferring the data. The sensor modules are of two types: Analog and Digital. Analog signal module sends the data in analog form, either continuous voltage or current, while the digital senor module sends data in digital form, bits or bytes. The micro-con- troller requires the data in digital form. The analogue data are required to be converted into the digital data using a device known as the ADC, analog-to-digital converter. The design and analysis concepts within Control Engineering have applications in practically all areas of technology from micro-electronics, communications, and biomedical to the energy, food and chemical process industries. This group has focused on what artificial intelligence and advanced control techniques can offer for smart sensing, process monitoring, process optimization and control in applications, including biomedical, chemical process control and electrical power and energy systems.
1.1. Intelligent Control
We have experience in the application of neural network and fuzzy logic techniques to build intelligence into sensors and control systems. This work has included the development of novel training algorithms, new machine intelligence techniques for smart sensors and process monitoring, model based control techniques with applications stretching from power system control to intelligent signal processing of EEG signals.
1.2. Advanced Process Control
With applications, particularly in the chemical, pharmaceutical and food processing industries, this work has focused on model based predictive control, process optimization and multivariate process monitoring techniques for improved production and fault detection.
1.3. Biomedical Applications
We have implemented the use of intelligent sensing and control techniques in biomedical applications, focusing on EEG analysis. Interests would include sensor fusion, smart biomedical sensors, blood glucose monitoring and control and FES applications.
1.4. Power Systems
We have also worked towards improving control of power systems, using advanced control techniques. This has included active filtering, harmonic monitoring and grid- wide harmonic control.
1.5. Sustainable Energy
We are a member of SERN―Sustainable Energy Regulation Network―a multidisciplinary research group that brings together researchers from across UCC with an interest in energy research. Our work has mainly focused on wind farm modelling and improved control. Interests include HVDC, hybrid energy supplies, optimal use of storage, intelligent control of embedded generation, environmental control and energy management, etc.
2. Goal and Objective
A significant amount of the human population suffers from chronic diseases. These patients comprise of older citizens, paralyzed individuals, and children. Some of these chronic diseases include, and are not limited to, diabetes, pressure or epileptic seizures. Patients who suffer from these diseases suffer from unstable health and require constant monitoring either from loved ones, house helpers, or nurses. This heath care requirement throughout the day takes a toll on the people who are suffering, as well as the ones who take care of the patients.
The motivation behind this project is to addresses the issue of constant monitoring and care required by some patients. The goal was to design and implement an intelligent bio-detector that can measure the vital parameters of the patient’s health. Additionally, the bio-detector should be able to process the data collected and automatically send a message to either the hospital or loved ones in case of an emergency (Figure 1).
3. Block Diagram
The block diagram below shows the configuration of the Intelligent Bio-detector (Figure 2).
The system comprises of the following components:
・ 1 Arduino UNO micro-controller
・ Arduino IDE kit
・ GSM, GPRS, SIM900 shield for the Arduino
・ PH sensor
・ Pulse sensor

Figure 1. Examples of patients suffering from chronic diseases.

Figure 2. Block diagram of the intelligent bio-detector.
・ Grove O2 gas sensor
・ TMP36 temperature sensor
・ EMG sensor
・ LCD 16 × 2 LCM1602C
・ LabVIEW-2016 version
・ Laptop
・ Lemon water, pure water and hair heater for testing
On the underlying material science and the non-specific operating standards included. It incorporates a survey of the basics from claiming estimation also defiant What’s more blankets those guideline sorts about cutting edge sensor-resonator, semiconductor based, furthermore optical fiber (counting a review of optical proliferation also transmission (Figure 3).
4. System Compositions
In this section, we will individually cover different components of the Intelligent Bio- Detector.
4.1. Arduino UNO Microcontroller
Arduino Uno is a microcontroller board based on the ATmega328P. It has 14 digital input/output pins (of which 6 can be used as PWM outputs), 6 analog inputs, a 16 MHz quartz crystal, a USB connection, a power jack, an ICSP header and a reset button. It contains everything needed to support the microcontroller. The Arduino UNO is a very easy-to-use and versatile platform for design and implementation of small-scale projects. The specification of the Arduino Uno is shown in Table 1 (Figure 4).
4.2. Arduino IDE Kit
The Arduino UNO comes with a free development kit, the Arduino IDE software. It is based on the C programming language and if one is familiar with C/C++, then development with the Arduino is straightforward (Figure 5).

Figure 3. Intelligent bio-detector setup.

Table 1. Arduino UNO specifications.

Figure 4. Arduino UNO.
4.3. SIM900/GSM/GRPS Shield
The Arduino UNO has a lot of options for add-on shields. One of the most useful ones is the SIM900 GSM shield. It plugs directly on top of the Arduino UNO and still gives the user the access to all the input and output terminals of the Arduino UNO. It supports quad-band operation and is compatible with majority of the mobile carriers in the United States. Even though the GSM shied requires 5 V for power-up, it cannot be powered by the USB connection alone. The current capability of the USB port from the laptop is not enough to successfully carry out all the operations of the SIM900. Hence, the Arduino must be powered via the 5 V AC-DC adapter to use the GSM shield appropriately.
The GSM Shield allows the user to send SMS (short message service) messages as well as make audio calls. For this project, we will only be utilizing the SMS feature for emergency notifications. It is important to note that only an unlocked US carrier SIM

Figure 5. Arduino IDE software.
card should be used. The SIM900 module doesn’t power up on its own when the power is plugged in. The user must press the power button on the board to turn the SIM900 module on. The LED will blink rapidly (once a second) when it is searching for the network. Once the network connection has been established, the LED will blink once every three seconds. This indicates that the connection to the network has been established and the SIM900 can be used to make calls and send messages now (Figure 6).
4.4. PH Sensor
pH stands for “potential hydrogen”. pH is the measurement of acidity and alkalinity of the body. pH is the most basic and fundamental driving force of our body functions. The pH scale from ranges 1 - 14, where 1 is highly acidic and 14 is highly basic. Neutral pH, such as that of water, is 7.0 (Figure 7).
The pH level in our body is affected by diet, sleep, stress, exercise, hydration level, and our daily activities. The pH level can be tested through blood, urine and saliva. Due to accessibility, pH levels of urine and saliva are the easiest to monitor. In this project, instead of using blood or saliva, we will be testing the pH level of known material, such as water. The importance of monitoring pH level is because Acidosis is related many diseases, such as chronic cardiovascular, liver, kidney damage, adrenal insufficiency, bladder and kidney stones [1] . The pH sensor used for this project outputs a voltage that is proportional to the pH value. The sensor is compatible with the Arduino UNO and does not need its own external power supply (Figure 8).

Figure 6. SIM900 GSM/GPRS shield for Arduino UNO.

Figure 7. pH scale.

Figure 8. Analog pH meter.
ü Module Power: 5.00 V.
ü Circuit Board Size: 43 mm × 32 mm.
ü pH Measuring Range: 0 ? 14.
ü Measuring Temperature: 0˚C - 60˚C.
ü Accuracy: ±0.1 pH (25˚C).
ü Response Time: ≤1 min.
ü pH Sensor with BNC Connector.
ü PH 2.0 Interface (3-foot patch).
ü Gain Adjustment Potentiometer.
ü Power Indicator LED.
ü The user manual for the pH meter has provided strict precautions to be used with the pH sensor.
ü Before and after each use of the pH electrode, you need to use (pure) water to clean it.
ü The electrode plug should be kept clean and dry to prevent short circuit.
ü Preservation: Electrode reference preservation solution is 3N KCL solution.
ü Staggered measurement should be avoided. The accuracy of the measurement is affected by the pollution caused from staggering measurements.
ü When the electrode is in use, the ceramic sand core and liquid outlet rubber ring should be removed, to allow salt bridge solution to maintain a certain velocity.
4.5. Pulse Sensor
The pulse sensor is another term for the Heart Rate Monitor. It measures the number of times the heart pumps the blood to the body and the unit of the output is beats per minute (bpm). In our case, the pulse sensor outputs a voltage which simulates a heartbeat. Post-processing of raw data is done to convert the voltage into BPM. The nominal range of the human heart rate is 60 - 100 bpm. Tachycardia is a fast heart rate, defined as above 100 bpm at rest. Bradycardia is the opposite of that, a slow heart rate below 60 bpm. A heart rate monitor consists of two main parts―a transmitter and a receiver. Electrical activity can be detected through the skin. The transmitter of the heart rate monitor is placed on the skin around the area where a pulse can be detected. This transmitter converts the pulse into an electrical signal which is then transmitted to the receiver (Figure 9 and Figure 10).
Tachycardia can be caused by congenital abnormalities, heart disease and some lung diseases. It can also be caused by substance abuse or side effects of certain medicines. Bradycardia could be an effect of electrolyte imbalances, hypothyroidism, and blood pressure medication side effects [2] . Shown below are some of the parameters of the pulse sensor that was used in this project.
・ Module power: 3 V - 5 V.
・ Diameter: 0.625”.
・ Overall thickness: 0.125”.
・ Cable length: 24”.
・ Current consumption: 4 mA @ 5 V.

Figure 9. Pulse sensor hardware.

Figure 10. Pulse sensor usage.
4.6. Grove-Gas Sensor (Oxygen)
Grove-Gas Sensor is used to detect the concentration of a gas in air. In our case, we used the Grove-Gas Oxygen sensor. It works on the basic principle of an electrochemical cell. The sensor outputs a voltage which is proportional to the percentage of oxygen concentration in air.
Some of the desired features of an Oxygen sensor are:
・ High-precision.
・ High sensitivity.
・ Wide linearity range.
・ Strong anti-interference ability.
・ Extraordinary reliability [3] .
The Grove-Gas Sensor (O2) we used for this project is manufactured by Winsor. Most gas sensors have a preheat time specification. This is the minimum amount of time a user should wait after powering the sensor on to take a reading. For the Winsor grove-gas sensor, this time is about 20 minutes.
The specification for the sensor is shown (Table 2).
4.7. TMP36 Temperature Sensor
Body temperature is one of the most basic and important parameters of one’s health. For our project, we used a TMP36 temperature sensor from Analog Devices. The temperature sensor outputs a voltage that is proportional to the temperature around the sensor (Figure 11).
In general, there are two types of temperature sensors, or thermometers: Analog and Digital. Analog thermometers are fabricated by materials which are affected by change in temperature like mercury. The change in level of mercury can be measured and it can be correlated to an equivalent change in temperature. Digital thermometer is a semiconductor device that acts as a temperature-sensitive resistor. At low temperatures, the thermistor is essentially an insulator―no electric charges are flowing and resistance is very high. As temperatures increases, the resistance decreases and more electric current can flow [4] (Figure 12).
The normal body temperature is supposed to 98.6-degree F (37-degree C). The normal body temperature can fluctuate by as much as 1 degree F (0.6-degree C) throughout
Table 2. Grove-gas sensor (02) specifications.

Figure 11. TMP36 temperature sensor.

Figure 12. Examples of sample thermometers.
the day depending on level of activity and time of day. The body temperature can be measured in many locations on the body. The mouth, ear, armpit and rectum are the most commonly used places.
The reason why we used a temp sensor in the Intelligent Bio-detector is to detect fever which can occur due to any of the following reasons:
・ Infection―This is the most common cause of a fever. It can affect the entire or just a few selected parts.
・ Medicines―These include antibiotics, narcotics, antihistamines, and many other. This is called “drug fever”. Antibiotics can raise the body temperature directly.
・ Severe trauma or injury―These can include heart attack, stroke, heatstroke, or burns.
・ Other medical conditions―These can include arthritis, hyperthyroidism, and even cancers, such as leukemia and lung cancer [5] .
4.8. EMG Sensor
Nerves control the muscles in the body with electrical signals called impulses. These impulses make the muscles react in specific ways. Nerve and muscle problems can cause the muscles to react in abnormal ways. An electromyogram (EMG) measures the electrical activity of muscles at rest and during contraction. For the Intelligent Bio-De- tector, we use an EMG sensor which will measure the filtered and rectified electrical activity of a muscle. The output of the sensor is an output voltage that is proportional to the amount of activity in the selected muscle (Figure 13).
The EMG sensor used for this project is called the MyoWare muscle sensor. It has the following features (Figure 14):
・ Improved adjustable gain.
・ On-board for cable connection.
・ Plug-n-play operation.
・ Reduced input voltage (+3.5 V).
・ Dimensions: 1” × 1”.
4.9. LCD 16 × 2 LCM1602C
The 16 × 2 LCD is commonly used as an output for Arduino projects. It has two rows of characters available with characters each (Figure 15).
The specifications of the LCD are shown (Table 3).

Figure 13. EMG sensor configuration.

Figure 14. MyoWare muscle sensor.

Figure 15. LCD LCM1602C.
4.10. LabVIEW
LabVIEW (Laboratory Virtual Instrument Engineering Workbench) is a system-design platform and development environment for a visual programming language from National Instruments. LabVIEW is commonly used for data acquisition, instrument control, and industrial automation on a variety of platforms including Microsoft Windows, various versions of UNIX, Linux, and Mac OS X. The programming language used in LabVIEW, also referred to as G, is a dataflow programming language. Execution is determined by the structure of a graphical block diagram (the LabVIEW-source code) on which the programmer connects different function-nodes by drawing wires. These wires propagate variables and any node can execute as soon as all its input data become available. Since this might be the case for multiple nodes simultaneously, G is inherently capable of parallel execution. Multi-processing and multi-threading hardware is automatically exploited by the built-in scheduler, which multiplexes multiple OS threads over the nodes ready for execution (Figure 16).
Some of the benefits of using LabVIEW include:
Table 3. Specifications of the LCD module.

Figure 16. LabVIEW.
・ Easy to use;
・ Faster user interface;
・ Quick development time;
・ Easily upgradable;
・ Graphical source code.
・ Data can be acquired through various communication portals:
○ Serial;
○ GPIB;
○ RDA;
○ IMAQ;
○ RT (Real time) board.
・ LabVIEW can include tools to help analyze data for:
○ Signal processing for filtering;
○ Peak detection;
○ Harmonic analysis;
○ Spectrum analysis.
・ Analyzing data using deferential equation, optimization, curve fitting, calculus, linear al Gerba, static, etc.
・ Analysis can be either by done directly in LabVIEW or with third party software such as C++ or MATLAB.
・ LabVIEW include the following tools to help you present your data:
○ on your machine using graphs, charts, gauges, etc.;
○ Over the internet-web publishing [6] .
4.11. Laptop
I used my personal laptop for code development and testing. It is a 64-bit Windows 10 laptop that runs LabVIEW 2016 (Figure 17).
4.12. Testing
Since we do not have access to patients that we can try the Intelligent Bio-Detector on,

Figure 17. Laptop with LabVIEW.
we used alternative testing methods. For example, a hair dryer was used to increase the temperature around the temperature sensor. Lemon water was used to verify the functionality of the pH sensor (Figure 18).
5. Implementation of Individual Components
In the section, we will cover the strategy that was used to design and implement this project. Before integrating all the sensors into the Intelligent Bio-Detector system, all the individual sensors were calibrated and tested individually. A flow chart of the project planning is shown (Figure 19).
The following subsections will cover the functioning and testing of each individual sensor prior to integration with the complete Intelligent Bio-Detector system.
5.1. pH Sensor
The pH sensor is used to measure the “potential Hydrogen” concentration of a medium. We described the specifications of the pH sensor in the previous section. The pH

Figure 18. Alternative testing methods.

Figure 19. Flowchart of the project planning.
sensor is connected to the AI2 (Analog Input 2) of the Arduino UNO. For calibration and testing of the pH sensor, we wrote a small Arduino program that allows us to monitor the result of the pH sensor in two different mediums, water and lemon water.
The analog Read function is the output of the 10-bit ADC on the Arduino. The output values range from 0 to 1023. Since the range of the ADC input is from 0 - 5 V, we multiplied the output of the ADC by (5 V/1024) to get the actual voltage (Figure 20). The 3.84 shown in the code is the correlation coefficient to convert the voltage into pH. We tested the pH sensor using pure water as shown (Figure 21).
The output of the Arduino code is shown on the serial monitor (Figure 22).
We also implemented the pH sensor code in LabVIEW as seen below. In this case, we first tested the pH of pure water, then we immersed the sensor into lemon water as shown in Figure 23 and Figure 24.
5.2. Pulse Sensor
The pulse sensor is used to measure heart rate of the patient. It is connected to the AI3 (Analog Input 3) of the Arduino Uno. Unlike the pH sensor, the pulse sensor does not output a voltage that is directly proportional to the heart rate. The pulse sensor outputs voltage that is represents of the pulse but it needs to be post-processed to determine the heart rate. The pulse sensor comes with various accessories that allow it to be used on the finger and the ear lobe. For our project, we placed the sensor on our index finger tip as shown in the image (Figure 25).
Like the pH sensor, we tested the pulse sensor using both the Arduino and the LabVIEW portals. For the Arduino, we had the option to use the pulse sensor libraries provided by the manufacturer but we decided to write our own algorithm that detects the

Figure 20. Arduino code for individual testing of pH sensor.

Figure 21. pH testing of pure water.

Figure 22. pH of pure water observed on the serial monitor of Arduino.

Figure 23. pH sensor in lemon water.
heart rate. The code for the algorithm is shown in Figure 26.
We set the threshold for heart beat detection to be at 600. This number was deciding after observing the output of the ADC. Keep in mind that the range of the pulse sensor output is from 0 - 1023. 600 that is slightly above the half way point of the range. Once the 600 threshold is hit, the algorithm looks like a falling edge when the output reaches 500. Once the falling edge at 500 output is detected, it is counted as a beat. The data is collected for 15 seconds and then the number of beats is multiplied by 4 to get the true beats per minute. The output of the Arduino code is shown in Figure 27.
We also implemented the code in LabVIEW like the pH sensor. In LabVIEW, we

Figure 24. LabVIEW results from pH testing of pure and lemon water.

Figure 25. Pulse sensor setup.

Figure 26. Arduino code for measuring BPM.

Figure 27. Arduino output for the pulse sensor.
measured the direct output of the pulse sensor. No algorithm was used to convert the output into beats per minute. The visual representation of the pulse sensor in LabVIEW gives us a good idea of the workings of the pulse sensor (Figure 28).
5.3. Grove-Gas Sensor
The Grove-Gas sensor (O2) was used to determine the concentration of oxygen in the air (Figure 29).
The Arduino code for characterizing and testing the Grove-Gas sensor is shown in Figure 30.
The output of the Arduino is shown in Figure 31. The unit is %.
The LabVIEW output of the oxygen sensor is shown below. For the LabVIEW test, we blew on the O2 sensor during data capture. The effect of blowing on the sensor can be seen in the output percentage (Figure 32).

Figure 28. LabVIEW output of the pulse sensor.
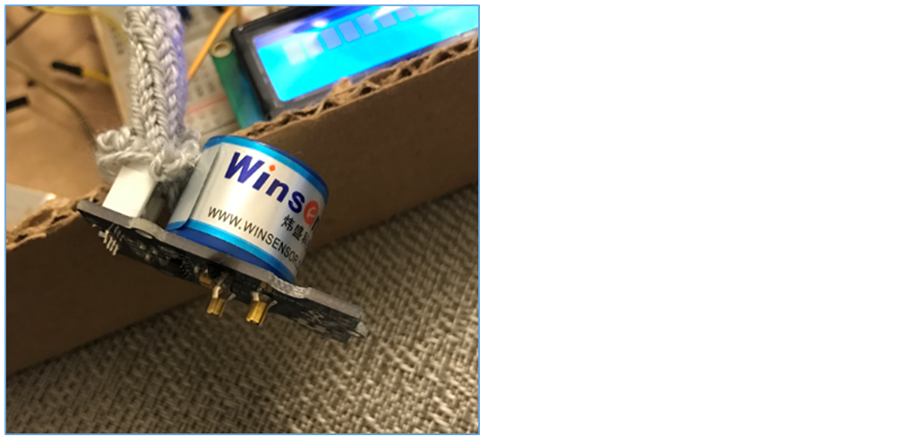
Figure 29. Grove-Gas sensor (O2).

Figure 30. Arduino code for O2 sensor.
5.4. Temperature Sensor
The temperature sensor is used to measure the body temperature for the Intelligent

Figure 31. Arduino output of the oxygen sensor.

Figure 32. LabVIEW output of the O2 sensor.
Bio-detector. There is no easy way to measure the temperature of the body using the TMP36 so we simulated temperature change using a hair dryer. Both Arduino and LabVIEW platforms were used for characterization and testing (Figure 33).
The Arduino code accounts for the offset and the correlation factor provided in the TMP36 datasheet (Figure 34).
Like the other analog inputs, the temperature output from the ADC must be multiplied by (5/1024) to convert from the ADC output to a voltage. The offset of the temperature sensor is 500 mV. This allows the temperature sensor to output negative values in Celsius. The output of the Arduino code on the serial monitor is shown in Figure 35.
The LabVIEW output of the temperature sensor shows the effect of a hair dryer blowing on a temperature sensor (Figure 36).

Figure 33. Temperature sensor.

Figure 34. Arduino code for measuring temperature.

Figure 35. Arduino output of the temperature sensor.
5.5. EMG Sensor
The EMG sensor is not as straightforward as the rest of the sensors. The output of the sensor rails to 3 V if there is activity detected in the muscle (Figure 37).
The Arduino code for EMG sensor uses AI1 (Analog Input 1). The output of the EMG sensor is in Volts (Figure 38).
The output of the EMG sensor on the Serial Monitor from the Arduino code is shown in Figure 39.
The LabVIEW implementation of the EMG sensor is shown in Figure 40.

Figure 36. LabVIEW output of temperature sensor.

Figure 37. EMG sensor under test.

Figure 38. Arduino code for the EMG sensor.

Figure 39. EMG sensor output of the Arduino code.

Figure 40. LabVIEW output of the EMG sensor.
5.6. LCD
The LCD module has libraries available in the Arduino IDE. It is easy to use and has a set of useful and straightforward functions (Figure 41).
The LCD module was only tested with the Arduino IDE. The code below shows that the program accepts a string from the Serial Monitor and outputs it on the LCD. The program waits for the user to input a string on the Serial Monitor and then displays it on the LCD screen (Figure 42 and Figure 43).

Figure 41. LCD module under test.

Figure 42. Arduino code for standalone test of the LCD.

Figure 43. Input for the LCD module.
The output of the standalone LCD program is shown in the images (Figure 44).
5.7. GSM Module
The GSM module requires the external AC-DC adapter to operate. The USB power alone isn’t sufficient to operate the module. For the GSM module, only Arduino testing was completed. The Arduino code is shown below. The standalone application for SMS allows the user to send a string to the serial monitor in the format “tXXXXXXX”. The “t” character is needed as a prefix to the string. The ‘XXXXXX’ is the message to be sent to the phone number listed in the Arduino code (Figure 45).
Several tests were run in which we sent different texts to our cell phone from the GSM module. The Serial Monitor and the cell phone messaging screenshot show the example of the standalone testing (Figure 46 and Figure 47).

Figure 44. LCD output.

Figure 45. Arduino code for SMS standalone application.

Figure 46. SMS testing with Arduino.

Figure 47. SMS received from the GSM shield.
6. Full System Integration
The full system integration of the Intelligent Bio-detector was carried out in two parallel paths: LabVIEW and Arduino. The LabVIEW integration combined the data capture of all individual sensors. The LCD and GSM modules were not integrated with the LabVIEW implementation. The Arduino implementation of the Intelligent Bio-detector integrated all the sensors, the LCD module and the GSM shield that alerts the user if there is emergency activity detected.
6.1. LabVIEW Implementation
The LabVIEW code for the implementation of Intelligent Bio-detector is covered in this sub-section (Figure 48).
The LabVIEW front panel is tab based for readings of different sensors in real time. There is also a Settings tab that allows the user to pick the COM port of the Arduino. It also contains the “STOP” button that closes the connection to the Arduino microcontroller cleanly. The block diagram of the LabVIEW code is also shown here (Figure 49 and Figure 50).

Figure 48. LabVIEW front panel.

Figure 49. Block diagram for the LabVIEW code.

Figure 50. LabVIEW output of the pulse sensor in real time.
Sample output of the pulse sensor in real time in LabVIEW.
One important thing to note is that the LabVIEW program works with the pre-built IDE firmware. One cannot upload a custom firmware onto the Arduino UNO and then use this LabVIEW program to monitor sensor data in real time. The screenshots below show the procedure to upload the pre-built IDE firmware onto the Arduino prior to running the LabVIEW program (Figures 51-55).
6.2. Arduino Implementation
The Arduino implementation of the Intelligent Bio-detector is complete and it includes all the features including the sensors, the LCD and the GSM integration (Figure 56).
The code specifies the sensor limits for the Intelligent Bio-detector system. These can be altered by the user appropriately. Under normal operation of the program, the LCD displays the Status and the sensor values of all sensors. Since we are limited by the real estate of the LCD, the LCD cycles through various sensor values for a duration of 1 second. Corresponding to each sensor value, the LCD also displays the status as “Normal” or “Abnormal”. Additionally, if the status is “Abnormal”, the Arduino program will send an alert to the phone number notifying the user of an emergency state with the following information:
・ Name of patient;
・ Address of patient;
・ Emergency State;
・ Current value of the sensor that caused the Abnormal status.

Figure 51. LabVIEW: Select LINX firmware wizard.

Figure 52. Select Arduino UNO and click next.
Shown below are some of the screenshots from the LCD showing both “Abnormal” and “Normal” statuses (Figures 57-61).

Figure 53. Select COM port.

Figure 54. Select firmware version and upload type.
The “Normal” and “Abnormal” status on the LCD is determined based on the minimum and maximum values of the sensors shown in Table 4.

Figure 55. Firmware upload in progress.

Figure 56. Partial code of the Arduino implementation of the intelligent bio-detector.

Figure 57. Normal status and pH value.

Figure 58. Normal status and O2 concentration.

Figure 59. Normal status and EMG value.

Figure 60. Normal status and BPM value.

Figure 61. Abnormal status and temp value.
During testing of the final integrated Intelligent Bio-detector, SMS alerts were received when the output values of any of the sensors were outside the allowed limits defined in the Arduino program. The screenshots below show examples of such alerts (Figures 62-64).
7. Conclusion
The Intelligent Bio-detector is a multi-sensor approach to solving a critical problem with our healthcare industry. Patients suffering from chronic illness and paralysis will
Table 4. Minimum and maximum limits of the sensors.

Figure 62. SMS alert due to high temperature.

Figure 63. SMS alert due to high acidity.

Figure 64. SMS alert for detecting muscle activity.
tremendously benefit from this invention. It will also relieve stress from home nurses and family members who must provide undivided attention to patients throughout the day. The GSM/SMS functionality of the invention allows us to stay connected with the patients easily. The device will be easy to manufacture and will be a cost-effective solution to a growing healthcare issue.
Cite this paper
Ahmed, S. (2016) Intelligent Bio-Detector. Open Journal of Applied Sciences, 6, 903-937. http://dx.doi.org/10.4236/ojapps.2016.613078
References
- 1. Griffith, T. (2012) Understanding pH Measurement. Sensor Land.
- 2. Zimmermann, K.A. (2013) Heart Rate Monitors. Live Science.
- 3. Ramamoorthy, R. (2003) Oxygen Saturation. Journal of Materials Science, 38, 4271-4282.
https://doi.org/10.1023/A:1026370729205 - 4. Sharifi, R. and Langari, R. (2016) Nonlinear Sensor Fault Diagnosis Using Mixture of Probabilistic PCA Models. Mechanical Systems and Signal Processing, 85, 638-650.
- 5. Ada, L. (2012) Using a Temp Sensor. AdaFruit.
- 6. Thoric (2016) LabVIEW Introduction. Retrieved from NI.com.