Journal of Sustainable Bioenergy Systems
Vol. 2 No. 4 (2012) , Article ID: 25712 , 4 pages DOI:10.4236/jsbs.2012.24014
Conversion Synergies during Steam Co-Gasification of Ligno-Cellulosic Simulated Biomass with Coal
1Graduate School of Engineering, Nagoya University, Nagoya, Japan
2Department of Mechanical and Industrial Engineering, University of Dar es Salaam, Dar es Salaam, Tanzania
3EcoTopia Science Institute, Nagoya University, Nagoya, Japan
Email: kihedu@udsm.ac.tz; naruse@mech.nagoya-u.ac.jp
Received October 25, 2012; revised November 25, 2012; accepted December 4, 2012
Keywords: Co-Gasification; Synergy; Biomass; Cellulose; Lignin
ABSTRACT
Lignin and cellulose chemicals were used as artificial biomass components to make-up a simulated biomass. Alkali and Alkaline Earth Metal (AAEM) as well as volatile matter contents in these chemicals were much different from each other. Co-gasification of coal with simulated biomass shows improved conversion characteristics in comparison to the average calculated from separate conversion of coal and simulated biomass. Two conversion synergetic peaks were observed whereby the first peak occurred around 400˚C while the second one occurred above 800˚C. Although co-gasification of coal with lignin that has high AAEM content also shows two synergy peaks, the one at higher temperature is dominant. Co-gasification of coal with cellulose shows only a single synergy peak around 400˚C indicating that synergy at low temperature is related with interaction of volatiles. Investigation of morphology changes during gasification of lignin and coal, suggests that their low reactivity is associated with their solid shape maintained even at high temperature.
1. Introduction
Owing to predicted low supply capacity of fossil fuel reserves against the growing energy demand in addition to environmental issues resulting from fossil fuel combustion, alternative sources and alternative conversion methods have to be exploited. Biomass is one of the alternative energy sources, which can be utilized through thermal, chemical or biological conversions methods. Due to lower energy density, biomass can effectively be utilized if co-gasified with coal [1-3]. It has been reported that co-gasification behavior of biomass and coal is improved owing to catalytic effect of AAEM from biomass [4-7]. Acid washing of biomass to remove AAEM has been applied to reveal such effects. However, demineralization of coal is reported to increase synergetic effects during co-pyrolysis of coal and petroleum residues due to changing particle morphology [8]. Contribution to synergetic characteristics by interactions between biomass volatiles or other hydrogen donors with coal char matrix through hydrogen transfer has also been reported [2,8,9]. In addition, the differences in temperature gradient and gas diffusion capacity of biomass and coal also plays a significant role on improving conversion characteristics during co-processing [2,3,9].
Biomass is mainly composed up of lignin and holocellulose in addition to xylan. Also, it contains some mineral matters which after oxidation, remain as ash. Biomass plant cell structure is reinforced by primary wall composed of lignin while secondary wall is rich in cellulose [10]. Compositions of lignin and cellulose are crucial factors in biomass reactivity during gasification [6,11,12]. Biomass with high cellulose content is relatively more reactive than biomass with higher lignin content [6,13]. Cellulose is a linear polymer of anhydroglucopyranose units in contrast to lignin which is a cross linked threedimensional stable polymer formed by phenylpropane units in a non-repeating pattern [14,15]. Hemicellulose, as it is the case for cellulose, is made up of sugar units, which contains 5 carbon atoms with branches which can easily evolve out during thermal treatment [12,14]. Hemicellulose decomposes at lower temperatures around 250˚C to 300˚C. Cellulose decomposes fast between 300˚C and 400˚C while lignin decomposes slowly from 250˚C to 500˚C [6,11,15]. Yang et al. argued on even wider decomposition temperature of lignin extending from 100˚C to 900˚C based on its irregular structure composed of aromatic rings and various branches [12].
In this study, we have investigated on conversion characteristics during co-gasification of coal with simulated biomass composed of cellulose and lignin chemicals. We refer to cellulose and lignin contents in Japanese cedar (cryptomeria japonica) as typical biomass species with 70% cellulose and 30% lignin [16,17]. In order to study the volatile interactions phenomena, we take advantage of narrow decomposition temperature range of ash free cellulose [6] and its high volatile matter contents. On the other side, we verify catalytic effect by using Na rich lignin.
2. Experimental Methods
2.1. Samples Used
Coal A and Japanese cedar samples were milled to 150 μm while microcrystalline cellulose prepared by SigmaAldrich Chemie GmbH, and lignin made by Kanto Chemical Co. Inc., were used as artificial biomass constituents. These samples were stored in a desiccator to avoid moisture contamination. Proximate and ultimate analyses for the samples are presented in Table 1 while ash analysis results are provided in Table 2. It noted that Table 2 excludes ash analysis results for cellulose which was considered to be ash free and therefore AAEM free in this study (see Table 1) but also by other researchers [6]. Separate gasification experiments were conducted for; cedar, cellulose, lignin and coal. Gasification for mixture cases include 70% cellulose and 30% lignin i.e. simulated biomass as well as co-gasification of coal and simulated biomass with blending ratio of 50% coal, 35% cellulose and 15% lignin. In addition to that, co-gasification of coal 50% cellulose 50% and hence 50% coal 50% lignin were also conducted as references.
2.2. Gasification Experiments
Steam gasification of about 10 mg separate or mixed samples was conducted by using Shimadzu Thermo-Gravimetric Analyzer (TGA). Steam generator was set at 300˚C. Heating rate from ambient temperature to 1000˚C was set at 20˚C/min, however holding at 107˚C for 10 min to ensure complete removal of moisture contents. When 1000˚C was attained, constant temperature gasification was allowed to proceed until no mass loss was observed. To avoid steam condensation within TGA reactor at lower temperature ranges, only N2 at 150 ml/min was supplied from ambient temperature to 200˚C. Thereafter, N2 flow was reduced to 75 ml/min and maintained as purging gas and steam carrier. Meanwhile, 75 ml/min of steam was additionally supplied to allow gasification reactions to proceed.
2.3. Conversion and Extent of Synergy
Conversion ratio X was derived from mass decomposition data by TGA as follows;
 (1)
(1)
where m and mo represent mass of the sample on dry ash free basis at a certain gasification temperature and at initial condition, respectively.
Average conversion ratio Xave was calculated from conversion ratio for coal Xcol and conversion ratio for cellulose and/or lignin Xbio multiplied with mass ratio of coal or cellulose and/or lignin in the blend;
 (2)
(2)
where mcol, mbio and mbld represents initial dry ash free mass of coal, the blend and cellulose and/or lignin according to respective co-gasification cases.

Table 1. Proximate and ultimate analysis of samples.

Table 2. Ash analysis of samples.
Extent of conversion synergy Y was defined as the difference between conversion ratios for the blend Xbld from the calculated average conversion Xave at the same temperature;
 (3)
(3)
2.4. Morphology Investigation
Morphology of the samples dried in a constant temperature oven set at 60˚C for 24 hours or partially gasified samples was investigated by using Scanning Electron Microscope (SEM). In order to understand a typical morphology change during gasification, SEM investigation was done for raw and partially gasified samples. Residues were prepared from partial gasification to 550˚C that is just after completion of volatilization, but also from partial gasification to 800˚C. During partial gasification, temperature profile as well as flow rates for N2 and steam were identical to those applied during gasification experiments. When the target temperature of 550˚C or 800˚C was attained, supply of heat and steam was terminated allowing the residues to cool while maintaining N2 supply. Before SEM investigation, dried or partially gasified samples were carbon-coated in order to improve their electrical conductivity for SEM.
3. Results and Discussions
3.1. Conversion Behaviors
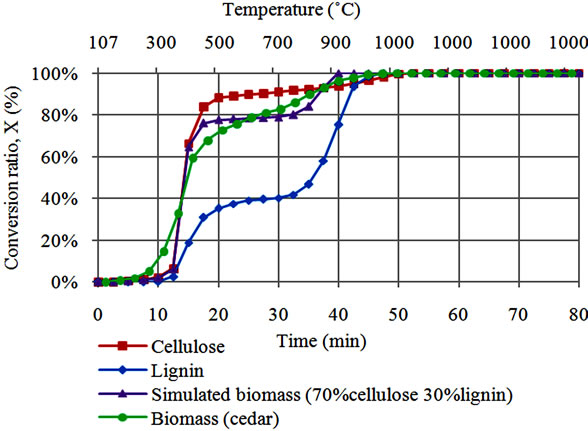
Conversion ratios during gasification experiments were calculated by using Equation (1). Conversion ratio patterns during steam gasification for Japanese cedar, cellulose, lignin and simulated biomass (cellulose 70% lignin 30%) are presented in Figure 1(a). It was noted that cellulose gasification is characterized by sharp volatilization which occurs between 350˚C and 450˚C as reported by other researchers [6,11]. Volatilization during cellulose gasification extends to around 87% conversion, the figure which corresponds to its higher volatile contents (see Table 1). By the end of volatilization, slow cellulose char gasification that proceeds thereafter indicates absence of AAEM species in the blend and hence lack of catalysis. Lignin shows relatively slower volatilization limited to about 38% at 450˚C. Fast lignin char gasification occurring above 800˚C is attributed to catalytic effect of its high Na content (see Table 2). Gasification behavior of simulated biomass (70% cellulose and 30% lignin) is presented in the same figure. Simulated biomass shows close correspondence to cellulose behavior between 300˚C and 450˚C. Above 800˚C, simulated biomass shows sharp conversion behavior similar to that of lignin. Lower and higher temperature gasification of simulated biomass signifies the corresponding roles of volatile interactions and AAEM catalysis at respective temperature ranges. Simulated biomass and cedar show almost similar gasification behavior. However, cedar yields earlier volatilization at 250˚C and continuous decomposition between volatilization and char gasification i.e. from 450˚C to 800˚C. Above this range, simulated biomass appears to be more reactive than cedar, due higher AAEM content in lignin.
3.2. Co-Gasification Behaviors
Co-gasification behavior of coal with simulated biomass is presented in Figure 1(b). It can be noted that blending ratio in this case was coal 50% cellulose 35% lignin 15%. Gasification behavior of simulated biomass included in this is the same as that presented in Figure 1(a). It was observed that coal gasification is slower than gasification of simulated biomass during both volatilization stage and char gasification. The average conversion for coal and simulated biomass as calculated by using Equation (2) is
 (a)
(a)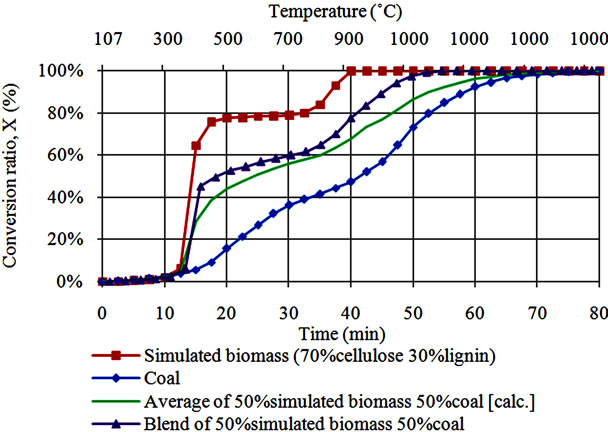 (b)
(b)
Figure 1. (a) Comparison of conversion behavior for steam gasification of simulated biomass and Japanese cedar; (b). Conversion behavior during steam co-gasification of simulated biomass with coal.
also presented in this figure. The difference between the calculated average and the co-gasification characteristics of coal with simulated biomass indicates occurrence of synergy. The synergy appear to be split in to two regions, volatilization stage between 450˚C to 800˚C and char gasification stage i.e. above 800˚C. Due to presence of high Na in the blend, this synergy can be associated to catalytic effects [4-7]. However, synergy effect during volatilization stage, can also be connected to volatiles reactions [2,8,9].
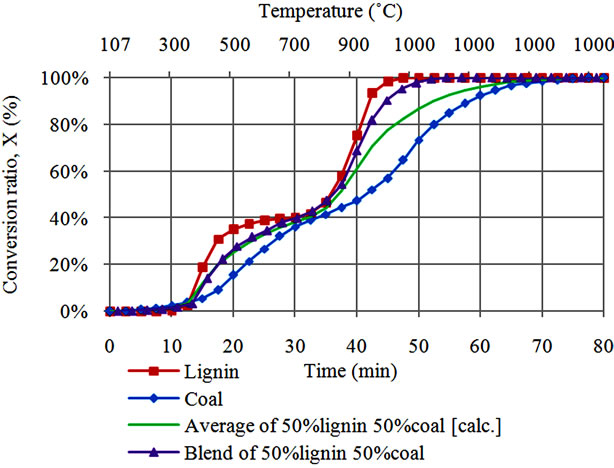
In order to demarcate catalytic effects from contribution of volatile interactions, we have also compared conversion characteristics during co-gasification of coal with lignin alone against co-gasification behavior of coal with cellulose alone case (Figures 2(a) and (b)). Lignin and cellulose behavior presented in these figures are identical to those presented in Figure 1(a) while coal behavior is identical to that presented in Figure 1(b). Average conversion for coal and cellulose or lignin was calculated by
 (a)
(a)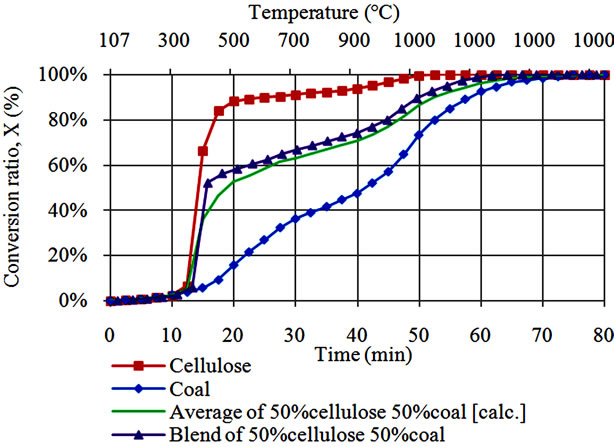 (b)
(b)
Figure 2. (a) Conversion behavior during steam co-gasification of lignin with coal; (b) Conversion behavior during steam co-gasification of cellulose with coal.
using Equation (2). For the case of co-gasification of lignin with coal (Figure 2(a)), two synergetic regions were observed as it was the case for co-gasification of coal and simulated biomass shown in Figure 1(b).
Although it is difficult to demarcate between domination of the catalytic effect of AAEM, a small difference between the average and co-gasification behavior between 300˚C and 800˚C, probably shows less occurrence of interactions between volatiles from lignin and coal. Benzene ring molecules for both coal and lignin likely limit the interaction ability of the respective reactants. At high temperature above 800˚C, co-gasification of lignin and coal almost behave like lignin due to corresponding increase in AAEM concentration within the residue of the blend [7]. On the other side, co-gasification of cellulose with coal shows only a single synergy peak between 350˚C and 450˚C (Figure 2(b)). No significant synergy is observed at temperatures above 800˚C for cellulosecoal co-gasification case. This result indicates that synergy can also occurred under influence of volatiles.
3.3. The Extent of Synergy
Extent of the synergy throughout co-gasification of simulated biomass, cellulose or lignin with coal was deduced by using Equation (3). Co-gasification of simulated biomass with coal and cog-gasification of lignin with coal shows two synergy peaks while single synergy peak occurred for coal and cellulose blend (Figure 3). Clearly, the synergy appear to be split in to two regions, between 450˚C and 800˚C i.e. devolatilization stage, and hence above 800˚C that is during char gasification. This figure suggests two possible synergy mechanisms during cogasification process; AAEM catalysis at higher temperature [4-7], and the volatile interactions [2,8,9]. It can also be observed that lower temperature synergy for coal and cellulose co-gasification case is superior to that observed during co-gasification of either simulated biomass or lignin with coal.

Figure 3. Extent of conversion synergy during steam co-gasification of lignin or cellulose with coal.
3.4. Morphology Changes
Investigation of morphology change covered raw samples as well as samples of lignin and cellulose as well as their blends with coal after partial gasification. Raw lignin shows a lumpy solid shape (Figure 4(a)). After gasification to 550˚C, lignin particles show no significant morphology change as shown in Figure 4(b) and in a magnified surface taken from the solid boundary inset (Figure 4(c)). This is despite the fact that lignin had attained over 37% conversion, that is almost after complete decomposition of its volatile matter (Table 1). However, when gasified to 800˚C lignin particles had spongy surface as shown in Figure 4(d) and particularly on the magnified surface taken from a dashed boundary inset (Figure 4(e)). Probably, spongy surface offers less steam diffusion resistance [2,9], resulting into enhanced gasification of lignin as observed from 800˚C onwards (Figure 1(a) and Figure 2(a)).
SEM image of raw cellulose demonstrates fibrous structure (Figure 5(a)). After gasification to 550˚C, morphology changes in cellulose gasified are appreciable on fiber shrinkage basis as shown in Figure 5(b). A magnified surface captured from the solid boundary inset is presented in Figure 5(c). This shrinkage is attributed to decomposition of volatile matter which accounts for 85% mass of cellulose (Table 1). After gasification to 800˚C,
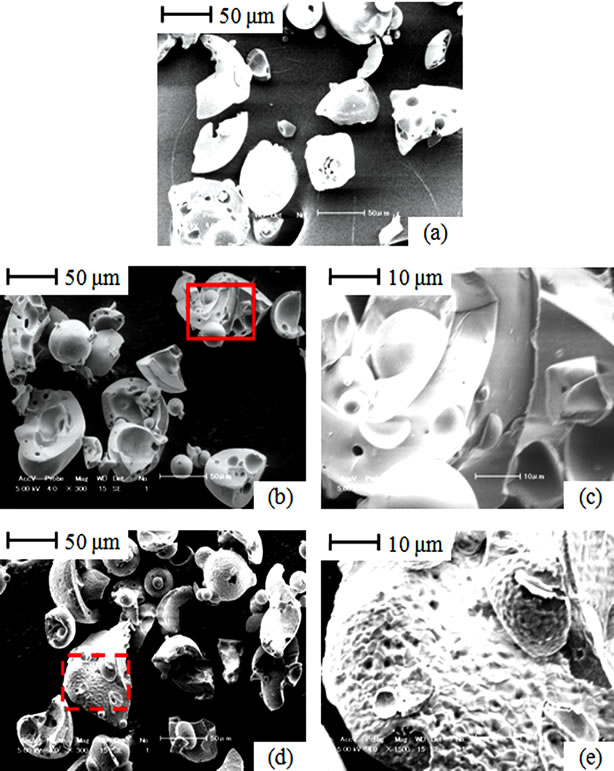
Figure 4. SEM images; (a) Raw lignin; (b) Lignin gasified to 550˚C; (c) Surface of lignin gasified to 550˚C; (d) Lignin gasified to 800˚C; (e) Surface of lignin gasified to 800˚C.
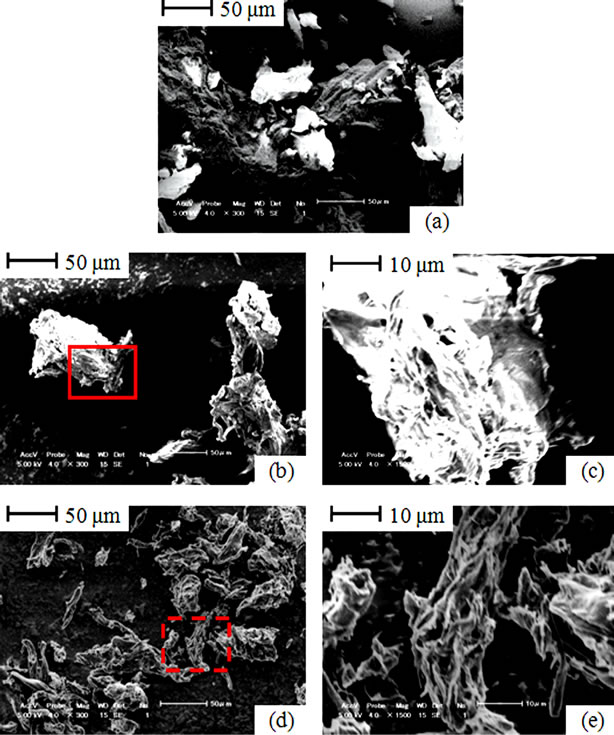
Figure 5. SEM images; (a) Raw cellulose; (b) Cellulose gasified to 550˚C; (c) Surface of cellulose gasified to 800˚C; (d) Cellulose gasified to 800˚C; (e) Surface of cellulose gasified to 800˚C.
further fiber shrinkage was notable (Figure 5(d)). A magnified shape of cellulose taken from dashed boundary inset is presented in Figure 5(e). The minor fiber shrinkage in cellulose fibers which occurs between 550˚C and 800˚C corresponds to its limited conversion that takes place during this interval (Figure 1(a) and Figure 2(b)).
SEM images for particle surfaces taken from coal and lignin blends gasified to 550˚C and 800˚C are presented in Figure 6. Magnified surface of lignin and coal gasified to 550˚C are shown in Figures 6(a) and (b), respecttively. In comparison to raw lignin, no significant morphology change was noted on lignin surface. Likewise, no considerable pore development was observed on coal surface. Limited morphology changes can be associated with corresponding low volatile matter contents (Table 1 and Table 2), in addition to slow decomposition behaviors (see Figure 1 and Figure 2). Even after gasification to 800˚C, morphology changes on lignin and coal surface structure remain to be less significant (Figures 6(c) and (d)). Non-interactive relation between lignin and coal is probably due to their similar benzene based molecular structures [14,15]. In addition to that, low reactivity of coal and lignin particles can be associated to their solid shapes maintained even at high temperature despite of high conversion stages are attained [11].
Figure 7 shows particle surfaces from partially gasified blends of cellulose and coal. As opposed to lignin and coal blend, it was difficult to differentiate between cellulose and coal particles in this case. Figures 7(a) and (b) shows magnified surfaces of cellulose and coal, after co-gasification to 550˚C. Fiber shrinkage and pore development are significant on cellulose and coal surfaces, respectively. After co-gasification to 800˚C, no significant change was observed on cellulose (Figure 7(c)) however further development of pores and physical cracking were notable on coal surface (Figure 7(d)). These features on coal surface, demonstrate on occurrence of further conversion in addition to the possible reason for accelerated gasification reactivity owing to the resulting low steam diffusion resistance [2,9].
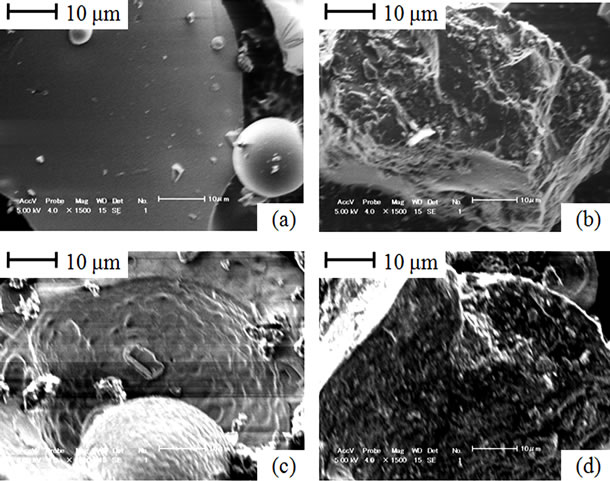
Figure 6. Particle surfaces from the gasified lignin and coal blends; (a) Lignin in the blend gasified to 550˚C; (b) Coal in the blend gasified to 550˚C; (c) Lignin in the blend gasified to 800˚C; (d) Coal in the blend gasified to 800˚C.
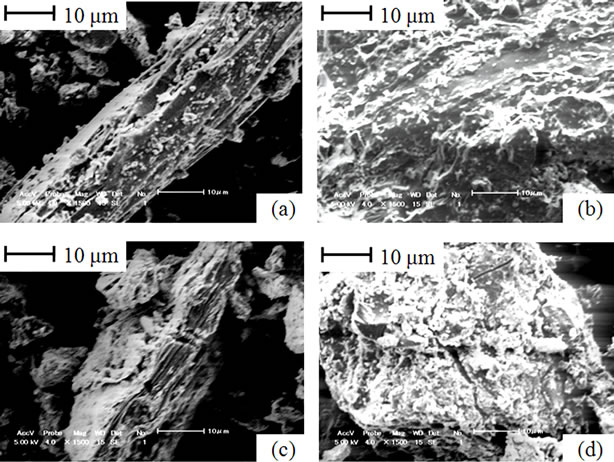
Figure 7. Particle surfaces from cellulose and coal blends; (a) Cellulose in the blend gasified to 550˚C; (b) Coal in the blend gasified to 550˚C; (c) Cellulose in the blend gasified to 800˚C; (d) Coal in the blend gasified to 800˚C.
4. Conclusion
Improved co-gasification conversion of cellulose or lignin with coal was observed in comparison to separate conversions for gasification of coal and gasification of cellulose or lignin. Two conversion synergy peaks were observed in their co-gasification characteristics, one extending from 300˚C to 550˚C and the other peak occurring above 800˚C for co-gasification of lignin with coal. During co-gasification of cellulose and coal, single synergy peak occurred between 350˚C and 450˚C. Synergy during co-gasification is contributed by the interactions between biomass volatiles and coal. Morphology investigation of partially gasified samples indicated that low reactivity of coal and lignin can be associated to their solid shapes maintained even at high temperature and higher conversion stages. Since gasification behavior of simulated biomass corresponds well to biomass gasification behavior, AAEM free chemical cellulose with high volatile suffices for investigation of volatile interaction phenomena while Na rich lignin chemical can be used to elucidate AAEM catalysis.
5. Acknowledgements
Authors express their gratitude to Monbukagakusho for funding this study. J. H. K. extends appreciation to University of Dar es Salaam for a study leave.
REFERENCES
- J. F. Vélez, F. Chejne, C. F. Valdés, E. J. Emery and C. A. Londoño, “Co-Gasification of Colombian Coal and Biomass in Fluidized Bed: An Experimental Study,” Fuel, Vol. 88, No. 3, 2009, pp. 424-430. doi:10.1016/j.fuel.2008.10.018
- T. Sonobe, N. Worasuwannarak and S. Pipatmanomai, “Synergies in Co-Pyrolysis of Thai Lignite and Corncob,” Fuel Processing Technology, Vol. 89, No. 12, 2008, pp. 1371-1378. doi:10.1016/j.fuproc.2008.06.006
- Q. Xu, S. Pang and T. Levi, “Reaction Kinetics and Producer Gas Compositions of Steam Gasification of Coal and Biomass Blend Chars, Part 1: Experimental Investigation,” Chemical Engineering Science, Vol. 66, No. 10, 2011, pp. 2141-2148. doi:10.1016/j.ces.2011.02.026
- C. Blasi, “Combustion and Gasification Rates of Lignocellulosic Chars,” Progress in Energy Combustion Science, Vol. 35, No. 2, 2009, pp. 121-140. doi:10.1016/j.pecs.2008.08.001
- W. Zhu, W. Song and W. Lin, “Catalytic Gasification of Char from Co-Pyrolysis of Coal and Biomass,” Fuel Processing Technology, Vol. 89, No. 9, 2008, pp. 890-896. doi:10.1016/j.fuproc.2008.03.001
- D. Lv, M. Xu, X. Liu, Z. Zhan, Z. Li and H. Yao, “Effect of Cellulose, Lignin, Alkali and Alkaline Earth Metallic Species on Biomass Pyrolysis and Gasification,” Fuel Processing Technology, Vol. 91, No. 8, 2009, pp. 903-909. doi:10.1016/j.fuproc.2009.09.014
- K. Mitsuoka, S. Hayashi, H. Amano, K. Kayahara, E. Sasaoaka and A. Uddin, “Gasification of Woody Biomass Char with CO2: The Catalytic Effects of K and Ca Species on Char Gasification Reactivity,” Fuel Processing Technology, Vol. 92, No. 1, 2011, pp. 26-31. doi:10.1016/j.fuproc.2010.08.015
- I. Suelves, M. J. La´zaro and R. Moliner, “Synergetic Effects in the Co-Pyrolysis of Coal and Petroleum Residues: Influences of Coal Mineral Matter and Petroleum Residue Mass Ratio,” Journal of Analytical and Applied Pyrolysis, Vol. 55, No. 1, 2000, pp. 29-41. doi:10.1016/S0165-2370(99)00072-8
- H. Haykiri-Acma and S. Yaman, “Interaction between Biomass and Different Rank Coals during Co-Pyrolysis,” Renewable Energy, Vol. 35, No. 1, 2010, pp. 288-292. doi:10.1016/j.renene.2009.08.001
- L. Salmén, “Micromechanical Understanding of the CellWall Structure,” Comptes Rendus Biologies, Vol. 327 No. 9, 2004, pp. 873-880. doi.org/10.1016/j.crvi.2004.03.010
- A. Gani and I. Naruse, “Effect of Cellulose and Lignin Content on Pyrolysis and Combustion Characteristics for Several Types of Biomass,” Renewable Energy, Vol. 32, No. 4, 2007, pp. 649-661. doi:10.1016/j.renene.2006.02.017
- H. Yang, R. Yan, H. Chen, D. H. Lee and C. Zheng, “Characteristics of Hemicellulose, Cellulose and Lignin Pyrolysis,” Fuel, Vol. 86, No. 12-13, 2007, pp. 1781-1788. doi:10.1016/j.fuel.2006.12.013
- R. Gottipati and S. Mishra, “A Kinetic Study on Pyrolysis and Combustion Characteristics of Oil Cakes: Effect of Cellulose and Lignin Content,” Journal of Fuel Chemistry and Technoology, Vol. 39, No. 4, 2011, pp. 265-270. doi:10.1016/S1872-5813(11)60021-2
- M. Carrier, A. Loppinet-Serani, D. Denux, J.-M. Lasnier, F. Ham-Pichavant, F. Cansell and C. Aymonier, “Thermogravimetric Analysis as a New Method to Determine the Lignocellulosic Composition of Biomass,” Biomass and Bioenergy, Vol. 35, No. 1, 2011, pp. 298-307. doi:10.1016/j.biombioe.2010.08.067
- H. Haykiri-Acma, S. Yaman and S. Kucukbayrak, “Comparison of the Thermal Reactivities of Isolated Lignin and Holocellulose during Pyrolysis,” Fuel Processing Technology, Vol. 91, No. 7, 2010, pp. 759-764. doi:10.1016/j.fuproc.2010.02.009
- M. Sagehashi, N. Miyasaka, H. Shishido and A. Sakoda, “Superheated Steam Pyrolysis of Biomass Elemental Components and Sugi (Japanese Cedar) for Fuels and Chemicals,” Bioresource Technology, Vol. 97, No. 11, 2006, pp. 1272-1283. doi:10.1016/j.biortech.2005.06.002
- H. Take, Y. Andou, Y. Nakamura, F. Kobayashi, Y. Kurimoto and M. Kuwahara, “Production of Methane Gas from Japanese Cedar Chips Pretreated by Various Delignification Methods,” Biochemical Engineering Journal, Vol. 28, No. 1, 2006, pp. 30-35. doi:10.1016/j.bej.2005.08.036

