American Journal of Analytical Chemistry
Vol.4 No.6(2013), Article ID:33428,5 pages DOI:10.4236/ajac.2013.46038
Method for Detecting NADPH-Cytochrome P450 Reductase in Liver Microsomal Fractions by Using Native Polyacrylamide Gel Electrophoresis and NADPH-Diaphorase Staining
Department of Internal Medicine, School of Medicine, Keio University, Shinanomachi Shinjukuku, Tokyo, Japan
Email: wdphq489@yahoo.co.jp
Copyright © 2013 Hirokazu Yokoyama et al. This is an open access article distributed under the Creative Commons Attribution License, which permits unrestricted use, distribution, and reproduction in any medium, provided the original work is properly cited.
Received April 18, 2013; revised May 19, 2013; accepted June 1, 2013
Keywords: NADPH-Cytochrome p450 Reductase; Native PAGE; NADPH-Diaphorase Staining; Chronic Ethanol Consumption
ABSTRACT
By combining native polyacrylamide gel electrophoresis (PAGE) and nicotinamide adenine dinucleotide phosphate (NADPH)-diaphorase staining, a simple method for detecting NADPH-cytochrome P450 reductase in tissue samples was established. When rat liver microsomal fractions were examined by this method, several bands with different mobility were visualized. Western blot analysis indicated that the band which appeared in the most anodal position among them represented NADPH-cytochrome P450 reductase. SDS-PAGE/Western blot analysis revealed that the molecular weight of the protein forming the band was around 80 kDa, which was identical to that of rat NADPH-cytochrome P450 reductase. The intensity level of NADPH-diaphorase staining assigned to this enzyme estimated by this method increased four times in microsomal fractions prepared from rat fed ethanol chronically compared to that from controls. When a dilution series of a rat liver microsomal fraction was examined by this method and SDS-PAGE/Western blot analysis, their staining intensities representing this enzyme were significantly correlated with each other. Using the naive PAGE/NADPH-diaphorase staining method, NADPH-cytochrome P450 reductase is detected in rat liver microsomes. This method is beneficial because compared with the conventional SDS-PAGE/Western blot analysis, the quantification of NADPH-cytochrome P450 reductase in tissue samples is allowed to be more easily done.
1. Introduction
Nicotinamide adenine dinucleotide phosphate (NADPH)- cytochrome P450 reductase (EC 1.6.2.4) is a microsomal flavoprotein expressed in various organs including liver [1]. It extracts electrons from NADPH and transfers them to various other microsomal cytochrome P450 enzymes which contribute to the metabolisms of steroids, heme groups, and xenobiotics in electron dependent manners [2,3]. Thus, it is important to know the condition of NADPH-cytochrome p450 reductase in each tissue for understating the dynamics of microsomal cytochrome P450 system in it.
In that NADPH-cytochrome P450 reductase which acts as an electron donor in the presence of NADPH, it should contribute to an electron dependent conversion of a soluble tetrazolium into insoluble and visible formazan in the presence of NADPH. Thus, NADPH-cytochrome P450 reductase can be detected in situ by this principle, i.e., NADPH-diaphorase staining [4]. However, NADPH-cytochrome P450 reductase is not an exclusive NADPH dependent electron donor. In some tissues, this enzyme and the other ones acting as NADPH dependent electron donors are co-expressed. For specifically detecting the former by NADPH-diaphorase staining in such tissues, it must be distinguished from the others.
The aim of this study was to establish a specific and simple method for detecting NADPH-cytochrome P450 reductase in liver microsomes based on NADPH-diaphorase staining. To that effect, it was first separated from the other NADPH dependent electron donors expressed in liver microsomes, including nitric oxide (NO) synthase (EC 1.14.13.39) and quinone oxidoreductase (DT-diaphorase, EC 1.6.99.2), which have been also shown to be detected by NADPH-diaphorase staining [5,6]. To this end, native polyacrylamide gel electrophoresis (native PAGE) were combined with NADPH-diaphorase staining.
2. Materials and Methods
2.1. Preparation of Rat Liver Microsomal Fractions
Wistar male rats weighing 200 g were purchased from CLEA Japan, Inc. (Saitama, Japan). Liver tissues were removed from them under anesthesia, and then placed in 5 volumes of 50 mM HEPES buffer (pH 7.0) containing 320 mM sucrose, 1 mM EDTA, 1 mM DL-dithiothreitol, 100 μg/ml phenyl methyl sulfonyl fluoride, 10 μg/ml leupeptin, 100 μg/ml soybean trypsin inhibitor, and 2 μg/ml aprotinin (all from Sigma-Aldrich Japan Inc, Tokyo, Japan). After sonication for 10 s on ice, each sample was centrifuged at 15,000 × g. The supernatants comprising the microsomal fractions were removed and stored at –80˚C to maintain protein stability.
2.2. Native PAGE Followed by NADPH-Diaphorase Staining
Protein concentrations in the stored samples were estimated with the Lowry method (TP0200; Sigma-Aldrich Japan). Fifty g of their aliquots were subjected to electrophoresis on a native polyacrylamide gel (%T = 7.5; 380 mM Tris-HCl [pH 8.8]) with a native polyacrylamide stacking gel (%T = 3.8; 150 mM Tris-HCl [pH 6.8]) at 50 V for 1 h in 25 mM Tris-200 mM glycine (pH 8.0) at 4˚C. The gel was then immersed in a solution of 50 mM Tris-HCl (pH 8.0), freshly prepared 2 mM β-NADPH (Sigma-Aldrich Japan), and 1 mM nitroblue tetrazolium (Sigma-Aldrich Japan), and incubated for 1 h at 37˚C in the dark. The reaction was stopped by washing the gel in distilled water.
2.3. Western Blot Analysis from Native Polyacrylamide Gel
After the native PAGE was performed as described above, the proteins were transferred from the gel to a nitrocellulose membrane (Bio-Rad Laboratories Inc, Hercules, CA, USA) by using a semi-dry blotting apparatus (Bio-Rad Laboratories) with a transfer buffer containing 25 mM Tris-190 mM glycine (pH 8.3) and 20% (v/v) methanol. The membrane was incubated in blocking solution (5% [w/v] skimmed milk, 0.01 M phosphate buffer saline [PBS; pH 7.4]) for 1 h at room temperature. Polyclonal antibody against NADPH-cytochrome P450 reductase derived from rabbit (StressGen, Victoria, BC, Canada) was added at a final dilution of 1:1000 and the incubation was continued for 1 h at room temperature. After being rinsed with PBS containing 0.1% (v/v) Tween-20 (Sigma-Aldrich Japan), the membrane was incubated with a final dilution of 1:1000 anti-rabbit IgG goat antibody conjugated with horseradish peroxidase (Dako Japan Co., Tokyo, Japan) in PBS for 30 min at room temperature and rinsed with 50 mM Tris-HCL (pH 8.0). The immune reaction was visualized by incubating the membrane in a solution of 0.05% (w/v) diaminobenzidine (DAB; Sigma-Aldrich Japan), 50 mM Tris-HCL (pH 8.0), and 0.001% (v/v) H2O2. After 10 min, the peroxidase reaction was stopped by washing the membrane with distilled water.
2.4. The Molecular Weight of the Protein Representing NADPH-Cytochrome P450 Reductase
Liver microsomal fractions were applied to two sets of native polyacrylamide gels with identical sizes, and PAGE was performed simultaneously. One of them was subjected to the NADPH-diaphorase staining. The area of the unstained gel that was equivalent to the band representing NADPH-cytochrome P450 reductase in the stained gel was removed and dialysed in PBS at 4˚C overnight in a firm dialysis bag (molecular weight cut-off, 25 kD; Spectra/Por, Spectrum Japan, Tokyo, Japan). An aliquot of the extract solution containing the eluted protein was combined with sodium dodecylsulphate (SDS)-sample buffer to a final concentration of 31.25 mM Tris-HCl (pH 6.8), 0.5% (w/v) SDS, 0.0005% (w/v) bromphenol blue, 5% (v/v) glycerol, and 2.5% (v/v) β-mercaptoethanol (all from Sigma-Aldrich Japan Inc., and the mixture was heated at 90˚C for 5 min. The sample was then subjected to SDS-PAGE; the components of gel and electrophoresis buffer were identical to those described above for native PAGE except that they contained 0.1% (w/v) SDS. Western blot analysis was then performed as described above, and the molecular weight of the detected band was determined relative to the molecular weight markers (MP-1110, Sigma-Aldrich Japan Inc.).
2.5. Effects of Chronic Ethanol Feeding on Liver Microsomal NADPH-Cytochrome p450 Reductase
Rats were chronically fed ethanol according to the standard ethanol pair-feeding method established by Lieber et al. [7]. Liver microsomal fractions were prepared from both groups and applied to the native PAGE/NADPHdiaphorase staining method. Gel images were incorporated into a personal computer (Power Macintosh 8500/ 132, Apple Japan Inc., Tokyo, Japan) via an image scanner (JX-250, Sharp Inc., Tokyo, Japan). The staining intensities of bands were quantitated by using an image analyzing software (NIH image version 1.58, NIH, Bethesda, MD).
2.6. The Relationship between Protein Amount and NADPH-Diaphorase Staining Intensity of the NADPH-Cytochrome P450 Reductase
A dilution series was established from the liver microsomal fraction of a rat fed ethanol chronically. Each sample was subjected to the native PAGE/NADPH diaphorase staining as well as SDS-PAGE/Western blot analysis using a specific antibody to NADPH-cytochrome P450 reductase as described above. The staining intensities of bands obtained by the two methods were quantified also as described above.
2.7. Statistical Analyses
Statistical analyses were performed by a software for statistics (StatView, version J-4.5, Abacus Concept Inc., CA). Differences between two groups were assessed by Student’s t-test. Correlations between two variables were assessed by linear regression analyses. Data are expressed as mean ± SD.
3. Results
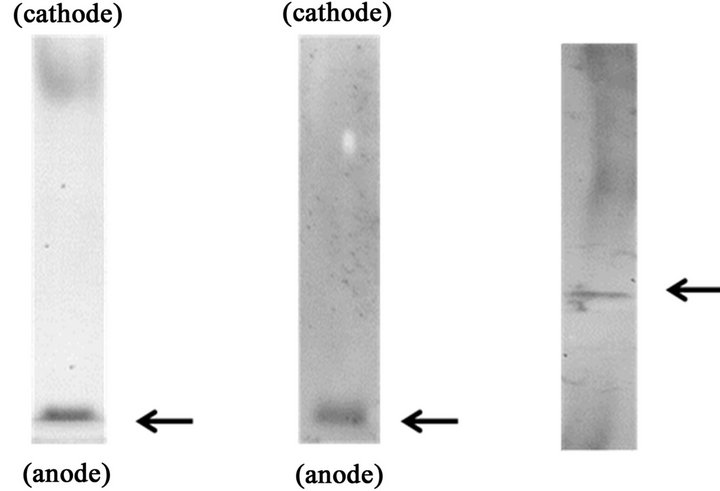
When microsomal fractions prepared from rat livers were subjected to native PAGE followed by NADPH-diaphorase staining, several bands with different mobility including a prominent one appeared in the most anodal position (arrow) were visualized (Figure 1(a)). Western blot analysis following native PAGE revealed that a specific antibody to NADPH-cytochrome P450 reductase reacted with a prominent band appeared in the most anodal position (arrow, Figure 1(b)). When this protein was extracted from the gel and subjected to SDS-PAGE/Western blot analysis, its molecular weight was shown to be around 80 kDa (arrow, Figure 1(c)).
By using the native PAGE/NADPH-diaphorase staining method, we then examined levels of NADPH-diaphorase staining assigned to NADPH-cytochrome P450 re-
 (a) (b) (c)
Figure 1. Detection of NADPH-cytochrome P450 reductase in rat microsomal fraction by the native PAGE/NADPH-diaphorase staining method.
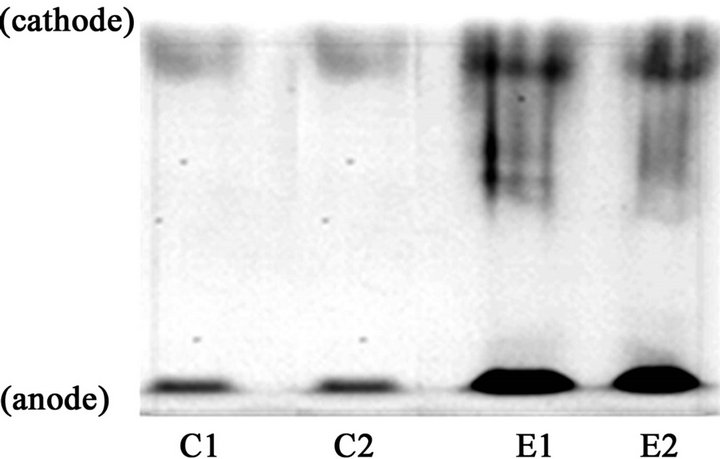
ductase in liver microsomal fractions prepared from rats fed ethanol chronically and controls (Figure 2(a)). Liver microsomal fractions prepared from rats fed ethanol chronically (E) and controls (C) were examined by the Native PAGE/NADPH-diaphorase staining method. The intensities of NADPH-diaphorase staining representing NADPHcytochrome P450 reductase in the former were apparently higher than those of the latter. An image of each band assigned to NADPH-cytochrome P450 reductase was drawn using computer graphics in the NIH image program (Figure 2(b)). The integration of areas under the curves assigned to each sample was designated as its intensity of NADPH-diaphorase staining. The level in liver microsomal fractions prepared from rats fed ethanol chronically ((12.4 +/− 0.7) × 104 counts) was significantly higher than that from controls ((3.1 +/− 0.2) × 104 counts; n = 5, p < 0.0001).
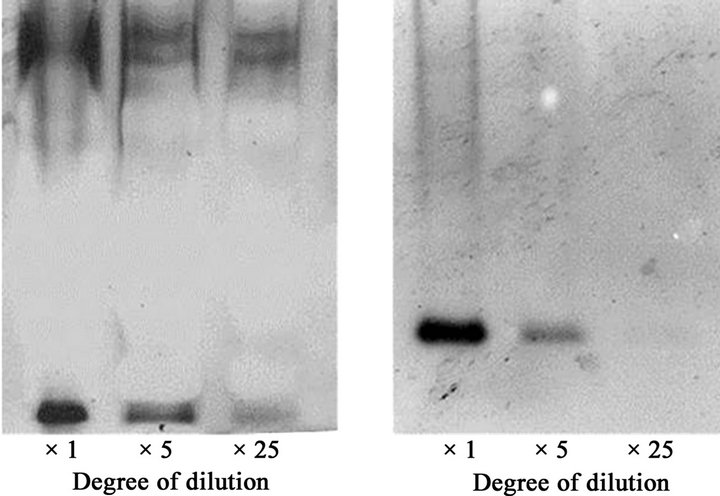
We then created a dilution series of a liver microsomal raction of an ethanol-fed rat and it was subjected to the native PAGE/NADPH-diaphorase staining method (Figures 3(a)) as well as SDS-PAGE/Western blot analysis with a specific antibody against NADPH-cytochrome P450 reductase. As the samples were diluted, intensities of staining assigned to NADPH-cytochrome p450 reductase (Figure 3(b)) obtained by both methods became weaker. Their staining intensities were densitometrically quantified using the NIH image program and they were shown to be well correlated with each other (R2 = 0.868; Figure 3(c)).
 (a)
(a)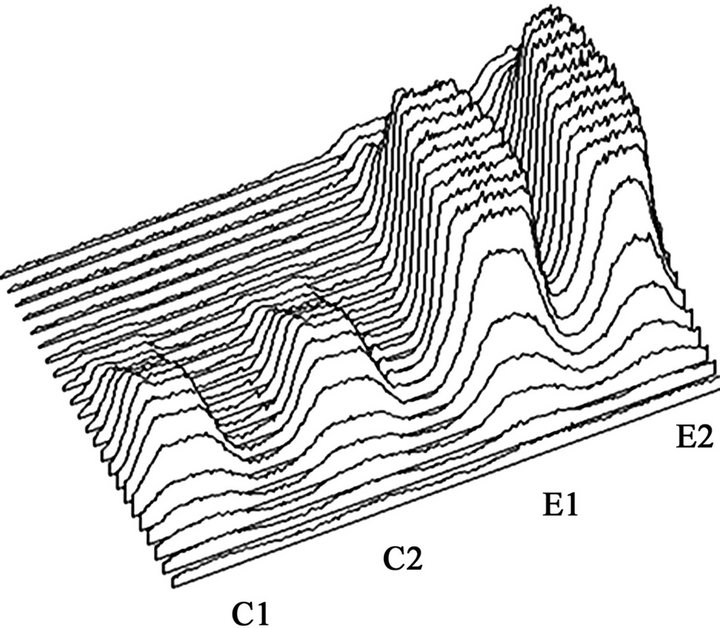 (b)
(b)
Figure 2. Induction of NADPH-cytochrome P450 reductase in liver microsomes after chronic ethanol consumption detected by the native PAGE/NADPH-diaphorase staining method.
 (a)
(a)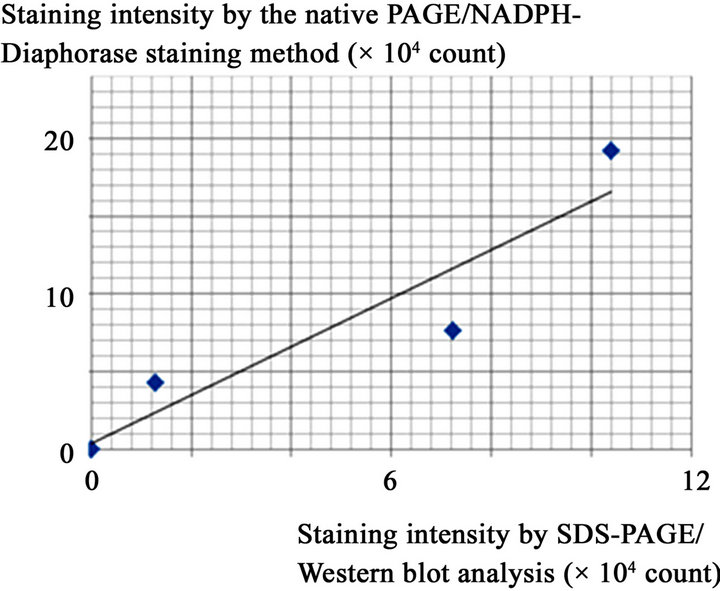 (b)
(b)
Figure 3. The relationship between protein amount and intensity of NADPH-diaphorase staining of the NADPH-cytochrome P450 reductase.
4. Discussion
A new method based on native PAGE and NADPH-diaphorase staining for detecting NADPH-cytochrome P450 reductase in liver microsomes was established.
Furthermore, using this method, the induction of NADPH-cytochrome P450 in liver microsomes in rats fed ethanol chronically was successfully demonstrated.
It is well established that NADPH-cytochrome P450 reductase can be detected in situ by the NADPH-diaphorase staining [4]; however, it is also well known that NADPHcytochrome P450 reductase is not an exclusive enzyme visualized by NADPH-diaphorase staining. As expected, several bands with different mobility were observed when rat liver microsomal samples were examined by the native PAGE/NADPH-diaphorase staining method. Western blot analysis with a specific antibody against NADPHcytochrome P450 reductase indicated that the band appeared in the most anodal position among them represented NADPH-cytochrome P450 reductase. Furthermore, molecular weight of the protein constructing this band was shown to be 80 kDa, by SDS-PAGE/Western blot analysis, identical to that of rat NADPH-cytochrome P450 reductase [8].
It is most likely that the other bands visualized by the native PAGE/NADPH-diaphorase staining method attributed to the other microsomal NADPH dependent electron donors, such as NO synthase and DT diaphorase. Indeed, they have been also known to be detected by NADPHdiaphorase staining [5,6]. Although they were not visualized as clear bands under the current conditions, its refinement might enable clearer detection. Nanji et al. [9] suggest that NADPH-diaphorase staining represents NO synthase activity in rat livers; however, in consideration of the present observations, we believe that microsomal NADPH-cytochrome P450 reductase cannot be ignored as a source of NADPH-diaphorase activity in the liver.
The native PAGE/NADPH-diaphorase staining method successfully demonstrates the induction of NADPH-cytochrome P450 reductase in liver microsomal fractions in rats fed ethanol chronically. Its 4-fold induction in their liver microsomes is consistent with previous results obtained with a spectrophotometric method [10]. We assume that this induction in ethanol fed rats meets an increased demand for electrons by microsomal cytochrome P450 2E1, which is induced after ethanol consumption and oxidizes ethanol by an electron dependent manner.
The intensity of NADPH-diaphorase staining assigned to NADPH-cytochrome P450 reductase obtained by the present native PAGE/NADPH-diaphorase staining method was shown to be significantly correlated with the protein amount estimated by SDS-PAGE/Western blotting analysis. This indicates that the present method is applicable for quantitative analyses of NADPH-cytochrome P450 in the other tissue.
The great advantage of the present method is its simplicity compared to conventional SDS-PAGE/Western blot analysis. First, protein transfer is not necessary in the present method because NADPH-diaphorase staining can be directly achieved on the native polyacrylamide. Second, the time for visualizing NADPH-cytochrome P450 reductase protein is significantly reduced because NADPH-diaphorase staining requires just one step whereas staining based on an immune reaction in a Western blot analysis requires multiple steps. Third, the method does not require a specific antibody against NADPH-cytochrome P450, being beneficial for examining NADPH-cytochrome P450 reductase in multiple species or in species for which a specific antibody to NADPH-cytochrome P450 reductase is not available.
In conclusion, we have established a new quantitative method for detecting NADPH-cytochrome P450 reductase based on native PAGE and NADPH-diaphorase staining. The present method can successfully demonstrate the induction of NADPH-cytochrome P450 reductase in the liver microsomal fraction of rats fed ethanol chronically. Because of its specificity and simplicity, this method has advantages for estimating NADPH-cytochrome P450 reductase levels when compared with SDS-PAGE/ Western blot analysis.
REFERENCES
- A. Shen and C. B. Kasper, “Mechanistic Studies on the Reductive Half-reaction of NADPH-Cytochrome P450 Oxidoreductase,” In: J. B. Schenknan and H. Greim, Eds., Handbook of Experimental Pharmacology, Springer-Verlag Inc., New York, 1933, pp. 35-59.
- B. S. Masters and C. C Marohnic, “Cytochromes P450— A Family of Proteins and Scientists-Understanding Their Relationships,” Drug Metabolism Reviews, Vol. 38, No. 1-2, 2006, pp. 209-225. doi:10.1080/03602530600570065
- D. L. Roerig, L. Mascaro and S. D. Aust Jr., “Microsomal Electron Transport: Tetrazolium Reduction by Rat Liver Microsomal NADPH-Cytochrome c Reductase,” Archives of Biochemistry and Biophysics, Vol. 153, No. 2, 1972, pp. 475-479. doi:10.1016/0003-9861(72)90365-7
- P. J. Norris, J. P. Hardwick and P. C. Emson, “Localization of NADPH Cytochrome P450 Oxidoreductase in Rat Brain by Immunohistochemistry and in Situ Hybridization and a Comparison with the Distribution of Neuronal NADPH-Diaphorase Staining,” Neuroscience, Vol. 61, No. 2, 1994, pp. 331-350. doi:10.1016/0306-4522(94)90235-6
- B. T. Hope, G. J. Michael, K. M. Knigge and S. R. Vincent, “Neuronal NADPH Diaphorase Is a Nitric Oxide Synthase,” Proceedings of National Academy Science of the USA, Vol. 88, No. 7, 1991, pp. 2811-2814. doi:10.1073/pnas.88.7.2811
- M. Belinsky and A. K. Jaiswal, “NAD(P)H:quinone Oxidoreductase1 (DT-Diaphorase) Expression in Normal and Tumor Tissues,” Cancer and Metastasis Reviews, Vol. 12, No. 2, 1993, pp. 103-117. doi:10.1007/BF00689804
- C. S. Lieber, D. P. Jones and L. M. Decarli, “Effects of Prolonged Ethanol Intake; Production of Fatty Liver Despite Ad-Equate Diets,” The Journal of Clinical Investigation, Vol. 44, No. 6, 1965, pp. 1009-1021. doi:10.1172/JCI105200
- J. D. Dignam and H. W. Strobel, “NADPH-Cytochrome p-450 Reductase from Rat Liver: Purification by Affinity Chromatography and Characterization,” Biochemistry, Vol. 16, No. 6, 1997, pp. 1116-1123.
- A. A. Nanji, S. S. Greenberg, S. R. Tahan, F. Fogt, J. Loscalzo, S. M. Sadrzadeh, J. Xie and J. S. Stamler, “Nitric Oxide Production in Experimental Alcoholic Liver Disease in the Rat: Role in Protection from Injury,” Gastroenterology, Vol. 109, No. 3, 1995, pp. 899-907. doi:10.1016/0016-5085(95)90400-X
- J. G. Joly, H. Ishii, H. R. Teschke, Y, Hasumura and C. S. Lieber, “Effect of Chronic Feeding on the Activities and Submicrosomal Distribution of Reduced Nicotinamide Adenine Dinucleotide Phosphate-Cytochrome P-450 Reductase and the Demethylases for Aminopyrine and Ethylmorphine,” Biochemical Pharmacology, Vol. 22, No. 12, 1973, pp. 1532-1535. doi:10.1016/0006-2952(73)90334-1