American Journal of Analytical Chemistry
Vol.4 No.5(2013), Article ID:31703,6 pages DOI:10.4236/ajac.2013.45031
Determination of Ketoprofen in Human Plasma by RP-HPLC
1Department of Pharmaceutics, Faculty of Pharmacy, University of Karachi, Karachi, Pakistan
2Department of Pharmaceutical Chemistry, Faculty of Pharmacy, University of Karachi, Karachi, Pakistan
3Ziauddin College of Pharmacy, Ziauddin University, Karachi, Pakistan
Email: *farya_ceutics@yahoo.com
Copyright © 2013 Farya Zafar et al. This is an open access article distributed under the Creative Commons Attribution License, which permits unrestricted use, distribution, and reproduction in any medium, provided the original work is properly cited.
Received March 12, 2013; revised April 15, 2013; accepted May 1, 2013
Keywords: RP-HPLC; Ketoprofen; Linearity; Accuracy; Precision; Specific
ABSTRACT
For in vivo pharmacokinetic studies, it is pre-requisite to quantify drug concentrations in plasma. In the present study a RP-HPLC procedure was developed and validated for the assessment of ketoprofen in human plasma. For this purpose mobile phase consisting of methaol:water (70:30) adjusted to pH 3.3 with phosphoric acid was used, and chromatography was carried out on Discovery HS C18 column, 5 μm (25 cm × 4.6 mm). The flow rate was 1 mL·min−1 and quantitative assessment was performed at 260 nm. The retention time was found to be <10 min. A method was found to be accurate and illustrated linearity from 0.2441 to 125 μg·mL−1 with the determination coefficient (r2) of 0.9999, also accuracy and precision were found to be <2 (%RSD). The intraday accuracy for concentrations 62.5 μg·mL−1, 15.625 μg·mL−1, 7.812 μg·mL−1 and 1.953 μg·mL−1 were found to be 99.747%, 99.475%, 98.457% and 99.824% respectively where as for interday accuracy consecutive values for days 1, 2 and 3 were 99.104%, 99.091%, 98.96% and 99.385% in plasma. All validation parameters were assessed and were found to be within the limits. The proposed method was accurate, specific, quick (retention time < 10 min), selective (showed no interference with excipients), cost effective and a good resolution which gave this method an advantage over the different other reported methods for the estimation of ketoprofen in human plasma.
1. Introduction
Ketoprofen [2-(3-benzoylphenyl) propionic acid] is a non-steroidal anti-inflammatory and analgesic compound (NSAID) (Figure 1) used in the management of osteoarthritis. It decreases joint swelling in patients with rheumatoid arthritis [1]. It was also compared with other nonsteroidal anti-inflammatory compounds like, Ibuprofen, Aspirin and Indomethacin [2,3]. Ketoprofen is widely used in different conditions particularly, in epicondylitis, frozen shoulder and tendonitis [2].
Different methods have been developed and validated which were adequately sensitive to assess the concentrations of NSAID’s in serum [4]. There are various literatures, which reported the quantitative assessment of ketoprofen in various pharmaceutical formulations. Different scientists reported fast flow-injection technique for the analysis of ketoprofen in pharmaceuticals. The limit of detection (LOQ) and the limit of quantification (LOQ) were 1.7 × 10⁻⁶ M and 5.3 × 10⁻⁶ M respectively [5]. Different authors also reported special techniques i.e. microdialysis or open-flow microperfusion which were used in the pharmacokinetic studies of ketoprofen [6]. The above methods are not appropriate for the routine utilization in pharmacokinetic testing due to less availability of equipments and special sample preparation. In the present study a simple and sensitive RP-HPLC method has been proposed for the simultaneous estimation of ketoprofen in tablet formulation and plasma as this method would facilitate more efficient generation of pharmacokinetic data at low cost. Also the low values of LOD and LOQ merit this method to be used in clinical samples.
2. Experimental
2.1. Chemicals and Regents
USP reference standard of ketoprofen was gifted by (Aventis Pharma (Pvt.) Ltd) and Methanol and phospho-
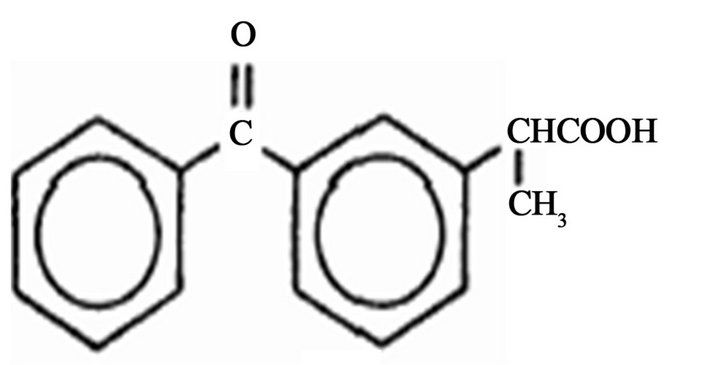
Figure 1. Chemical structure of ketoprofen.
ric acid were obtained from (Merck, Damstadt, Germany). For deionization of water, Deionizer (Elga, Highwycombe, England) was used. All the reagents and chemicals were of analytical grade.
2.2. Standard and Working Solutions
A standard solution of 0.05% of ketoprofen was prepared in the mobile phase. Working solutions were prepared by making dilutions in the same solvent.
2.3. Procedure for Tablet Formulation
Nine different formulations of fast dispersible ketoprofen 100 mg tablets were developed. Different physicochemical tests were performed. All the results were within the acceptable limits. Formulation 6 was selected as the best formulation [7]. Twenty tablets (fast dispersible) containing 100 mg of ketoprofen were accurately weighed and crushed, an amount equivalent to 100 mg of ketoprofen were transferred to 100 ml volumetric flasks, samples were then dissolved and diluted to the required concentrations (with mobile phase). Samples were then filtered through 0.45 μm filter paper. A placebo tablet was also subjected to the method as described above to study the possibility of raw material intervention in the analysis.
2.4. Procedure for Plasma Drug Analysis
From the human volunteers, plasma samples were collected and stored. Protein was separated using plasma and acetonitrile in a ratio of 1:1; this mixture was then vortex for 10 minutes, centrifuged at 3000 rpm for 10 min. Supernatant was then filtered by 0.45 μ membrane filter. The obtained plasma was then used to produce the desired concentrations. These samples were stored at −20˚C for the testing.
2.5. Instrumentation and Chromatographic Conditions
High Performance Liquid Chromatographic system (LC 20A, Shimadzu Corp, Japan), with a pump (LC 20A, Shimadzu Corp, Japan), Communication Bus Module (CBM 102, Shimadzu Corp, Japan) and spectrophotometric detector (SPD-20A, Shimadzu Corp, Japan) with a PentiumTM IV PC loaded with Class GC software (GC 20, Shimadzu Corp, Japan) for results attainment. Mobile phase consisted of methanol:water in the ratio of (70:30 v/v) with pH adjusted to 3.3 with phosphoric acid, filtered through 0.45 μm (Millipore, England) and degassed. HPLC was attached with guard column C18 and Discovery HS C18 column, 5 μm (25 cm × 4.6 mm) was used. The flow rate was 1 mL·min−1 and the detector was set at 260 nm and the injection volume was 20 μL. In addition, analytical balance (Mettler Toledo B204-S, Switzerland), pH meter (370 pH meter, Jenway, Europe), microlitre syringe (Hamilton, Switzerland), swinney membrane filter (Millipore, England), vortex mixer (Whirl Mixer, England), centrifuge (Hereues, Osterode, Germany) and sonicator (LC20H) was used.
2.5.1. Method Development
In order to choose the most appropriate mobile phase for the separation of ketoprofen isocratic elution was used. The procedure was optimized by changing the composition of the mobile phase, pH and the flow rate. Initially, different mobile phases were studied which were resulted in broader peaks and long retention time. The excellent resolution and optimal retention were achieved when methanol:water (70:30) was used with pH adjusted to 3.3 with phosphoric acid.
2.5.2. Validation Procedure
In the present research work we studied various parameters i.e., system suitability, specificity, linearity, accuracy, precision, limit of detection and quantitation, robustness and ruggedness, freeze and thaw stability and long term stability of ketoprofen according to the ICH Q2B [8] guidelines.
For system suitability we injected five replicates of 1.953 μg·mL−1. These five consecutive injections were used to assess the system suitability on each method validation day. Different parameters such as tailing factor (<2), peak area, theoretical plates (>3000) were found to be satisfactory.
Specificity distinguishes between the analyte and other constituents present in the sample [9]. Therefore, in order to estimate interference of mobile phase and excipients used in tablet formulation, specificity was assessed by injecting samples of active ingredient, tablet formulation and human plasma.
Calibration curve was determined by plotting the peak area against injected concentrations [9]. Linearity of the method was estimated at ten different concentrations that were ranged from 0.244 to 125 μg·mL−1.
Accuracy of the procedure is the closeness in the actual and nominal data obtained which was estimated by recovery method [10]. The accuracy of the method was determined at three different levels in bulk material i.e. 62.5 μg·mL−1, 3.906 μg·mL−1 and 1.953 μg·mL−1. Accuracy of the method in tablet formulation was also evaluated by the analysis of three concentrations i.e. 62.5 μg·mL−1, 31.25 μg·mL−1 and 15.625 μg·mL−1. Also mean percent recovery was determined in the study. Similarly, relative analytical recovery was estimatedfor concentrations 31.25 μg·mL−1, 7.812 μg·mL−1 and 3.906 μg·mL−1.
Inter-day precision was carried out by analyzing four different concentrations on three days consecutively. Similarly, intra-day precision was performed by analyzing ten replicate injections of four concentrations. Method ruggedness was estimated with two different instruments in two different laboratories. Lab 1 was in the Ziauddin College of Pharmacy, Ziauddin University and Lab 2 was in the Department of Pharmaceutics, Faculty of Pharmacy, University of Karachi.
3. Results and Discussion
For the determination of drugs, development of HPLC method has received significant attention in current years in routine drug analysis. Generally, HPLC method needs complicated and costly instruments, difficult sample preparation methods and disposal of solvents [11]. The aim of the present study was to develop a more perfect, accurate and less time consuming method for the estimation of ketoprofen in human plasma using the C-18 column with UV detector.
3.1. Method Development
For achieving the best condition of the method, different ratios of MeOH:Water (50:50 v/v, 60:40 v/v) was tried. It was found that the above ratios of methanol and water were resulted in long retention time and poor resolution. But MeOH:Water (70:30 v/v) gave the excellent results. The assessment was carried out on a Discovery HS C18 column, 5 μm (25 cm × 4.6 mm), using the mobile phase of 70:30 v/v MeOH:Water and pH was adjusted to 3.3 with phosphoric acid which provides significant and reproducible separation of the constituents. The flow rate was 1 mL·min−1 and retention time was <10 min which is significant for routine drug analysis. The eluent was observed at 260 nm. The advantages of the proposed procedure are simplicity of operation, analysis time (<10 min), use of cost effective solvents and no interferences with good limit of detection to facilitate pharmacokinetic analysis of ketoprofen.
3.2. Method Validation
In the present study the method was developed and validated for the estimation of ketoprofen compound in human plasma. According, to the guidelines of ICH Q2B [8], different parameters such as linearity, precision, accuracy, specificity, system suitability, freeze and thaw stability and long term stability of ketoprofen.
3.2.1. System Suitability
System suitability tests were percentage relative standard deviation (RSD) of peak area, retention time, tailing factor and theoretical plates. All the parameters were found to be within the range (Tables 1 and 2). Above parameters were measured by Class-GC10 software (version 2.00).
3.2.2. Specificity
Figures 2 and 3 indicated that the method was free of interference in the existence of excipients which showed that the procedure is specific for ketoprofen.
3.2.3. Linearity
In the present study we injected the known concentrations of ketoprofen in plasma i.e. 125 μg·mL−1, 62.5 μg·mL−1, 31.25 μg·mL−1, 15.625 μg·mL−1, 7.812 μg·mL−1, 3.906 μg·mL−1, 1.953 μg·mL−1, 0.976 μg·mL−1, 0.488 μg·mL−1 and 0.244 μg·mL−1. Table 3 presents the regression statistics of known concentration analytical response, calibration curve was constructed in the range of (0.244 to 125 μg·mL−1) and was found to be linear. The slope, intercept and the determination coefficient was also estimated. Good linearity was obtained with correlation coefficients (r2 = 0.9999) (Figure 4).
3.2.4. Accuracy
Accuracy was described as %relative error between the measured average concentrations and taken concentrations. Data corresponding to the accuracy of the method in bulk material and in tablet formulation were presented
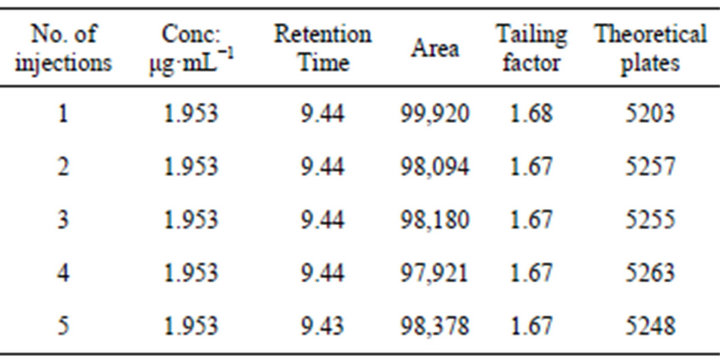
Table 1. Parameters of system suitability.
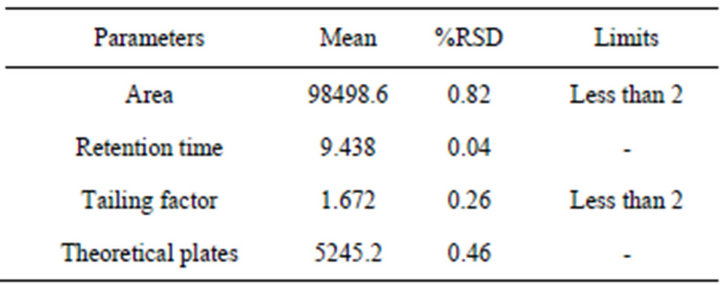
Table 2. System suitability results.

Table 3. Linearity of the method in plasma.
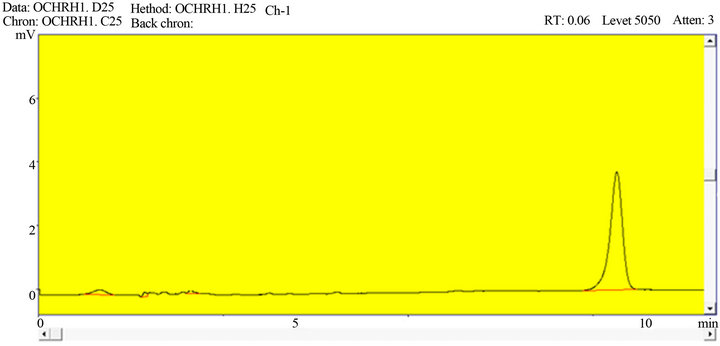
Figure 2. A representative chromatogram of ketoprofen in bulk material.
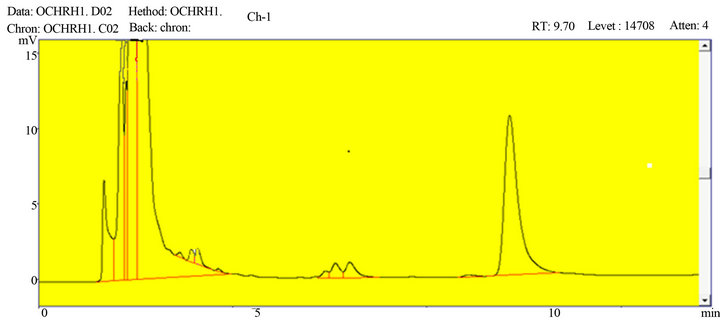
Figure 3. A representative chromatogram of ketoprofen in human plasma.
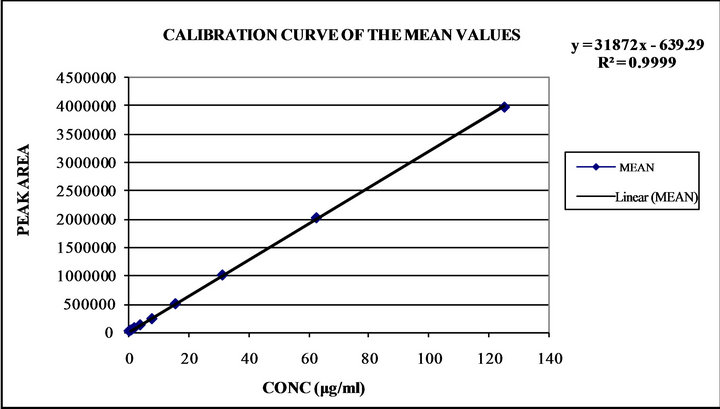
Figure 4. Linearity curve of ketoprofen in plasma.
in Tables 4(a) and (b), the %recovery were ranged from 98.608% to 101.587% in bulk material and 99.36% to 99.99% in tablet formulation, the obtained results provided the verification for the method accuracy. Similarly, the values of relative analytical recovery were ranged from 98.869% to 99.277% (Table 5). Results showed that there is no important difference between the concentration of drug spiked in human plasma and the concentration recovered. Thus, plasma showed no interference with the estimation.
3.2.5. Limit of Detection and Quantitation
For the estimation of LOD of this method, concentration of 0.122 μg·mL−1 was injected several times in plasma and was considered as LOD. Since the calibration curve was examined from 0.244 to 125 μg·mL−1, the former concentration was considered as LOQ (Table 3).
3.2.6. Precision
Day to day and with in a day precision evaluation was

Table 4. (a) Accuracy of the method for ketoprofen; (b) Accuracy of the method for ketoprofen in tablet formulation.
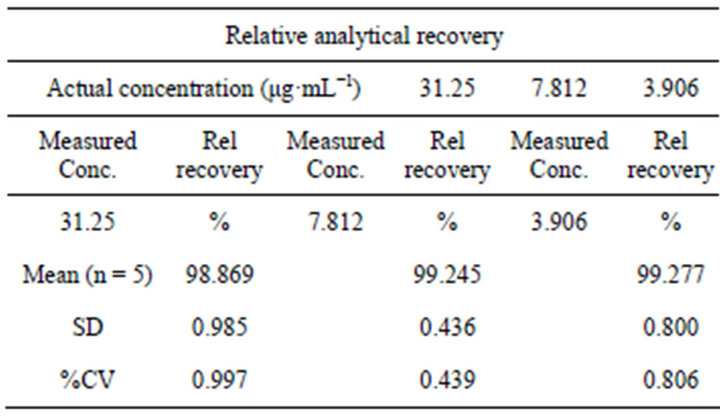
Table 5. Relative analytical recovery of the method in plasma.
carried out by injecting concentrations of 62.5 μg·mL−1, 15.625 μg·mL−1, 7.812 μg·mL−1 and 1.953 μg·mL−1, mean, SD, CV (%) were determined as shown in Table 6. The results indicated that the values were found to be in acceptable limits and the method was found significantly accurate and precise.
3.2.7. Ruggedness
The ruggedness was found by estimating ketoprofen using the identical column on two different instruments on different labs. This method did not indicate any notable difference in results from the limits.
3.2.8. Robustness
Robustness was analyzed after deliberate variations in pH and flow rate. It was determined that %RSD values did not exceed > than 2%.
3.2.9. Freeze and Thaw Stability
Freeze and thaw stability were also carried out for five samples of 1.953 μg·mL−1 as low concentration and same number of samples for 15.625 μg·mL−1 as high concentration which were subjected to three freeze thaw cycles. There mean, SD and %CV were determined and presented in (Table 7).
3.2.10. Long Term Stability
The long term stability was also evaluated for low 1.953 μg·mL−1 and high concentrations of 15.625 μg·mL−1. The %CV of fresh samples for 1.953 μg·mL−1 was 0.058% and 0.007% for 15.625 μg·mL−1. After 2 and 3 weeks storage period at −20˚C, %CV were determined to be 0.085% and 0.084% for low and 0.353% and 0.160% for high concentrations (Table 8).
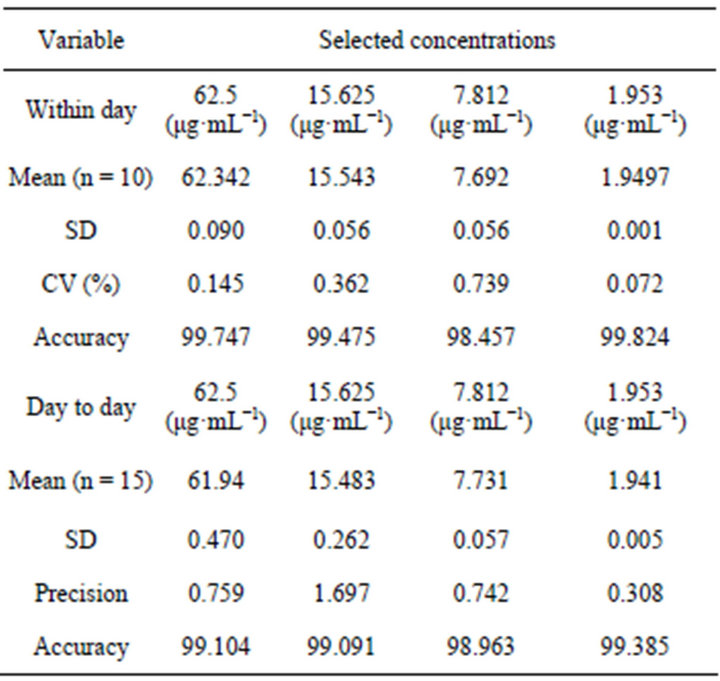
Table 6. Precision of the method for ketoprofen in plasma.
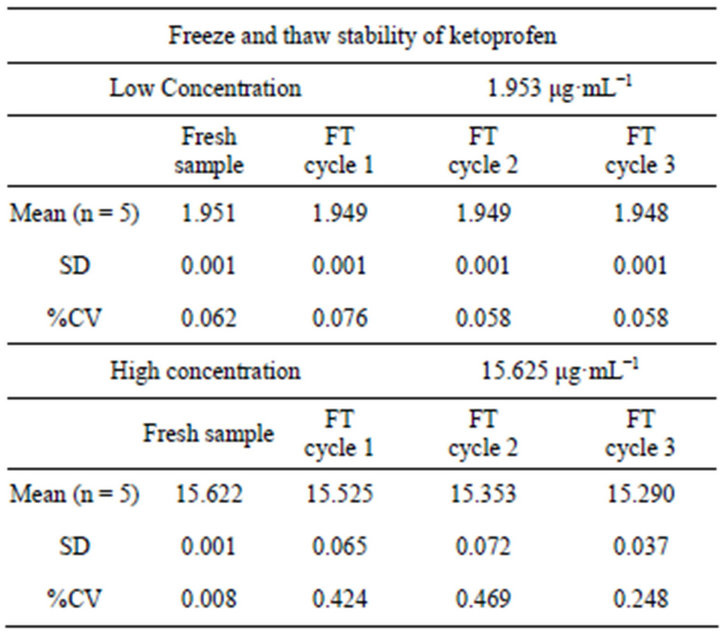
Table 7. Freeze and Thaw stability of ketoprofen.
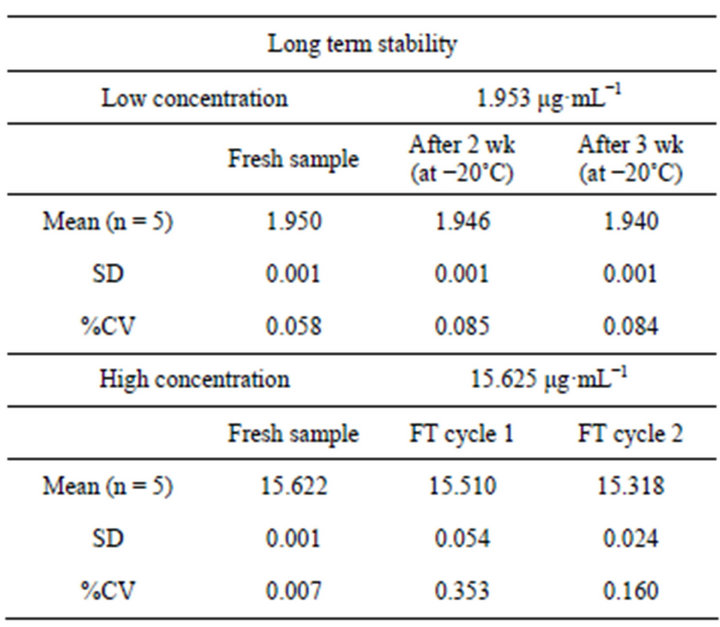
Table 8. Long term stability of ketoprofen.
4. Conclusion
This proposed RP-HPLC method was appropriate for the determination of ketoprofen in raw materials and tablet formulations and it could also be used for human plasma. This method was easy, specific and less time consuming. Also, this method could be used for pharmacokinetic testing of the drug.
REFERENCES
- S. C. Dollery, “Therapeutic Drugs,” Churchill Livingstone, Philadelphia, 1991, pp. 25-26.
- J. Fossgreen, “Ketoprofen: A Survey of Current Publications,” Scandinavian Journal of Rheumatology, Vol. 5, Suppl. 14, 1976, pp. 7-32.
- J. R. Caldwell, B. F. Germain and S. H. Lourie, “Ketoprofen versus Indomethacin in Patients with Rheumatoid Arthritis: A Multicenter Double Blind Comparative Study,” Journal of Rheumatology, Vol. 15, No. 10, 1988, pp. 1476-1479.
- N. Sultana, M. S. Arayne and S. Naveed, “Simultaneous Quantitation of Captopril and NSAID’s in API, Dosage Formulations and Human Serum by RP-HPLC,” Journal of the Chinese Chemical Society, Vol. 57, No. 1, 2010, pp. 62-67.
- H. Y. Aboul-Enein, A. G. Dal and M. Tuncel, “A Validated Method Development for Ketoprofen by a FlowInjection Analysis with UV-Detection and Its Application to Pharmaceutical Formulations,” Farmaco, Vol. 58, No. 6, 2003, pp. 419-422. doi:10.1016/S0014-827X(03)00061-2
- K. E. Pickla, C. Magnesa, M. Bodenlenza, T. R. Piebera and F. M. Sinner, “Rapid Online-SPE-MS/MS Method for Ketoprofen Determination in Dermal Interstitial Fluid Samples from Rats Obtained by Microdialysis or OpenFlow Microperfusion,” Journal of Chromatography B, Vol. 850, No. 1-2, 2007, pp. 432-439. doi:10.1016/j.jchromb.2006.12.026
- F. Zafar, M. H. Shoaib and R. I. Yousuf, “Development and Evaluation of Fast Dispersible Ketoprofen 100 mg Tablets,” Asian Journal of Pharmaceutical Research, Vol. 2, No. 1, 2012, pp. 1-9.
- “International Conference on the Harmonization of Technical Requirements for the Registration of Pharmaceuticals for Human Use (ICH) Q2B,” International Journal of Pharmaceutical and Life Sciences, Vol. 1, No. 3, 1996, pp. 127-132.
- A. S. Lister, “Validation of HPLC Methods in Pharmaceutical Analysis,” Elsevier Inc., UK, 2005, pp. 197-211.
- Y. Hassan and A. Enein, “Rapid Liquid Chromatographic Analysis of Metoclopramide in Pharmaceutical Preparations,” Toxicological & Environmental Chemistry, Vol. 26, No. 1-4, 1990, pp. 197-201. doi:10.1080/02772249009357546
- N. Sultana, M. S. Arayne, R. Siddiqui and S. Naveed, “RP-HPLC Method for the Simultaneous Determination of Lisinopril and NSAIDs in API, Pharmaceutical Formulations and Human Serum,” American Journal of Analytical Chemistry, Vol. 3, No. 2, 2012, pp. 147-152. doi:10.4236/ajac.2012.32021
NOTES
*Corresponding author.