American Journal of Analytical Chemistry
Vol.3 No.11(2012), Article ID:24919,9 pages DOI:10.4236/ajac.2012.311099
Electrocatalytic and Sensors Properties of Natural Smectite Type Clay towards the Detection of Paraquat Using a Film-Modified Electrode
1Département de Chimie Inorganique, Université de Yaoundé I, Yaoundé, Cameroun
2Département des Sciences Environnementales, Université de Maroua, Maroua, Cameroun
3Département de Chimie, Université de Dschang, Dschang, Cameroun
4Université de Lorraine, Villers-lès-Nancy, France
Email: *itonle@yahoo.com
Received August 25, 2012; revised September 28, 2012; accepted October 5, 2102
Keywords: Electrocatalysis; Paraquat; Clay-Film Modified Electrode; Voltammetry; Sensor
ABSTRACT
In this study, a low-cost and sensitive voltammetric method was developed for the determination of paraquat (PQ2+). This was achieved by coating a glassy carbon electrode with a purified fraction of a smectite-type clay, which was then used to accumulate paraquat by an ion exchange process. The electronanalytical procedure involves two steps: the chemical preconcentration of paraquat under open-circuit conditions in an aqueous medium, followed by the voltammetric detection of the preconcentrated pollutant in a medium containing permanganate ions which significantly improved through its catalytic action the electrode response. A systematic study of the experimental conditions (pH of the accumulation and detection media, permanganate concentration in the detection medium, clay content of the coating, potential and duration of the electrolysis step) on the stripping response were examined in detail. After optimization, a linear calibration curve for paraquat was obtained in the concentration range from 1.6 to 2.8 µM, leading to a detection limit of 3.8 × 10⁻⁹ mol·L–1 (S/N = 3). The proposed method was successfully applied to the determination of paraquat in spring water.
1. Introduction
Paraquat (1,1’-dimethyl-4,4’-bipyridinium ion), also known as methyl viologen (PQ2+) is a bipyridinium pesticide widely used in many countries for its herbicidal properties [1,2]. It was introduced as a commercial herbicide in 1962 [3] and is nowadays used to control broad-leaved weeds and grasses. It can be also used as a desiccant for pineapples, sugar canes, soya beans and sunflower [4]. However, paraquat is known as a highly toxic chemical, which presents negative effects for the environment. Due to its high solubility in water (about 620 g×L–1 at 25˚C [5]), this compound is a potential contaminant for surrounding and drinking water. Paraquat has thus been analyzed using a wide range of analytical techniques such as spectrophotometry [6], flow injection potentiometry [7] and liquid chromatography [8]. These techniques operate quite well but they present a certain number of disadvantages: separation processes in the pretreatment of samples are often complex, analysis times are long, and most of these techniques require expensive equipment [9,10].
For the past decade, works devoted to the implementation of electrochemical devices suitable for the detection and sensing of paraquat have gained growing interest, the main purposes of these developments being the building of convenient, sensitive and rapid electroanalytical technique [11]. Along these lines, the electrochemical determination of paraquat has also been performed at different solid electrode surfaces [12,13] and on modified electrodes [14]. Interestingly, the voltammetric determination of this positively charged compound has been successfully achieved using electrodes chemically modified with cation-exchange materials such as resin [14], nafion [15] or phosphate [16]. Despite these interesting results, there is still a need to develop simple, sensitive and low cost electrochemical sensors that could allow the analytical quantification of paraquat in environmental matrices where it is present at trace level. On the other hand, some studies have shown that the combination of electrochemical methods and electrocatalysis is a prominent way to greatly increase the sensitivity of modified electrodes [15]. Usually electrocatalysis is characterized by a shift of the oxidation/ reduction potential to a less positive/negative value, and/or the enhancement of the cathodic or anodic current or both; these aspects can be advantageously exploited to perform electroanalytical determination of pollutants.
The interaction of paraquat with clay minerals has been extensively studied by UV and IR techniques [17-19], and the herbicidal activity of this compound was found to decrease significantly upon its adsorption by clays. Clay minerals are naturally occurring materials, cheap and widely available. Their well-defined layered structure and flexible adsorptive properties make them interesting materials that can be used as catalysts or catalytic supports, or sorbents for inorganic and organic pollutants [20, 21].
Therefore, the aim of the present study was to elaborate an electrochemical sensor for paraquat using a smectite clay film coated on glassy carbon electrode. Aiming at increasing the sensibility of the expected sensor, the catalytic effect of a strong oxidant (namely potassium permanganate) on the square wave voltammetric detection of paraquat was also investigated.
2. Experimental
2.1. Clay Mineral, Pre-Treatment and Characterization
The clay mineral used in this study (namely “Ba”) was a smectite collected from Baba hills (West-Cameroon, Central Africa). Its chemical composition and structural formula are provided elsewhere [22,23]. It is characterized by a cation exchange capacity (C.E.C) of 89 meq per 100 g, and a specific surface area (N2 adsorption-desorption, BET) of 155 m2×g–1. The study was carried out on the ≤2 µm clay fraction obtained by wet sedimentation. The clay was used in its sodium homoionic (referred as Ba-Na+) collected according to procedures previously described [24], summarized as follow: 5 g of the clay crushed and sieved at 80 µM were dispersed in 200 mL of 1 M NaCl solution, and stirred mechanically for 8 hours. The clay suspension was centrifuged at 5000 rpm for 10 minutes, and the supernatant discarded. To ensure the complete conversion of the clay to its homoionic form, the solid phase was contacted again to 200 mL of fresh 1 M NaCl solution and the resulted suspension maintained under constant stirring overnight. Afterwards, the solid was filtered and washed several times with distilled water until a negative test for Cl− ions (by 0.1 M AgNO3) was achieved. Upon this stage, the clay particles were dispersed in 200 mL of water and the suspension was placed in a sedimentation tube, the fraction below 2 µm was then separated by sedimentation according to Stockes law, recovered and dried on a filter paper at room temperature for 24 h.
The homoionic clay was subsequently characterized by X-ray powder diffraction (XRD) and Fourier transform infrared spectroscopy (FTIR).
XRD patterns were recorded at room temperature using a classical powder diffractometer (X’PERT PRO/ Philips) equipped with a Cu anode (quartz monochromator, ka1 radiation, l = 1.54056 Å).
Diffuse reflectance infrared spectra were recorded between 4000 and 700 cm-1, using a FTIR Perkin Elmer 2000 spectrometer equipped with a DTGS detector. The sample was analyzed at room temperature using KBr pellets. The diffuse reflectance of the sample and of KBr used as non-absorbing reference powder was measured in the same conditions. The spectrum resolution was 4 cm-1 and the accumulation time was 5 min.
2.2. Chemicals and Reagents
All chemicals and reagents used in the electrochemical section were of analytical grade, and used as received. Paraquat was purchased from Supleco France, and a 10−2 M stock solution was prepared in water. K3Fe(CN)6 (>99%) and NaCl (99.5%) purchased from Prolabo were analytical grade. KMnO4 (98%) was manufactured by Aldrich Chemie. The pH of solutions was adjusted by NaOH and HCl (37%) purchased respectively from BDH and Prolabo. All the aqueous solutions were prepared using double distilled water.
2.3. Working Electrode Preparation, Electrochemical Equipment and Procedures
The clay-modified working electrode was prepared as follow: the glassy carbon electrode (GCE) was first polished with an aqueous suspension of 0.05 µm alumina and ultrasonically cleaned for 5 minutes in a 1:1 ethanol:H2O mixture, then rinsed with distilled water and dried at room temperature. Aliquots of 10 µL of a suspension containing appropriate amounts of the clay were deposited by drop coating on the active surface (3 mm in diameter) of the GCE. The clay modified electrode was stored at room temperature for about 6 hours to ensure its complete drying before use. Cyclic voltammetry and square wave voltammetry measurements were conducted with a µ-autolab potentiostat equipped with the GPES electrochemical analysis system (Eco Chemie, Holland), and connected to a computer. A classical three-electrode system was used, comprising a wire tungsten auxiliary electrode, a saturated calomel electrode (SCE) used as reference and the modified clay-film working electrode. The pH measurement was performed with analog pH meter/model 301. Dearation was performed by purging nitrogen for 15 minutes. Multisweep cyclic voltammograms were recorded at room temperature, by immersing the working electrode in the “analyte + electrolyte” solution, at a scan rate of 50 mV×s–1 unless otherwise stated. The electrochemical procedure for paraquat analysis by stripping voltammetry involved two successive steps: an open-circuit accumulation followed by a voltammetric detection in a separate medium. Preconcentration was achieved by dipping the working electrode in a beaker containing an aqueous solution of paraquat at a given concentration. The solution was kept under constant stirring, and after a predetermined time, the electrode was promptly removed, rapidly rinsed with water and transferred into the electrochemical cell containing the detection solution where the accumulated species of paraquat were analyzed by square wave stripping voltammetry.
3. Results and Discussions
3.1. Physicochemical Characterization of the Clay
Figure 1(a) shows the infrared spectrum of Ba-Na+. It is characterized by the stretching and bending bands of OH as well as Si-O stretching. Bands in the 3697 - 3626 cm–1 region are ascribed to OH stretching vibration, while the OH bending vibration band appearing at 1627 cm–1 is due to OH deformation of the interlayer water molecule [25, 26]. Si-O stretching vibration band is observed at 1032 cm–1. The three bands identified in the region 800 - 950 cm–1 are defined as vibration bands of Al-AlOH (928 cm–1), Al-MgOH (803 cm–1) and AlFeOH (877 cm–1) [27].
Figure 1(b) shows the X-ray diffraction pattern of Ba-Na+: a significant and broad peak (at 2θ = 9˚) is observed, indicating a poorly crystallized material with a d-spacing (d001) of 10.1 Å. The peak at 2θ = 12.4˚C and 2θ = 19.8˚ are respectively due to traces of illite and feldspar present in the material as associated minerals [28].
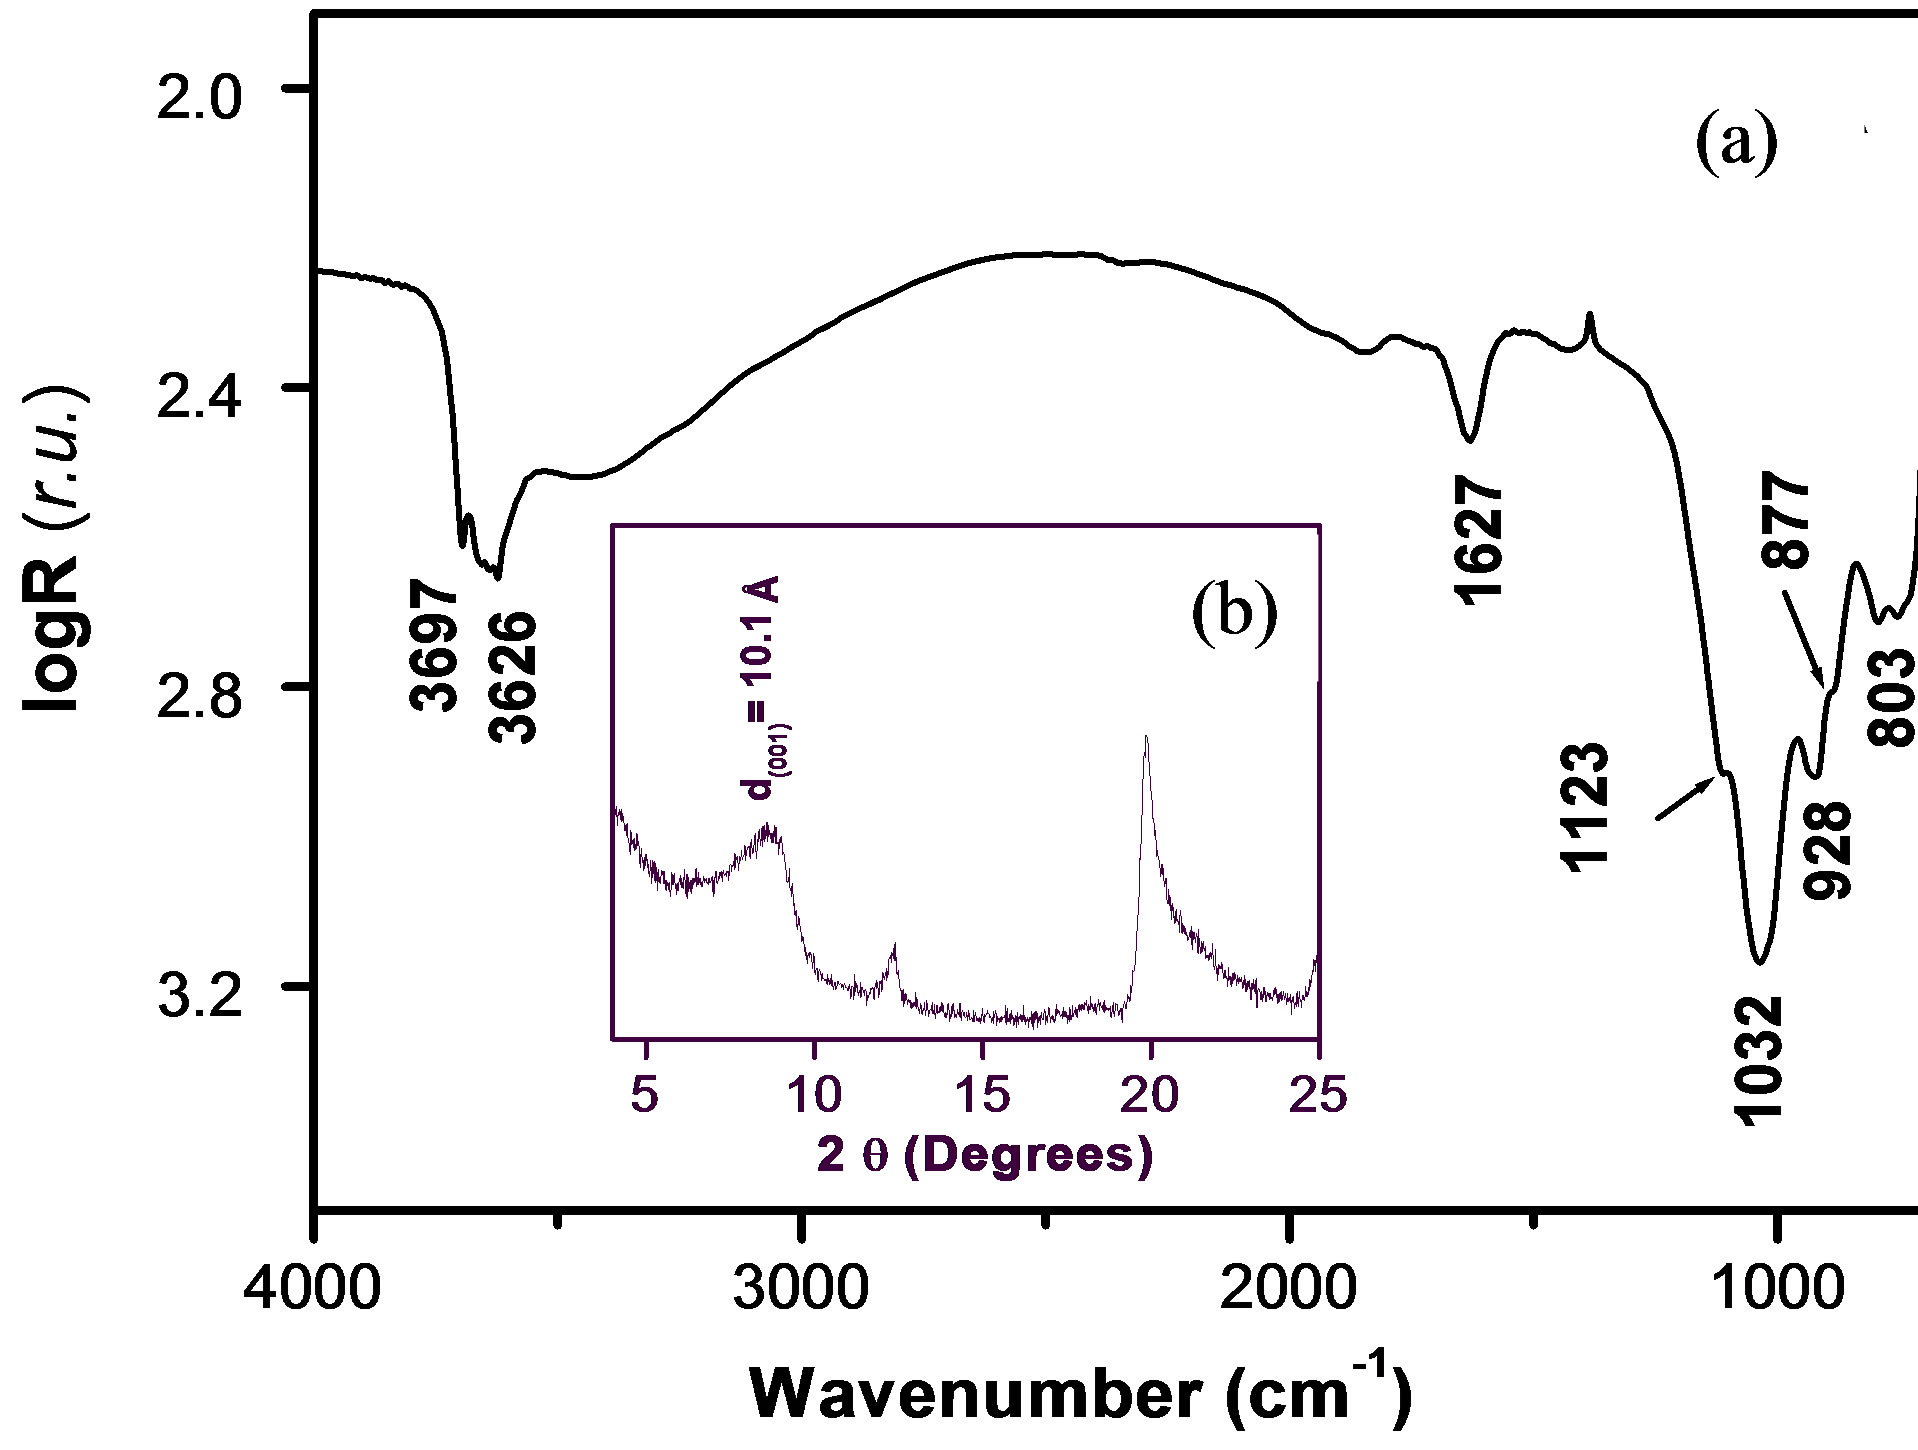
Figure 1. (a) Infrared spectrum of Ba-Na+; (b) X-ray diffraction pattern of Ba-Na+.
3.2. Electrochemical Characterization of the Clay Ba-Na+ by Permeation Studies
In order to gain precise information about the porosity of the Ba-Na+ and its accumulating properties, this material was characterized in terms of both ion-exchange and permselectivity, by the means of clay film modified electrodes. It is well know that employing an ion exchange material as electrode modifier may constitute a strategy to enhance the local concentration of an electrochemical probe [29]. Thus, the homoionic clay was coated onto the GCE surface, and the resulting modified electrode was applied to the uptake of [Fe(CN)6]3− and PQ2+ ions used as probes. The electrochemical of both probes was beforehand studied at the bare GCE, and as expected, the two compounds gave rise to well defined reversible cyclic voltammograms as shown by insets in Figure 2: the
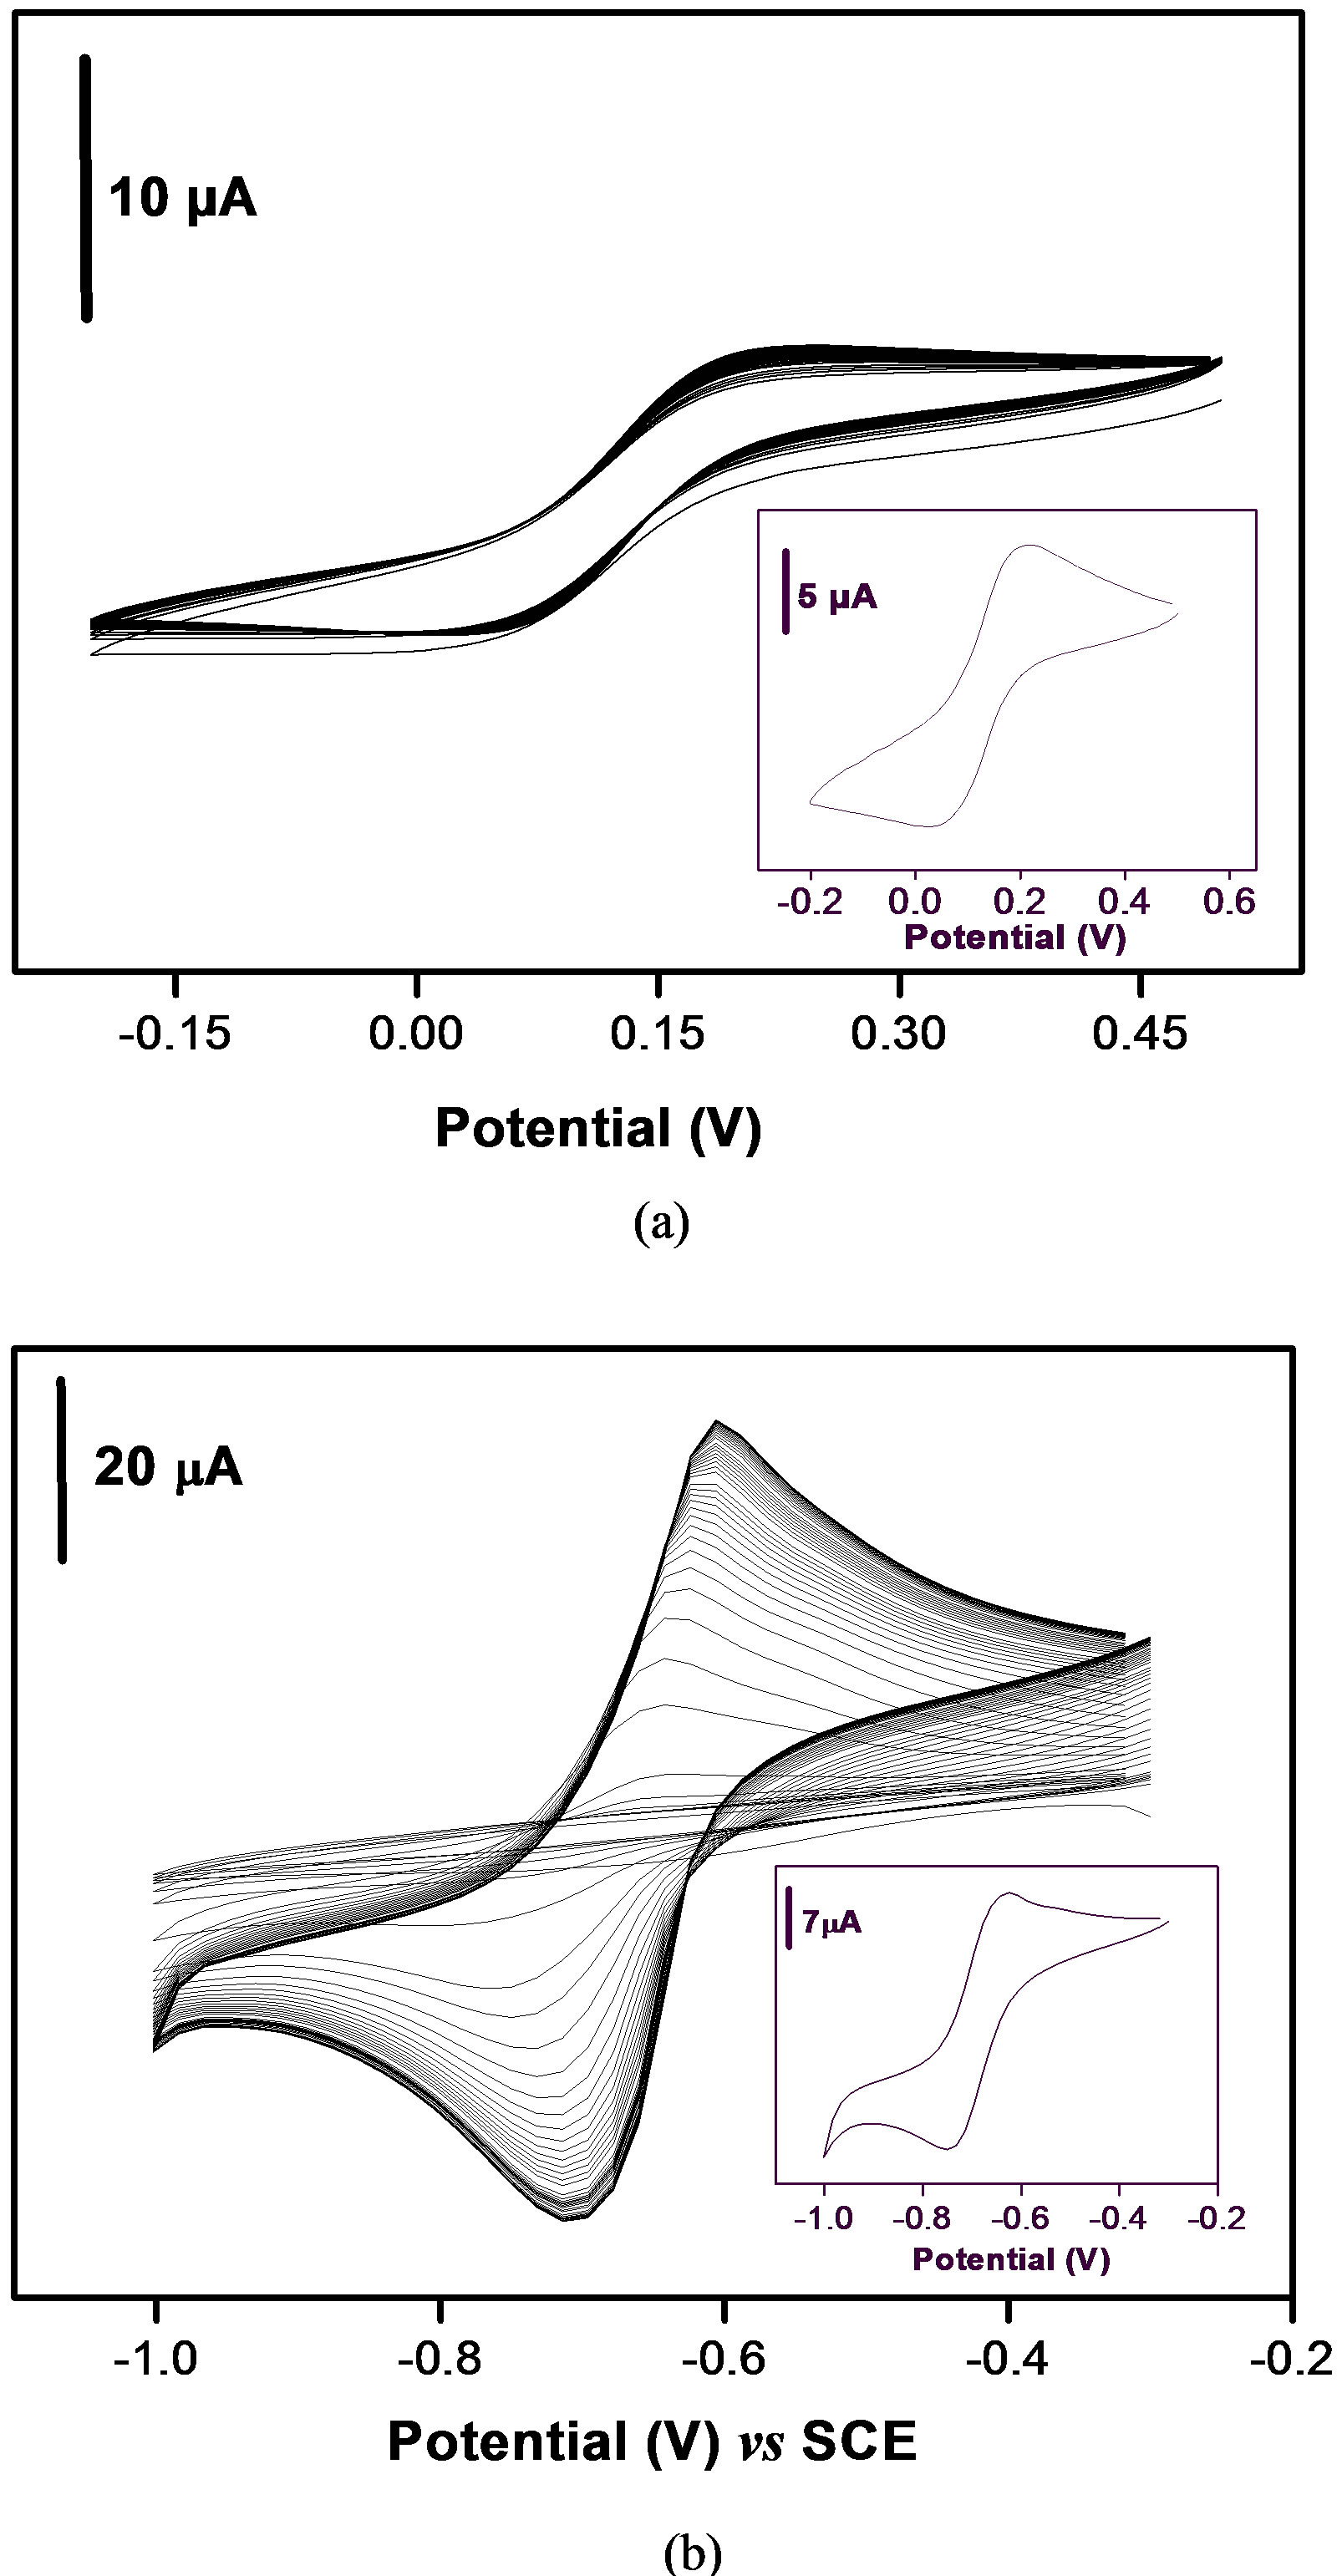
Figure 2. Multisweep cyclic voltammograms recorded at 50 mV·s–1 on the GCE coated with a thin film of Ba-Na+ clay material (a) in 0.1 M NaCl + 1.5 mM of [Fe(CN)6]3– and (b) in 0.1 M NaCl (pH 5) + 40 µM of PQ2+. Insets show the responses at the bare GCE for the corresponding analytes at the same potential scan rate.
peak heights, measured from the extrapolated baseline, were found to be 7.3 µA for 1.5 mM [Fe(CN)6]3– and 14 µA for 40 µM PQ2+ solutions respectively. These signals were stable upon continuous potential cycling. When the bare GCE was modified by a thin film of Ba-Na+ material, the multisweep cyclic voltammetry performed in the same probe solutions gave rise to totally different behaviors as shown in Figures 2(a) and (b). One can observe that the coverage of the electrode surface by a thin film of Ba-Na+ prevents the free access of the negatively charged [Fe(CN)6]3– electroactive probe to the electrode surface, due to unfavorable electrostatic interactions [30].
By contrast, when the analyte was changed from [Fe(CN)6]3– to PQ2+, the presence of Ba-Na+ film at the surface of the GCE enhanced dramatically its voltammetric response toward PQ2+ species as compared to the bare electrode (Figure 2(b)). During the first cyclic scan, the peak current is initially lower on clay modified electrode than that observed at bare glassy electrode. This can be explained by the fact that the film at the GCE acts somewhat as a physical and restrictive barrier which prevents paraquat species to reach the active surface of the GCE. Continuous cycling potentials induced increase in voltammetric signals which leads to a steady-state current for paraquat after about 40 cycles. The increase in peak current is due to both true physical diffusion of the analyte upon ion exchange in the coating and to a mass-charge transfer phenomena arising from potential scanning. In order to yield more insights in the electrochemical behavior of paraquat, further experiments were performed including the study of the effect of increasing the potential scan rate.
From Figure 3, it appears that the peak current increases with the potential scan rate. A plot of the anodic peak current versus v1/2 exhibits a linear dependence as
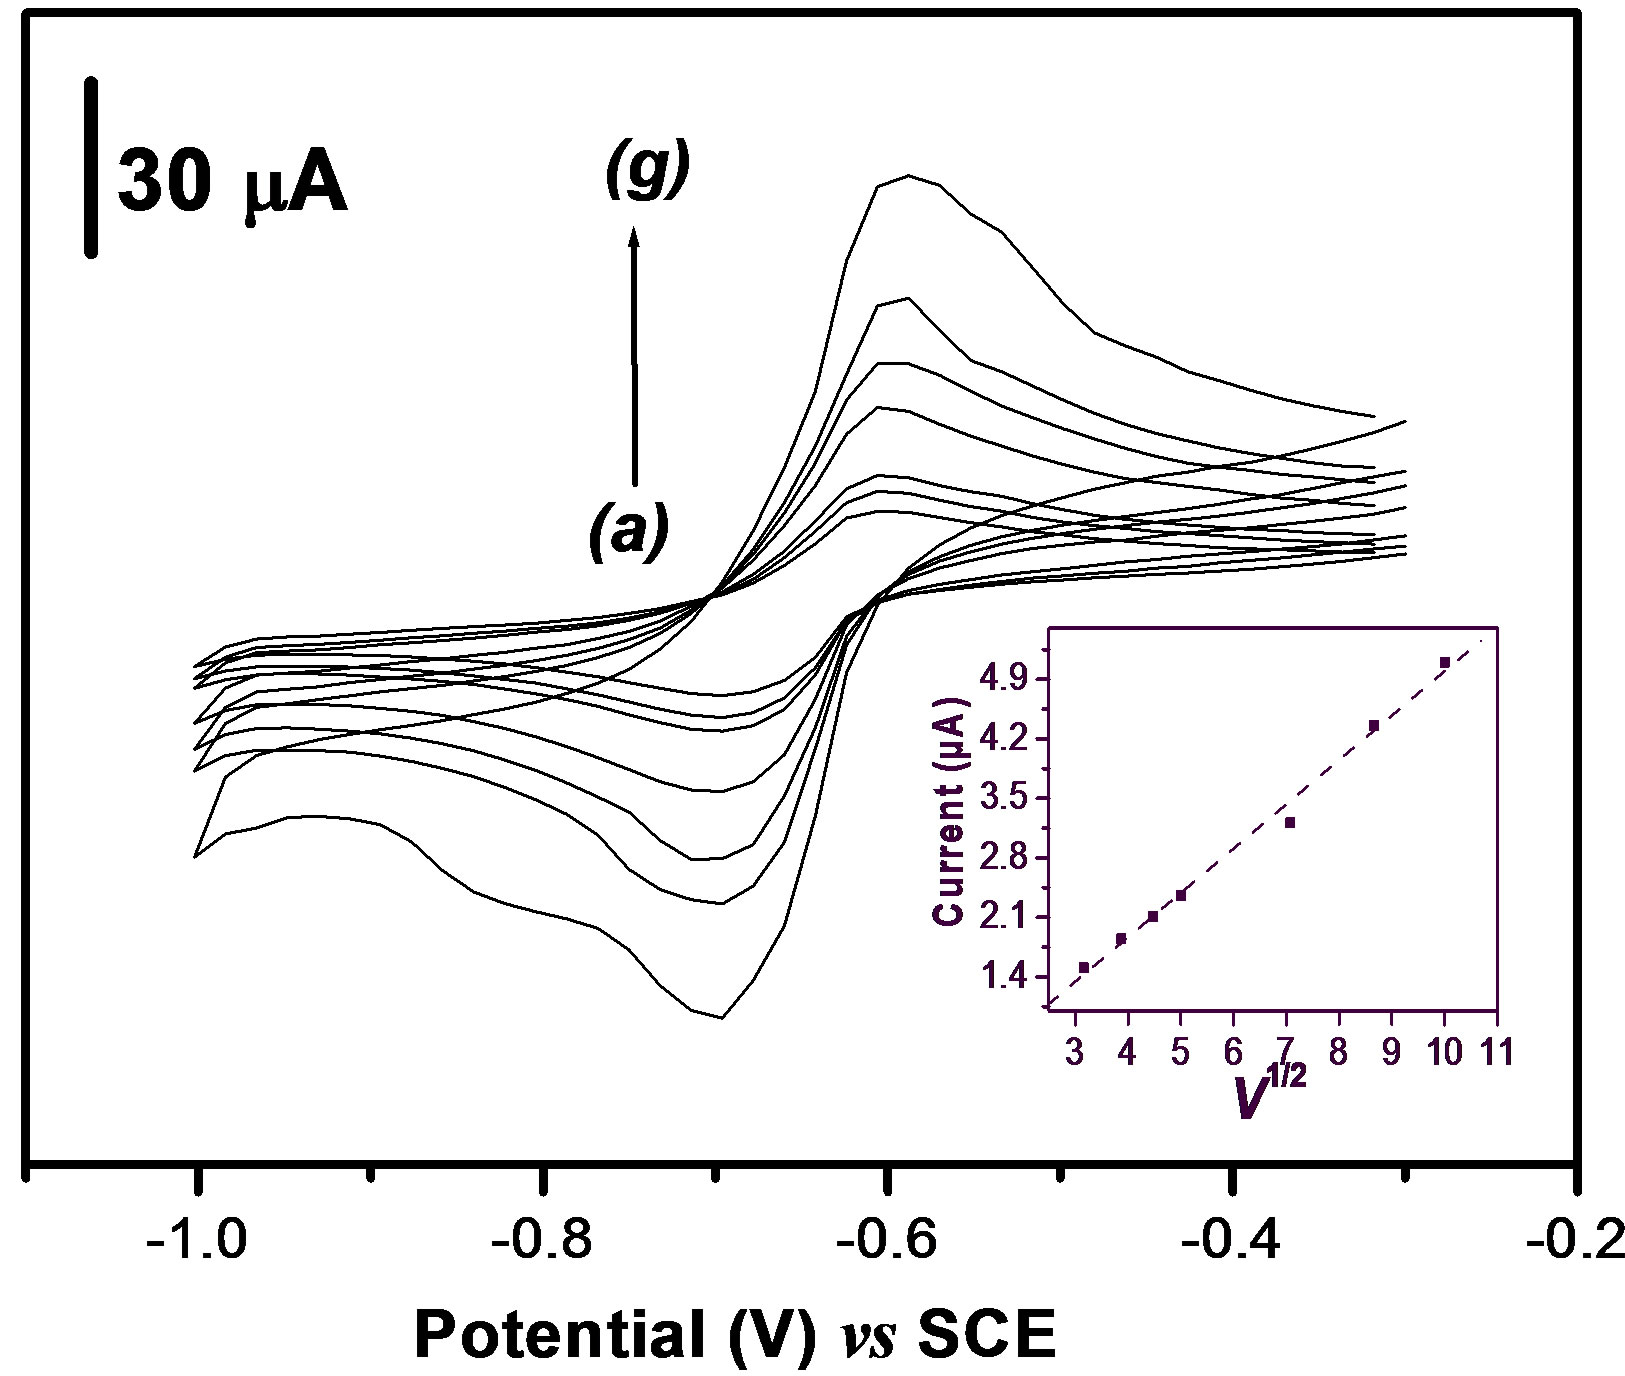
Figure 3. Influence of scan rate (v) on peak current of 40 µM of PQ2+ on the GCE coated with a thin film of Ba-Na+ (curves a - g, v = 10 - 15 - 20 – 25- 50 - 75 and 100 mV·s–1 respectively). Inset: Plot of the anodic peak current (Ipa) versus v1/2.
indicated by the graph inserted in Figure 3. This result shows that the charge transfer process at the clay-modified electrode is governed by diffusion. The results in this section has demonstrated that the presence of the clay cation exchanger at the GCE surface favors the accumulation by an ion exchange process of PQ2+, and and that the charge transfer within the clay modified electrode is controlled by diffusion.
3.3. Electrochemical Behavior of Paraquat in the Presence of KMnO4
It was reported that the addition of an oxidative species in the detection medium can greatly improve the sensitiveity of the cathodic stripping voltammetric detection of electroactive compounds or ions [14].
In this section, we investigated the effect of a strong oxidant ( ions) on the electrochemical behavior of paraquat at the clay modified electrode. Figure 4 presents the stabilized cyclic voltammograms of 40 µM PQ2+ obtained in 0.1 M NaCl, in the absence and in the presence of
  ions in the supporting electrolyte. One can observe that paraquat yields a reversible system (Figure 4(a)) on the clay-modified electrode without
  in the medium as already shown in Figure 2. However, when
  species were added to the supporting electrolyte, the oxidation peak of paraquat disappears while the intensity of the cathodic signal increases significantly. This behavior is a consequence of the catalytic action of
  species which promote the reduction of PQ2+ into PQ+. In this process, when PQ2+ ions accumulated on the clay film (Ba-Na+) are reduced to PQ+, the later then catalyses the reduction of
  at the film/permanganate solution interface, and are meanwhile reoxidized to PQ2+.
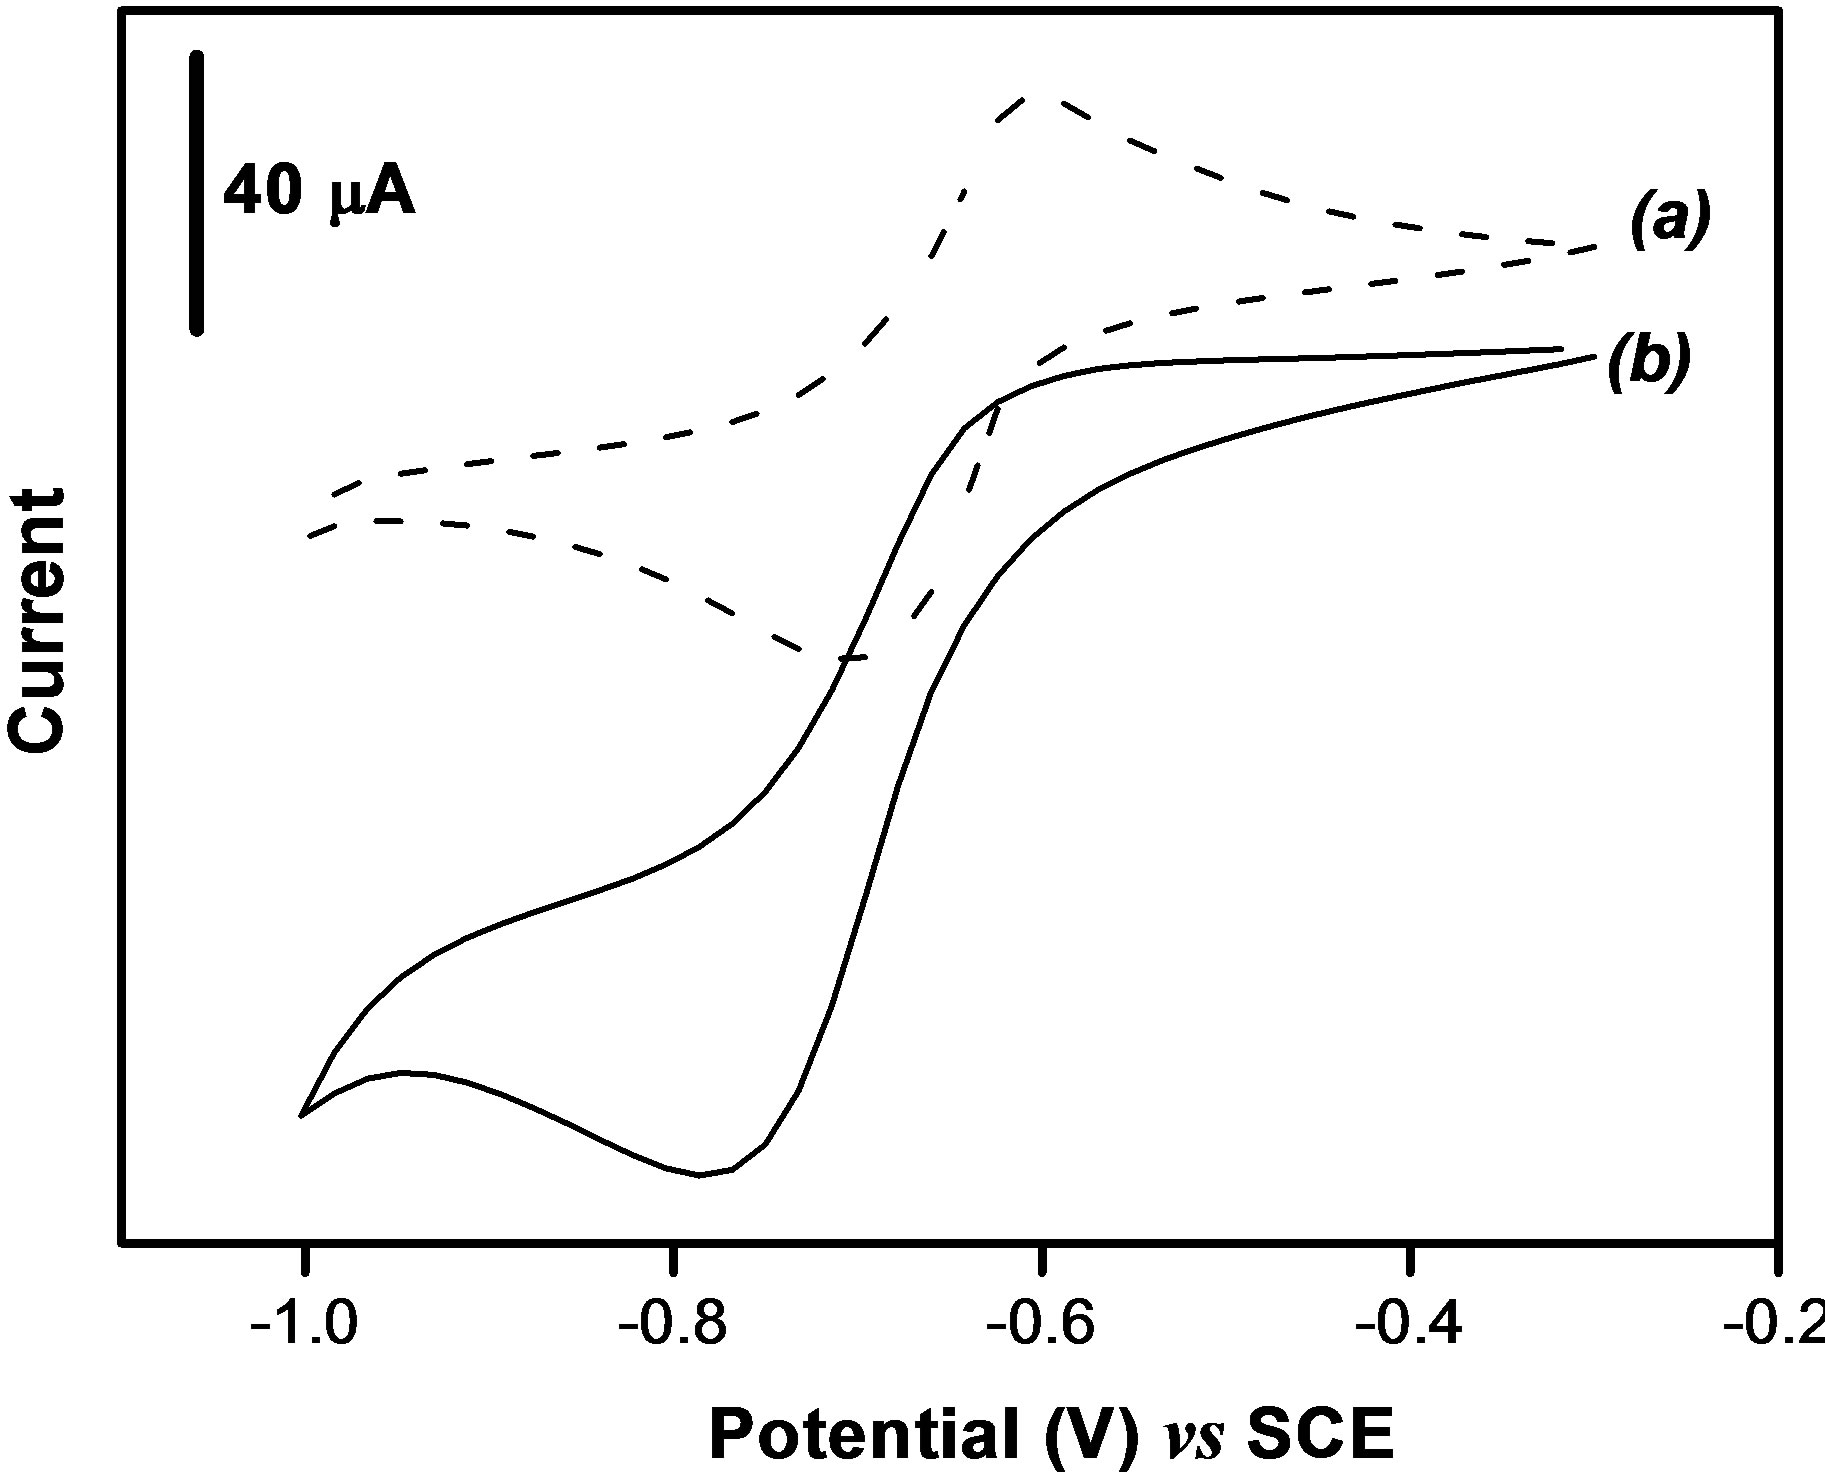
Figure 4. Stabilized cyclic voltammograms obtained for 40 µM of PQ2+ on the GCE coated with a thin film of Ba-Na+, in 0.1 M NaCl (a) in the absence and (b) in the presence of 1.6 mM KMnO4.
This in-situ chemical regeneration of PQ2+ in the vicinity of the electrode contributes to improve the reduction current: in fact, as soon as it is formed, this ion is immediately reduced at the electrode. The mechanism of this catalytic reaction is an electrochemical-chemical (EC) type between PQ2+ and  ions described by the following equation in agreement with previous works [14].
Paraquat (II) + e– Paraquat (I)
Paraquat (I) + 
 Paraquat (II)
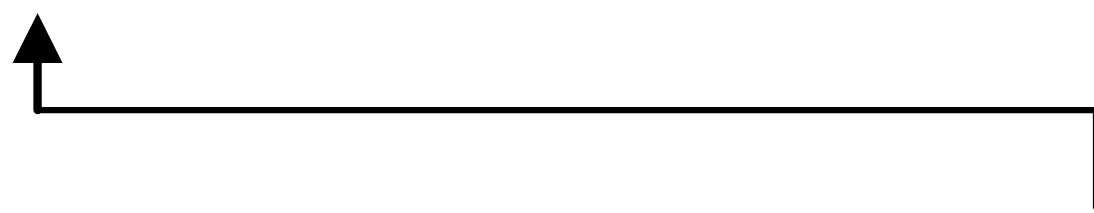
In another hand, permanganate is electroactive on bare glassy carbon electrode in NaCl solution and it seemed important to check whether the presence of this compound in the electrolyte does not interfere with the signal of paraquat. Figure 5 shows the cyclic voltammograms obtained for 1.6 mM KMnO4 in 0.1 M NaCl on the bare GCE (Figure 5(a)) and on the same electrode modified by a film of the Ba-Na+ clay (Figure 5(b)).
It is noticed that, in the potential range from –1.1 to –0.3 V where PQ2+ is electroactive, no signal is observed at the clay modified electrode for . Indeed, the reduction of
  is weak on the modified electrode due to unfavorable electrostatic interactions between the negatively charged clay particles and
 . The signals observed around –0.25 and 0.25 V for
  on the clay modified electrode (Figure 5(b)) could be explained by the presence of cracks or fissures on the film during the drying step of the preparation of this electrode [31]. These results clearly demonstrate the advantage of combining smectite clay and permanganate in the determination of paraquat. From the above cyclic voltammetry
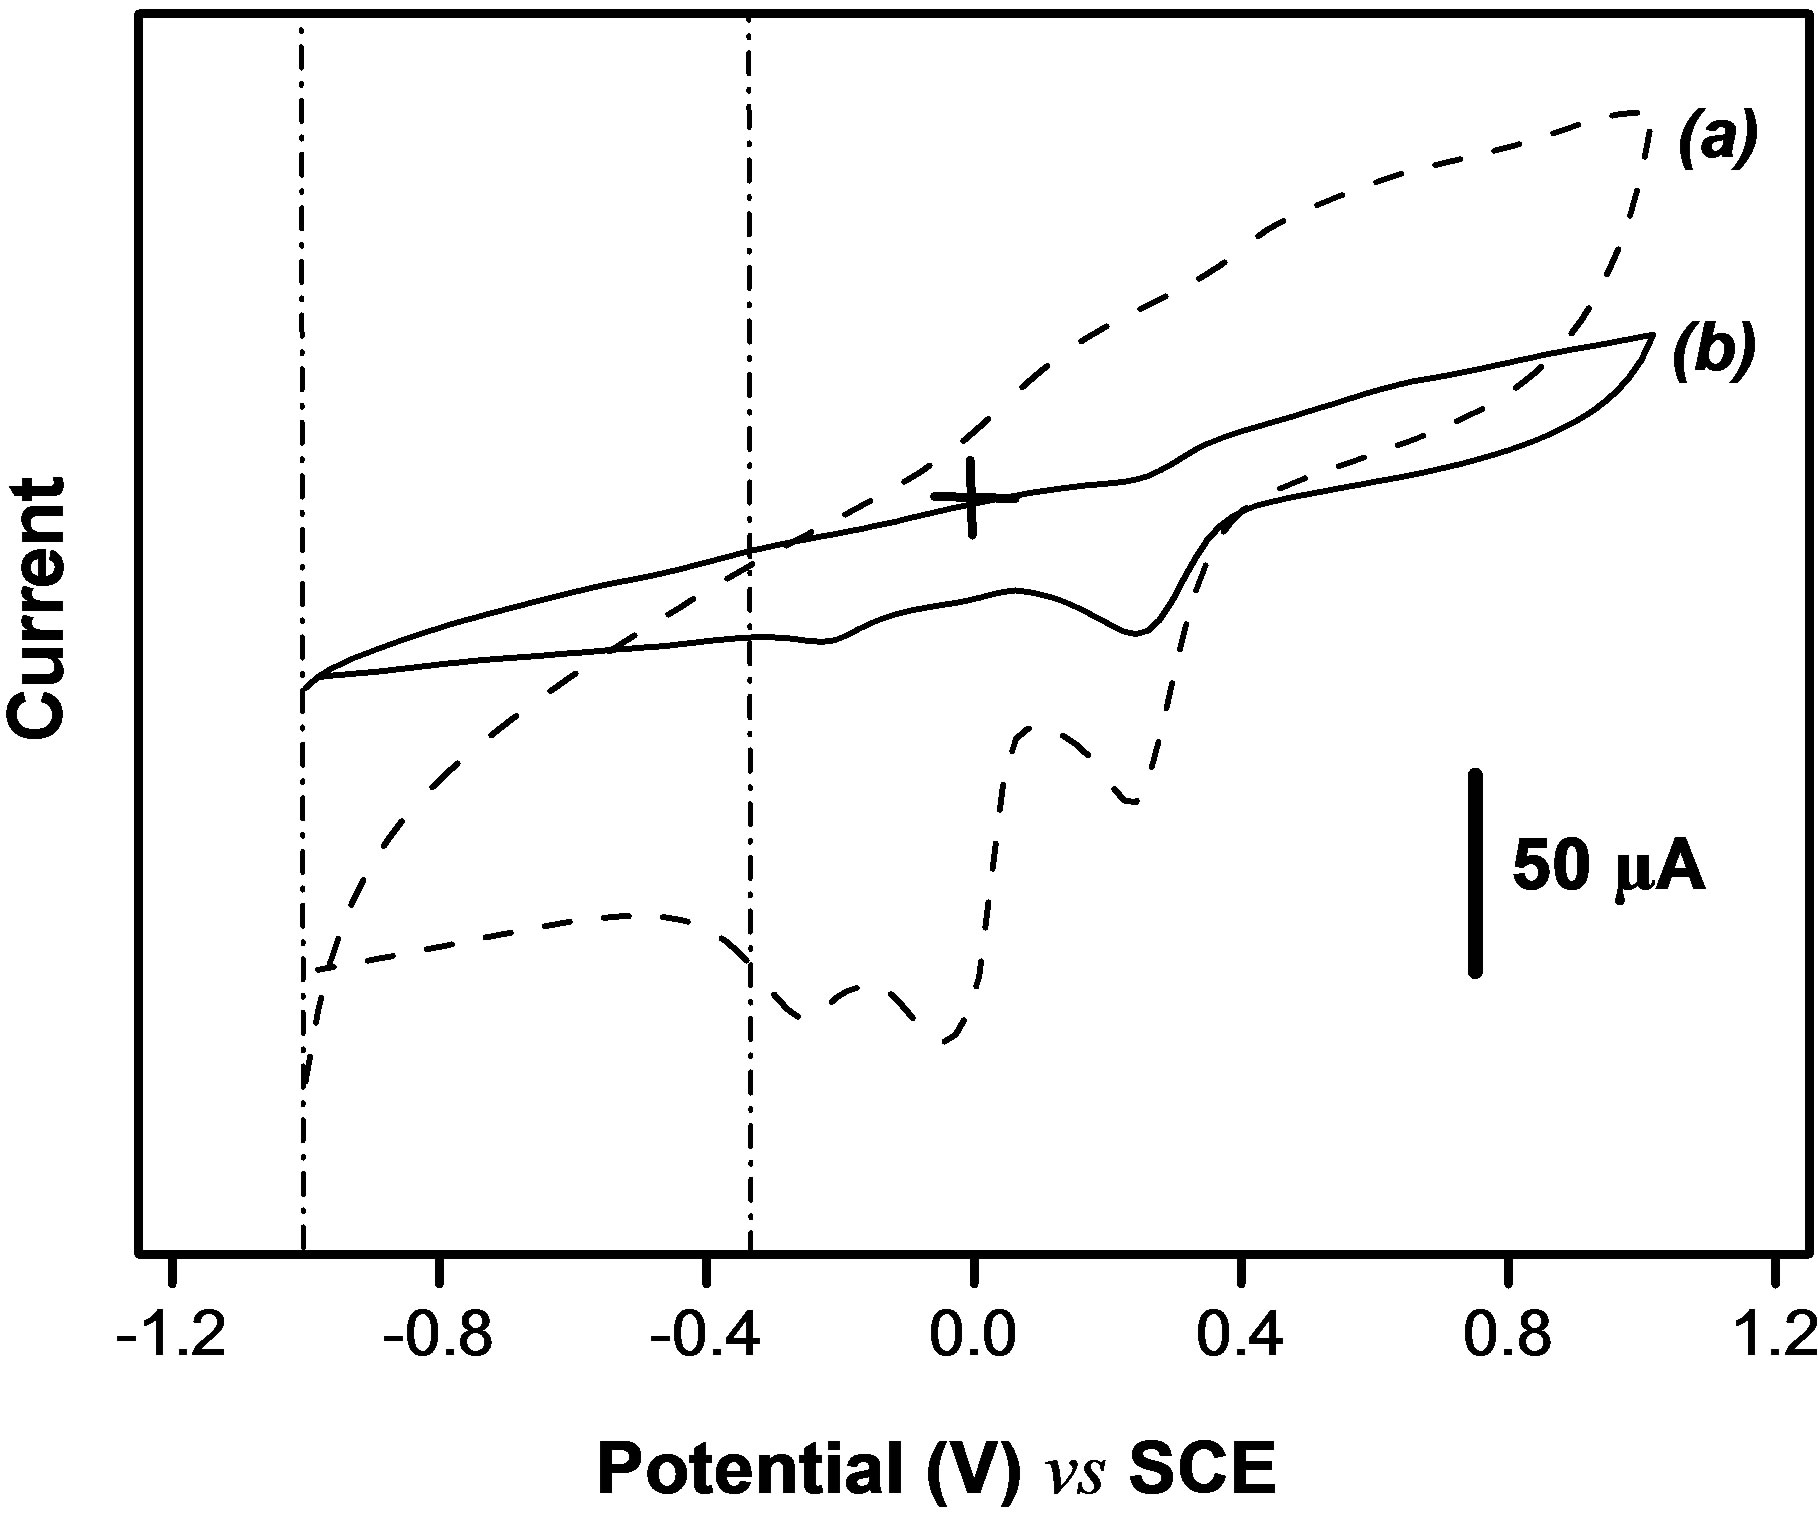
Figure 5. Cyclic voltammograms of 1.6 mM  recorded at 50 mv·s−, (a) at the bare GCE, and (b) on the GCE coated with a thin film Ba-Na+.
studies, it appear that Ba-Na+ clay used as electrode modifier can be suitable for building an electrochemical sensor for paraquat.
As far as the elaboration of a sensor was concerned, we also investigated the behavior of PQ2+ ions by the means of a pulse voltammetric technique. For this to be achieved, some preliminary experiments were run consisting of the detection using square wave voltammetry (SWV) of paraquat in a 0.1 M NaCl solution before and after the addition of KMnO4 in the medium, upon 5 min preconcentration of PQ2+ at open circuit by the GCE electrode modified by Ba-Na+. Figure 6 presents the SWV curves obtained consisting of a well defined but rather low peak when the detection cell contained only 0.1 M NaCl (Figure 6(a)); when a suitable amount of  ions was added, the sensibility of the electrode was significantly improved: the peak current was 4.5 times more pronounced in comparison with the signal obtained without
  ions (Figure 6(b)).
In fact, during the preelectrolytic step, the imposition of a suitable electrolysis potential permits the reduction of PQ2+ accumulated on the film to PQ+. This reduced form of paraquat (PQ+) oxidizes chemically MnO4- ions to regenerate PQ2+ during the anodic scan of potentials as previously explained in Section 3.3. In order to study the stability and reproducibility of the coatings at the GCE, five successive SWV experiments of the same film were performed in 40 µM of PQ2+ solution. The coefficient of variation for the peak currents for all five measurements was calculated to be 2.5%, thereby indicating that the modified electrode has a good reproducibility. Some important physicochemical parameters involved in the stripping process will be now examined in order to optimize the sensitivity of the modified electrode, in view of its possible use as PQ2+ sensor.

Figure 6. SWV response of 40 µM of PQ2+ on the GCE coated with a thin film Ba-Na+ after 5 minutes accumulation at open-circuit. Detection was performed (a) in 0.1 M NaCl, and (b) in 0.1 M NaCl + 1.6 mM KMnO4. Other experimental conditions: electrolysis potential: −0.9 V, frequency: 50 Hz, pulse amplitude: 50 mV.
3.4. Optimization of Parameters for Paraquat Detection
3.4.1. Influence of Permanganate Concentration
Given that the presence of  ions in the detection medium was shown to significantly increase the SWV signal of PQ2+, the effect of the concentration of
  was investigated. It is noticed (see Figure 7) that the SW peak current of PQ2+ increases significantly with the amount of permanganate in the concentration range from 0 to 1.6 mM. However, beyond 1.6 mM, there is a loss of sensibility of the electrode indicated by a decrease in the electrode response. Therefore, a permanganate concentration of 1.6 mM was chosen for the examination of other parameters.
3.4.2. Influence of Ba-Na+ in the Suspension
The study of the effect of Ba-Na+ proportion in the suspension used to prepare the film coated on the GCE was also expected to affect the electrode response. Figure 8 presents the evolution of the SW peak current when the
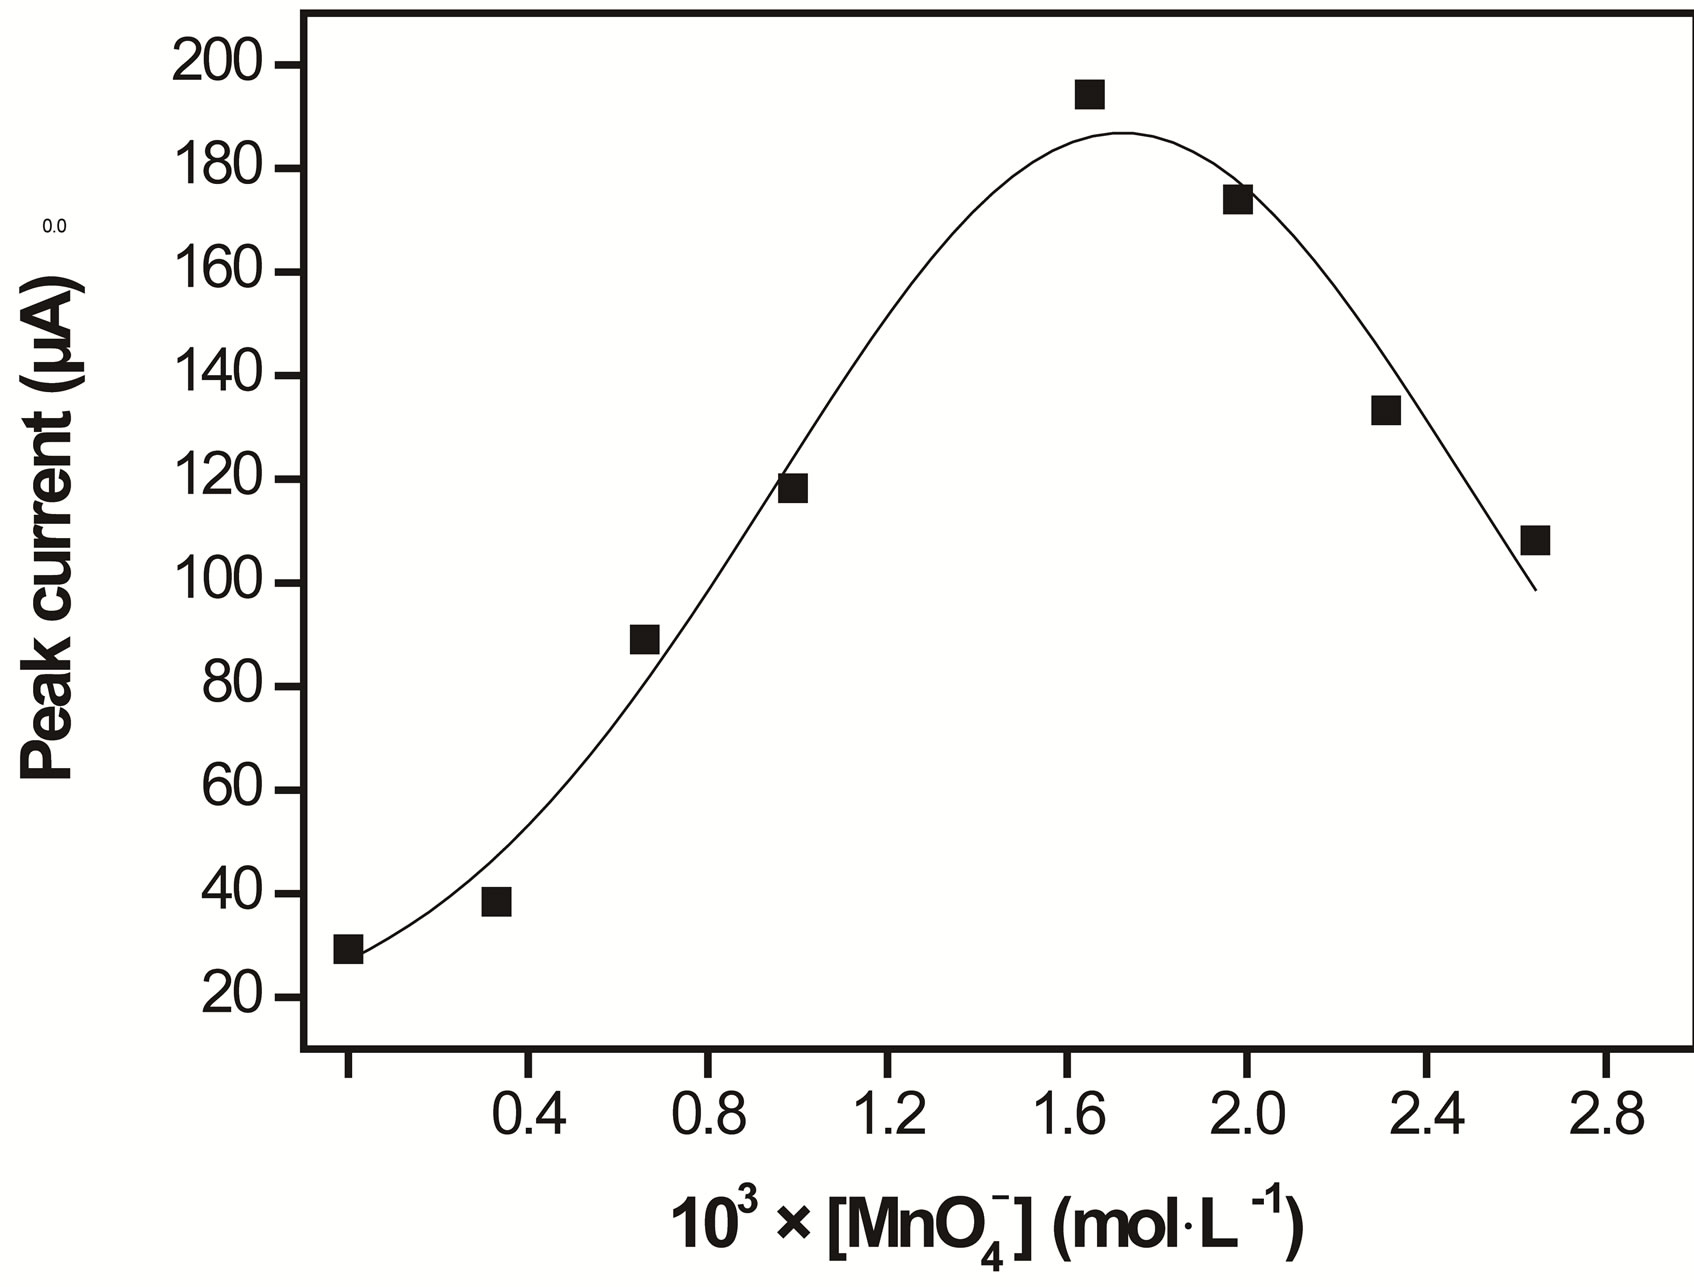
Figure 7. Effect of  concentration on SWV peak high of 40 µM of PQ2+ on the GCE coated with a thin film Ba-Na+. Other conditions are same as in Figure 6.
Figure 8. Effect of the amount of Ba-Na+ in the suspension (used to prepare the clay modified electrode) on the peak current of PQ2+. Other conditions are same as in Figure 6.
detection of PQ2+ was performed with clay modified electrodes prepared by using suspensions containing various amounts of Ba-Na+. The peak current was shown to increase with the amount of Ba-Na+ coated material, up to a maximum value of 2 g×L–1. Beyond this optimum value, increasing the proportion of clay (Ba-Na+) lowers the current response, as a consequence of the film thickness that renders the mass transfer more difficult [32].
3.4.3. Influence of pH in the Detection and Accumulation Media
The dependence of the electrochemical response of paraquat on the pH of the detection medium was studied by keeping the pH of accumulation medium around 7. The results obtained are presented in Figure 9(a) where it appears that the electrode response increased in the pH range from 2 to 5 which is the optimal value reached, and then it decreased slightly to pH 9. In an alkaline medium, the sensor loses its sensibility because the catalytic reduction of  ions is not optimal in this pH range. Thus, there is low chemical recovery of PQ2+ near the surface electrode which explains the decrease of peak current. Figure 9(b) shows the influence of the pH of the solution on the accumulation of PQ2+: a stable and low sensibility of the electrode was obtained in the acidic range between 2 and 5; the peak current then increased sharply from pH 5, reaching a small plateau at pH 7 till pH 8. Here, the competition between H+ and PQ2+ for the adsorption sites of Ba-Na+ on the GCE could explain this observation [33]. The sensibility of the electrode is optimal at pH 8, and for more alkaline medium, the current decreased due to the degradation of viologen compound [34].
3.4.4. Interferences Studies
Under the optimal experimental conditions defined above, the interference effect of some inorganic cations was eva-
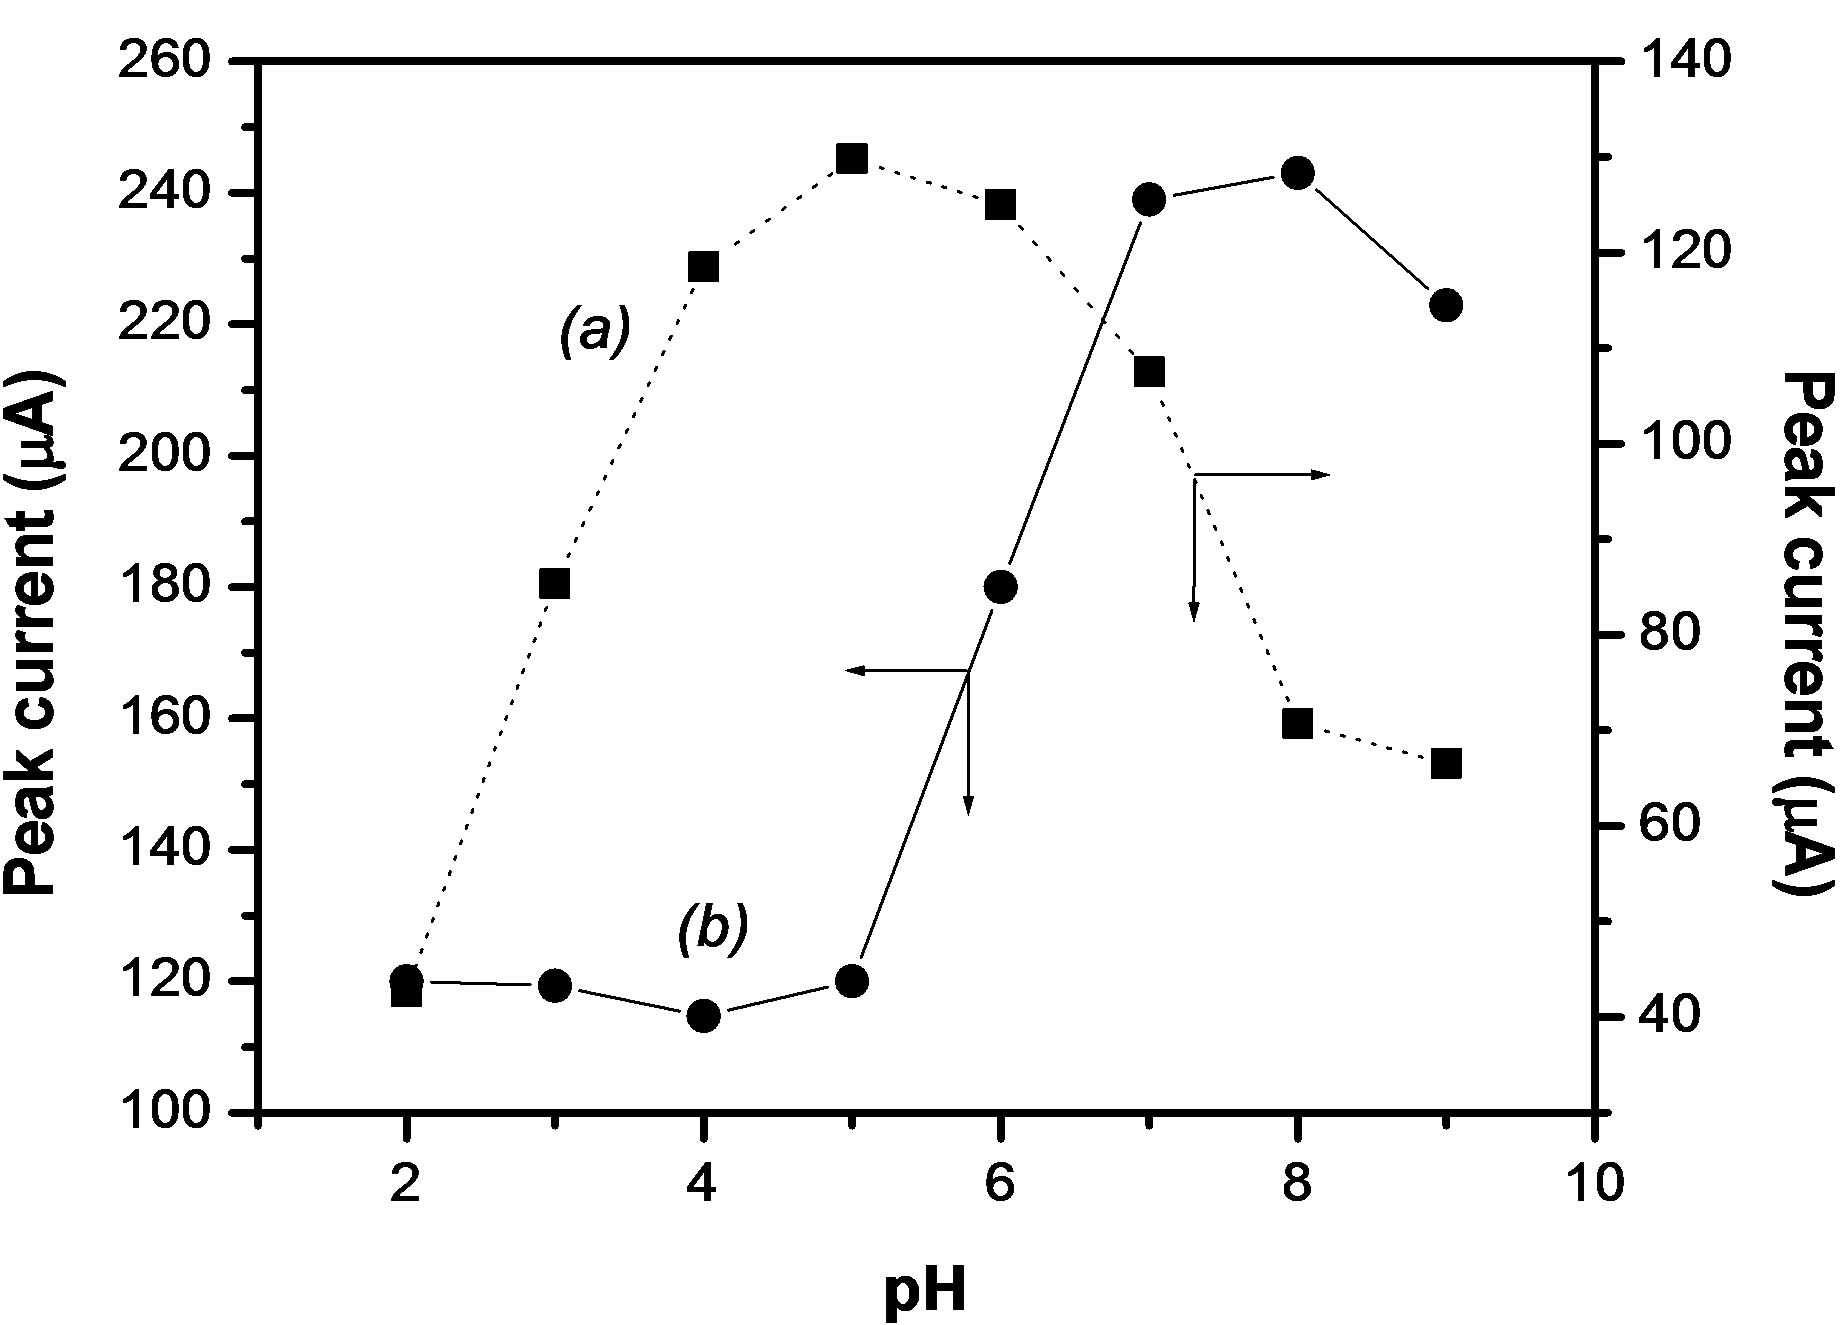
Figure 9. Effect on the peak current of PQ2+, of the pH of the detection medium (a) and of the accumulation medium (b). Other conditions are same as in Figure 6.
luated. The results summarized in Table 1 showed that 1000-fold excess of K+ and Cl− did not interfere with the analysis of PQ2+. However,  ions influence slightly at 500-fold excess while Mg2+, Pb2+ and Cu2+ at concentration 500 times larger than PQ2+ interfered by decreasing the PQ2+ intensity. Zn2+ interfered mostly with the analyte beyond 100-fold excess.
3.4.5. Influence of Paraquat Concentration
On the basis of optimized conditions obtained in previous sections, a calibration curve was established when the paraquat concentration in the accumulation medium was varied between 1.6 µM to 2.8 µM. It is important to mention that the electrolysis potential and duration were also investigated (results not shown), and the optimal values for the two parameters were –0.9 V and 180 seconds. The SW voltammograms obtained and the corresponding calibration plot is shown in Figure 10: the slope and the correlation coefficient are 2.4 µA M–1 and 0.999 respectively. The detection limit (S/N =3) was found to be 3.8 × 10⁻⁹ mol L–1. This value is better in comparison to others gathered from literature for the electrochemical determination of the PQ2+ at chemically modified electrodes [15,35]. The validation of the procedure herein proposed for paraquat sensor was examined by determining this pollutant in water. A spring water sample was collected, and its analysis does not shown the presence of paraquat. The sample was thus spiked with the analyte. The recovery amount of 97% was obtained if the spring water was spiked with 2 µM of PQ2+ (Table 2). This result clearly indicates that the voltam
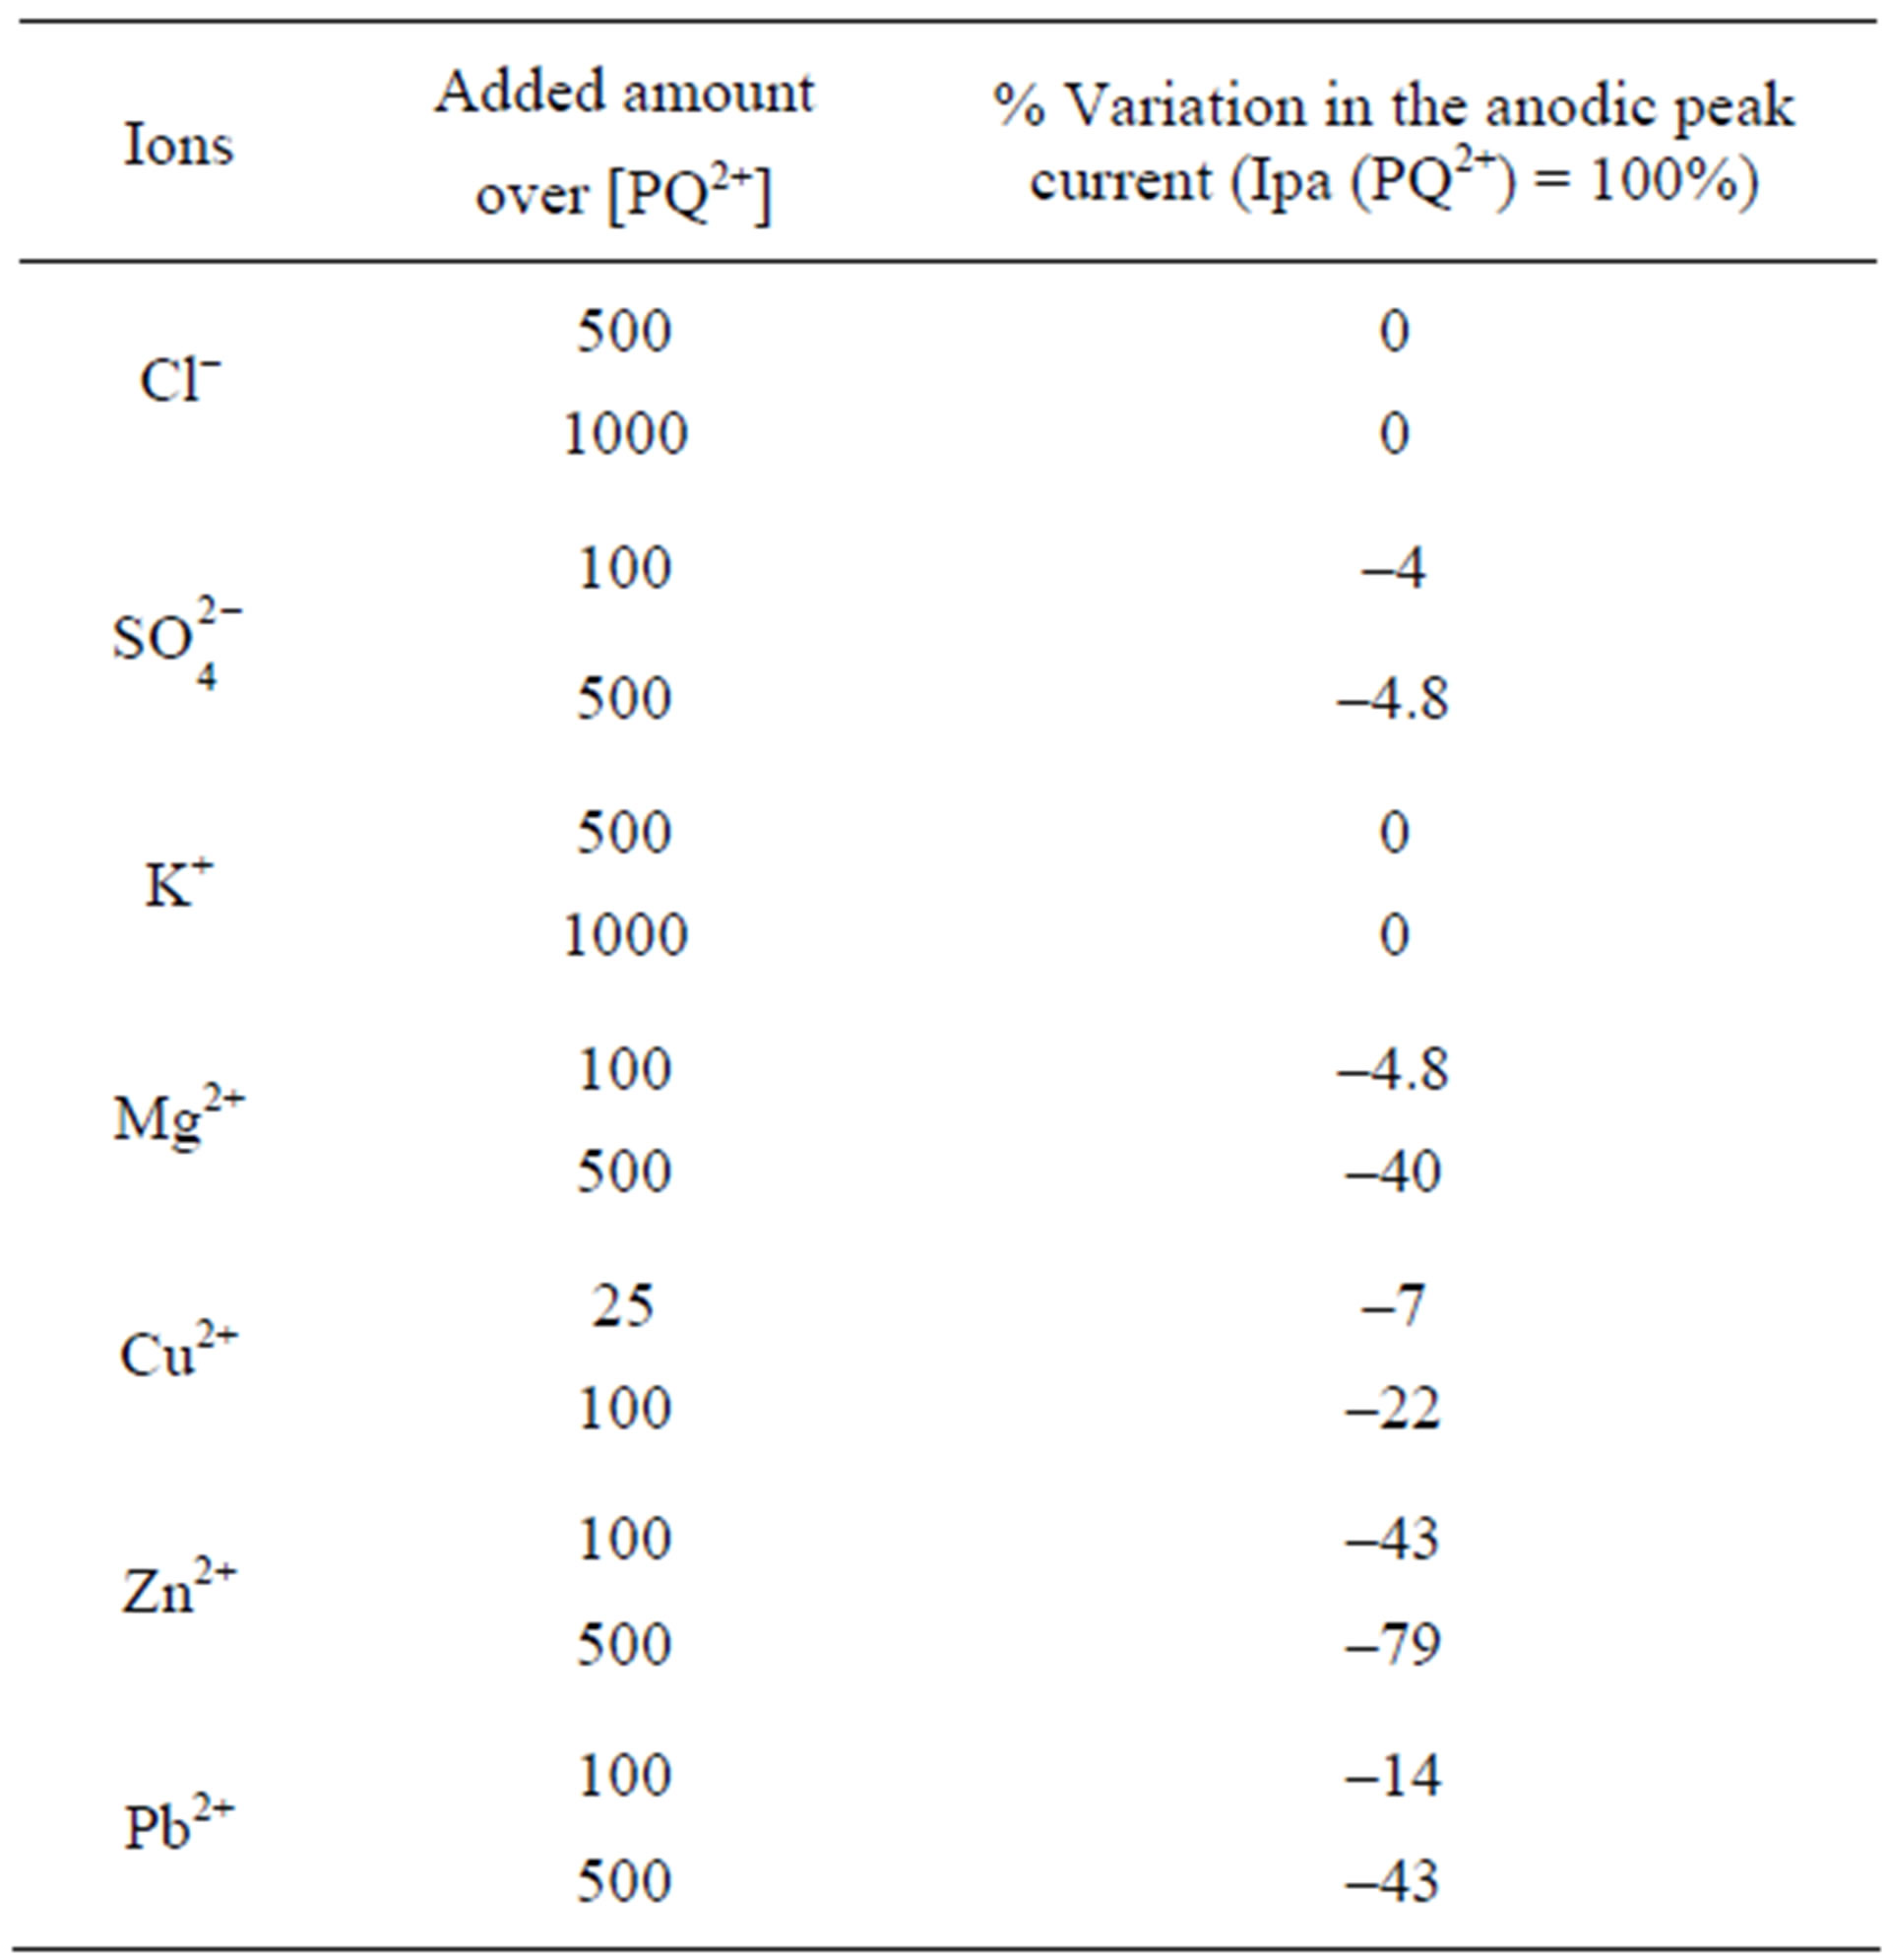
Table 1. Effect of interference ions on the response of the GCE/Ba-Na+ to 40 µM PQ2+.
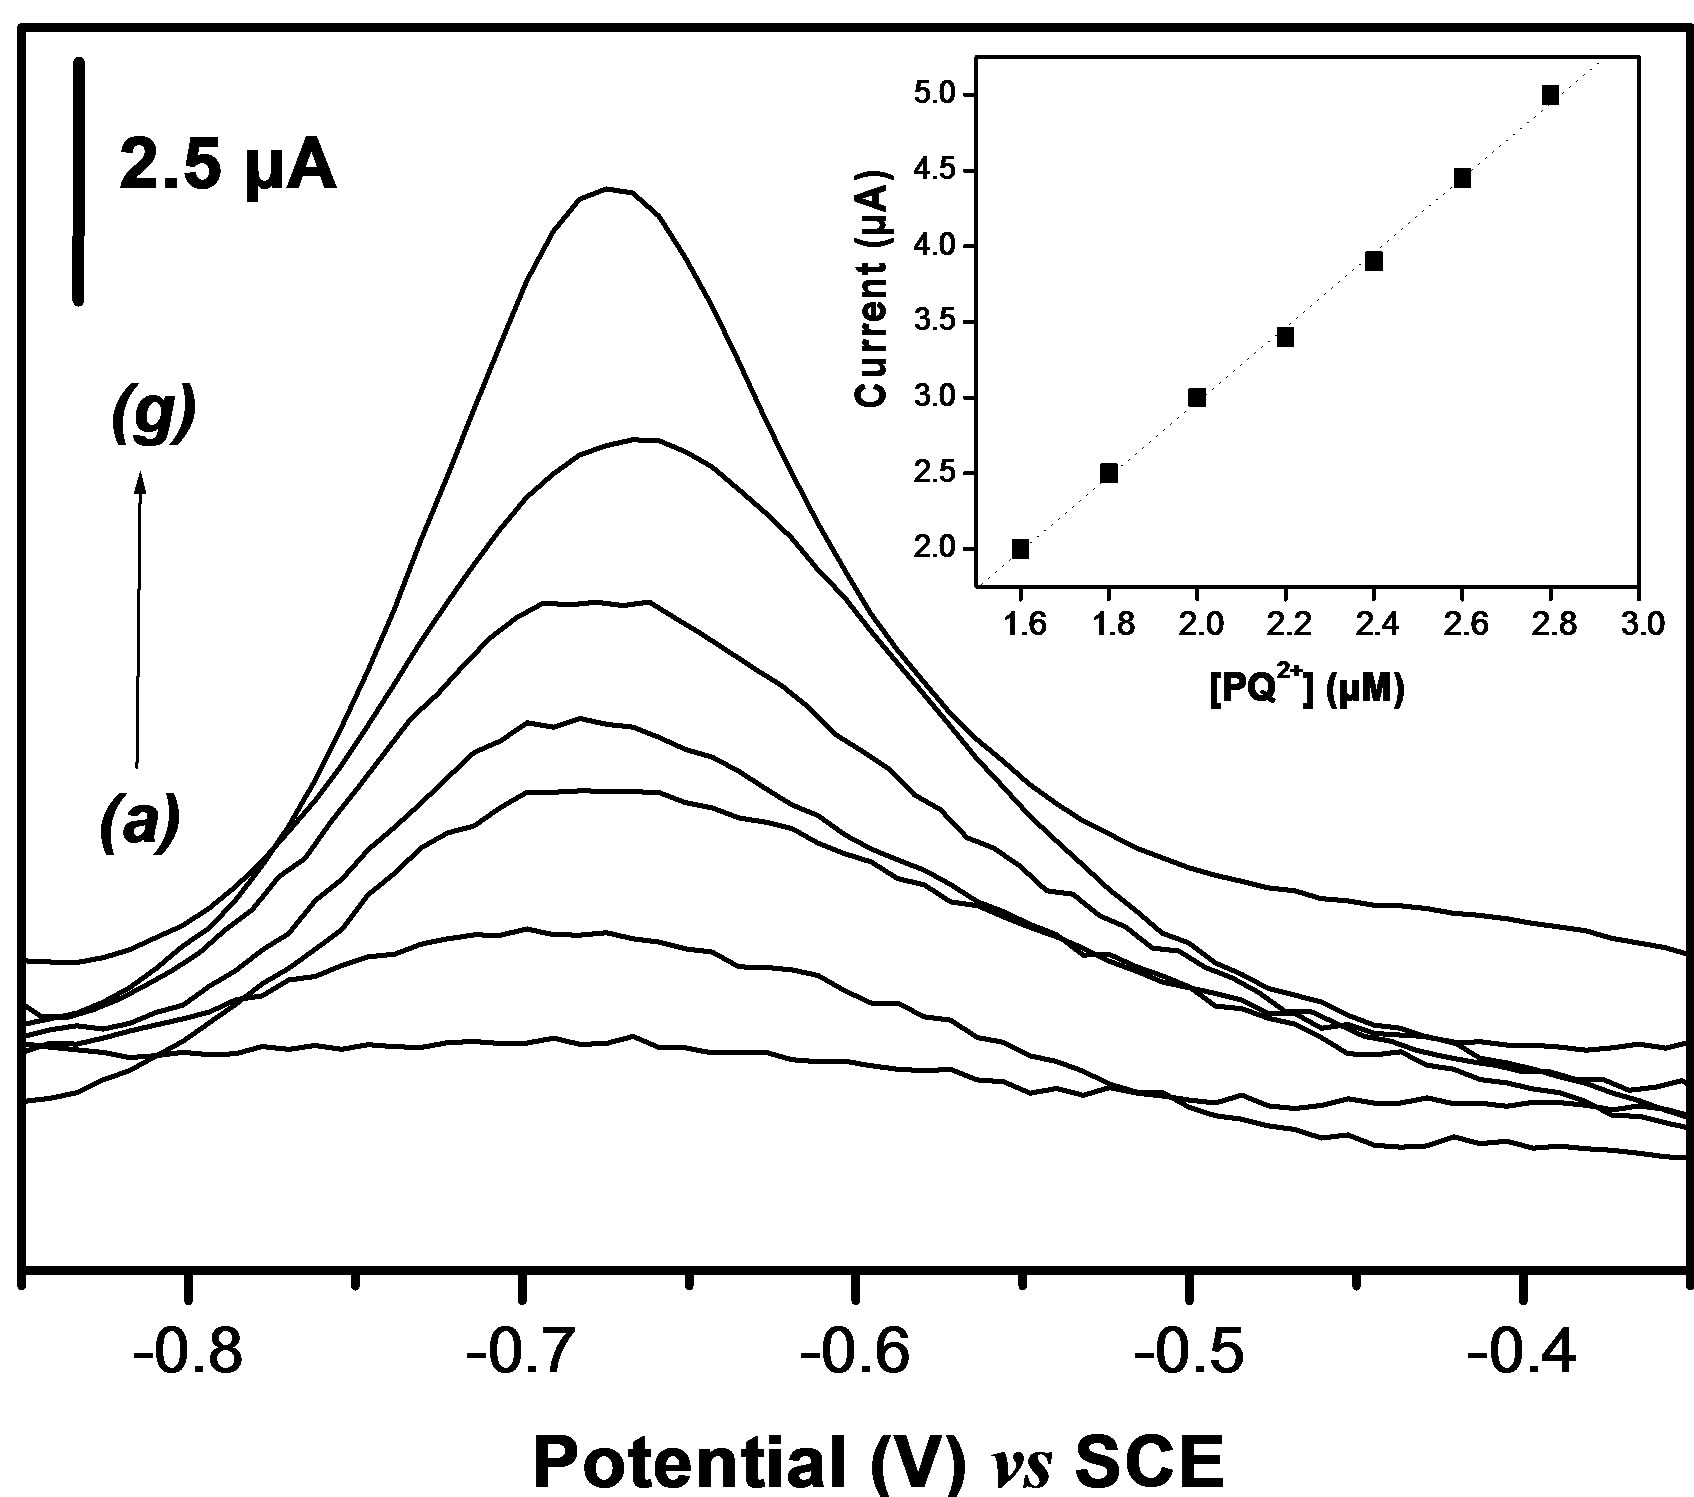
Figure 10. (a) Dependence of the SWV peak current with increased paraquat concentration from (a) to (g) 0.16 - 0.18 - 0.2 - 0.22 - 0.24 - 0.26 and 0.28 × 10⁻⁷ M. The inset shows the corresponding calibration curve.
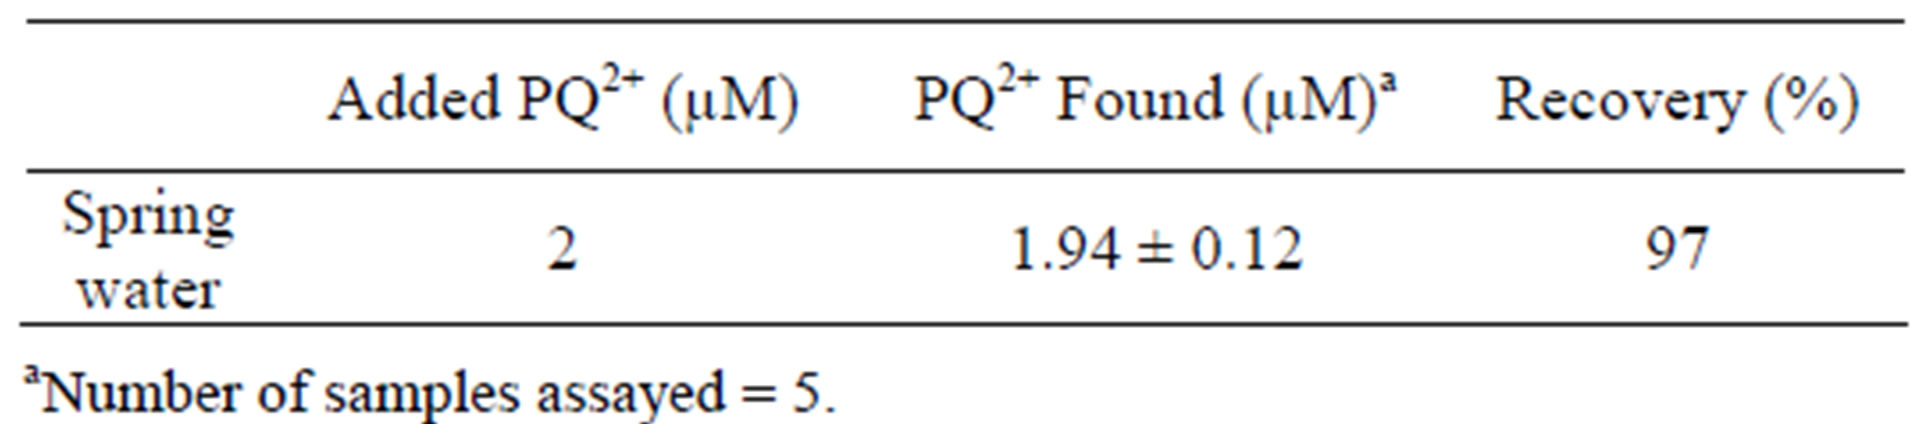
Table 2. Determination of paraquat in spring water.`
metric procedure established in the present study could be applied for PQ2+ sensing in environmental polluted media.
4. Conclusion
The work carried out in this paper has led to a simple but quite performant SW voltammetric method for the sensitive determination of paraquat in aqueous media. This was achieved by means of a natural clay film-modified glassy carbon electrode that was exploited for the preconcentration at open circuit of paraquat followed by its detection by square wave voltammetry in a separate solution containing KMnO4. The sensitivity of the sensor was largely improved due to the catalytic action of  in the detection medium.
REFERENCES
- C. Zwing, “Pesticides, Plant Growth Regulators and Food Additives,” Academic Press, New York, 1967.
- K. A Hassal, “The Chemistry of Pesticides. Their Metabolism, Mode of Action and Uses in Crop Protection,” Verlag, Weinheim, 1982.
- D. Kaniansky, F. Lvinyi and F. I. Onuska, “On-Line Isotachlophoretic Sample Pretreatment in Ultratrace Determination of Paraquat and Diquat in Water by Capillary Zone Electrophoresis,” Analytical Chemistry, Vol. 66, No. 11, 1994, pp. 1817-1824. doi:10.1021/ac00083a007
- C. Tomlin, “The Pesticide Manual: Incorporating the Agro Chemicals Handbook,” 10th Edition, British Crop Protection Council, Cambrige, 1994.
- E. Halfon, S. Galassi, R. Bruggemann and A. Provini, “Selection of Priority Properties to Assess Environmental Hazard of Pesticides,” Chemosphere, Vol. 33, No. 8, 1996, pp .1543-1562.
- M. K. Rai, J. V. Das and V. K. Gupta, “A Sensitive Determination of Paraquat by Spectrophotometry,” Talanta, Vol. 45, No. 2, 1997, pp. 343-348. doi:10.1016/S0039-9140(97)00136-7
- B. Saad, M. Ariffin and M. I. Saleh, “Flow Injection Potentiometric Determination of Paraquat in Formulation and Biological Samples,” Talanta, Vol. 47, No. 5, 1998, pp. 1231-1236. doi:10.1016/S0039-9140(98)00213-6
- I. Kambhampati, K. S. Roinestad, T. G. Hartman, J. D. Rosen, E. K. Fukuda, R. L. Lippincott and R. T. Rosen. “Determination of Diquat and Paraquat in Water Using High-Performance Liquid Chromatography with Configuration by Liquid Chromatography Particle Beam Mass Spectrometry,” Journal of Chromatography A, Vol. 688, No. 1-2, 1994, pp. 67-73. doi:10.1016/0021-9673(94)00889-2
- M. Sreedilar, T. R. Madhusudana, K. R. Sirista and S. R. Jayarama, “Differential Pulse Adsorptive Stripping Voltammetric Determination of Dinoseb and Dinoterb at a Modified Electrode,” Analytical Sciences, Vol. 19, No. 4, 2003, pp. 511-516. doi:10.2116/analsci.19.511
- M. Sbai, H. E. Tome, U. Gombert, T. Breton and M. Pontie, “Electrochemical Stripping of Methyl-Parathion Using Carbon Fiber Microelectrodes Modified with Combinations of Poly-NiTSPc and Nafion Films,” Sensor and Actuators B, Vol. 124, No. 2, 2007, pp. 368-375. doi:10.1016/j.snb.2006.12.051
- D. De Souza, S. A. S. Machado and R. C. Pires, “Multiple Square Wave Voltammetry for Analytical Determination of Paraquat in Natural Water, Food and Beverages Using Microelectrodes,” Talanta, Vol. 69, No. 5, 2006, pp. 1200- 1207. doi:10.1016/j.talanta.2005.12.045
- P. M. S. Monk, C. Turner and S. P. Akhtar, “Electrochemical Behavior of Methyl Viologen in a Matrix of Paper,” Electrochimica Acta, Vol. 44, No. 26, 1999, pp. 4817-4826.
- A. Walcarius and L. lamberts, “Square Wave Voltammetric Determination of Paraquat and Diquat in Aqueous Solution,” Journal of Electroanalytical Chemistry, Vol. 406, No. 1, 1996, pp. 59-68. doi:10.1016/0022-0728(95)04385-3
- T. H. Lu and I. W. Sun, “Electrocatalytic Determination of Paraquat Using a Nafion Film Coated Glassy Carbon Electrode,” Talanta, Vol. 53, No. 2, 2000, pp. 443-451. doi:10.1016/S0039-9140(00)00511-7
- E. Alvarez, M. Teresa Sevilla, J. M. Pinilla and L. Hernandez, “Cathodic Stripping Voltammetry of Paraquat on a Carbon Paste Electrode Modified with Amberlite XAD- 2 Resin,” Analytica Chimica Acta, Vol. 260, No. 1, 1992, pp. 19-23. doi:10.1016/0003-2670(92)80121-M
- M. A. Mhammedi, M. Bakasse and A. Chtaini, “Electrochemical Studies and Square Wave Voltammetry of Paraquat at Natural Phosphate Modified Carbon Paste Electrode,” Journal of Hazardous Materials, Vol. 145, No. 1-2, 2007, pp. 1-7. doi:10.1016/j.jhazmat.2007.02.054
- B. K. G. Theng, “The Chemistry of Clay-Organic Reactions,” John Wiley & Sons, New York, 1974.
- B. A. G. Knigt and T. E. Tomhnson, “The Interaction of Paraquat with Mineral Soils,” Journal of Soil Science, Vol. 18, No. 2, 1967, pp. 233-243. doi:10.1111/j.1365-2389.1967.tb01503.x
- B. A. G. Knigt and P. J. Denny, “The Interaction of Paraquat with Soil: Adsorption by an Expanding Lattice Clay Mineral,” Weed Research, Vol. 10, No. 1, 1970, pp. 40- 48. doi:10.1111/j.1365-3180.1970.tb00921.x
- H. V. Olphen, “An Introduction to Clay Colloid Chemistry,” 2nd Edition, John Wiley & Sons, New York, 1977.
- J. J Fripiat, “Internal Surface of Clays and Constrained Chemical Reaction,” Clays and Clay Minerals, Vol. 34, No. 5, 1986, pp. 501-506. doi:10.1346/CCMN.1986.0340501
- I. K. Tonle, E. Ngameni, D. Njopwouo, C. Carteret and A. Walcarius, “Functionalization of Natural Smectite-Type Clays by Grafting with Organosilanes: Physic Chemical Characterization and Application to Mercury(II) Uptake,” Physical Chemistry Chemical Physics, Vol. 5, No. 21, 2003, pp. 4951-4961. doi:10.1039/b308787e
- I. K. Tonle, E. Ngameni, H. L. Tcheumi, V. Tchieda, C. Carteret and A. Walcarius, “Sorption of Methylene Blue on an Organoclay Bearing Thiol Groups and Application to Electrochemical Sensing of the Dye,” Talanta, Vol. 74, No. 4, 2008, pp. 489-497. doi:10.1016/j.talanta.2007.06.006
- H. L. Tcheumi, I. K. Tonle, E. Ngameni and A. Walcarius, “Electrochemical Analysis of Methylparathion Pesticide by a Gemini Surfactant-Intercalated Clay-Modified Electrode,” Talanta, Vol. 81, No. 3, 2010, pp. 972-979. doi:10.1016/j.talanta.2010.01.049
- Y. Xi, Z. Ding, H. He and R. L. Frost, “Infrared Spectroscopy of Organoclays Synthesized with the Surfactant Octadecyltrimethylammonium Bromide,” Spectrochimica Acta A, Vol. 61, No. 3, 2005, pp. 515-525. doi:10.1016/j.saa.2004.05.001
- J. D. Russel and A. R. Fraser, “Infrared Methods,” In: M. J. Wilson, Ed., Clay Mineralogy: Spectroscopy an Chemical Determinative Methods, Chapman & Hall, London, 1994, pp. 11-67. doi:10.1007/978-94-011-0727-3_2
- L. Zhou, H. Chen, X. Jiang, F. Lu, Y. Zhou, W. Yin and X. Ji, “Modification of Montmorillonite Surfaces Using a Novel Class of Cationic Gemini Surfactants,” Journal of Colloid and Interface Science, Vol. 332, No. 1, 2009, pp. 16-21. doi:10.1016/j.jcis.2008.12.051
- D. Vantelon and E. M. Peller, “Iron Distribution in the Octahedral Sheet sDiactohedral Smectites. An Fe K-Edge X-Ray Absorption Spectroscopy Study,” Physics and Chemistry of Minerals, Vol. 30, No. 1, 2003, pp. 44-53. doi:10.1007/s00269-002-0286-y
- V. Ganesan and A. Walcarius, “Surfactant Template Sulfonic Acid Fonctionnalized Silica Microsphere as New Efficient Ion Exchange and Electrode Modifiers,” Langmuir, Vol. 20, No. 9, 2004, pp. 3632-3640. doi:10.1021/la0364082
- I. K. Tonle, E. Ngameni and A. Walcarius, “From Clay to Organoclay-Film Modified Electrodes: Tuning Charge Selectivity in Ion Exchange Voltammetry,” Electrochimica Acta, Vol. 49, No. 20, 2004, pp 3435-3443. doi:10.1016/j.electacta.2004.03.012
- E. Ngameni, I. K. Tonle, J. T. Apohkeng, R. B. Bouwe, A. T. Jieumboue and A. Walcarius, “Permselective and Preconcentration Properties of a Surfactant-Intercalated Clay Modified Electrode,” Electroanalysis, Vol. 18, No 22, 2006, pp. 2243-2250. doi:10.1002/elan.200603654
- D. Ozkan, K. Kerman, B. Meric, P. Kara, H. Demirkan, M. Polverejan, T. J. Pinnavaia and M. Ozsoz, “Heterostructured Fluorohectorite Clay as an Electrochemical Sensor for the Detection of 2,4-Dichlorophenol and the Herbicide 2,4-D,” Chemistry of Materials, Vol. 14, No. 4, 2002, pp. 1755-1761. doi:10.1021/cm011529d
- P. Falaras and F. Lezou, “Electrochemical Behavior of Acid Activated Montmorilonite Modified Electrode,” Journal of Electroanaytical Chemistry, Vol. 455, No. 1-2, 1998, pp.169-179. doi:10.1016/S0022-0728(98)00272-1
- J. A. Farrington, A. Ledwith, and M. F. Stam, “CationRadicals: Oxidation of Methoxide Ion with 1,1’-Dimethyl- 4,4’-bypyridylium Dichloride (Paraquat Dichloride),” Journal of the Chemical Society D: Chemical Communications, Vol. 6, 1969, pp. 259-260.
- D. De Souza and S. A. S. Machado, “Electrochemical Detection of the Herbicide Paraquat in Natural Water and Citric Fruit Juices Using Microelectrodes,” Analytica Chimica Acta, Vol. 546, No. 1, 2005, pp. 85-91. doi:10.1016/j.aca.2005.05.020
NOTES
*Corresponding author.