American Journal of Analytical Chemistry
Vol.3 No.10(2012), Article ID:23624,6 pages DOI:10.4236/ajac.2012.310093
A Stability Indicating UPLC Method for Candesartan in Bulk Drug Samples
1CTO-2, Dr. Reddy’s Laboratories Ltd., Hyderabad, India
2Centre for Chemical Sciences and Technology, Institute of Sciences and Technology, Jawaharlal Nehru Technological University, Hyderabad, India
Email: *Kmukkanti@yahoo.co.in
Received July 13, 2012; revised August 30, 2012; accepted September 8, 2012
Keywords: Column Chromatography; Forced Degradation; Stress Conditions; Candesartan Cilexetil
ABSTRACT
A simple, sensitive gradient rapid resolution liquid chromatographic assay method has been developed for the quantitative determination of Candesartan Cilexetil in bulk active pharmaceutical ingredient, used for the treatment of hypertension. The developed method is also applicable for the process related impurities determination. Efficient chromatographic separation was achieved on a C18 stationary phase with simple mobile phase combination delivered in a gradient mode and quantification was by ultraviolet detection at 210 nm at a flow rate of 0.4 mL·min−1. In the developed UPLC method the resolution between Candesartan Cilexetil and its two potential impurities was found to be greater than 2.0. Regression analysis showed an r value (correlation coefficient) greater than 0.99 for Candesartan Cilexetil and its two impurities. This method was capable to detect two impurities of Candesartan Cilexetil at a level of 0.003% with respect to test concentration of 1.0 mg·mL−1 for a 2 μL injection volume. The bulk active pharmaceutical ingredient was subjected to stress conditions of hydrolysis, oxidation, photolysis and thermal degradation. Considerable degradation was found to occur in oxidative stress conditions. The stress samples were assayed against a qualified reference standard and the mass balance was found close to 99.5%. The developed RP-LC method was validated with respect to linearity, accuracy, precision and robustness.
1. Introduction
Candesartan Cilexetil, 2-ethoxy-1-({4-[2-(2H-1,2,3,4-tetrazol-5-yl) phenyl] phenyl} methyl)-1H-1, 3-benzodiazole-6-carboxylic acid is an angiotensin II receptor antagonist used mainly for the treatment of hypertension. Candesartan Cilexetil (Candesartan) is in a class of drugs called angiotensin receptor blockers which includes losartan (Cozaar), valsartan (Diovan), and irbesartan (Avapro). Like these other drugs, candesartan blocks the ability of the chemical angiotensin II to raise the blood pressure by constricting or squeezing arteries and veins. This leads to a reduction in blood pressure. In addition, by reducing the pressure against which the heart must pump blood, candesartan reduces the work of the heart and is useful in patients with heart failure. The effects of angiotensin II also can be blocked by another class of drugs called Angiotensin Converting Enzyme (ACE) inhibitors which prevent the formation of angiotensin II. ACE inhibitors include captopril (Capoten), enalapril (Vasotec), benazepril (Lotensin), and lisinopril (Zestril).
Candesartan was approved by the FDA in 1998 [1-6].
Few LC methods were reported in the literature for the analysis in biological samples [8]. Extensive literature survey reveals there is no stability indicating UPLC method for determination of related substances and quantitative estimation of Candesartan in bulk drugs and pharmaceutical dosage forms. An ideal stability indicating chromatographic method should estimate the drug to be able to resolve from its potential impurities and degradation products. The present drug stability test guide line Q1A (R2) issued by International Conference on Harmonization (ICH) suggested that stress studies should be carried out on a drug to establish its inherent stability characteristic, leading to separation of degradation products and hence supporting the stability of the proposed analytical procedures. It also requires that analytical test procedures for stability samples should be stability indicating and they should be fully validated [9].
Hence, an attempt has been made to develop an accurate, rapid, specific and reproducible method for the determination of Candesartan and two impurities in bulk drug samples and in pharmaceutical dosage forms along with method validation as per ICH norms. The stability tests were also performed on both drug substances and drug products as per ICH norms.
2. Experimental
2.1. Chemicals
Samples of Candesartan and its related impurities were received from Enaltech Labs (Figure 1) LC grade acetonitrile, analytical Trifloro Acetic acid and Triethyl amine were purchased from Merck, Darmstadt, Germany. High purity water was prepared by using Millipore MilliQ plus water purification system. All samples and impurities used in this study were greater than 99.0%.
2.2. Equipment
The UPLC system used for method development, forced degradation studies and method validation was a water Accquity binary pump plus auto sampler and photo diode array detector. The output signal was monitored and processed using Empower software on Pentium computer (Digital Equipment Co.). Photo stability studies were carried out in a photo stability chamber (Sanyo, Leicestershire, UK). Thermal stability studies were performed in a dry air oven (Merck Pharmatech, Mumbai, India).
2.3. Chromatographic Conditions
The chromatographic column used was a Zorbax Extended C18 (50 × 4.6 mm) with 1.8 µm particles. The mobile phase A consists of 0.1% Triethyl amine in water pH 2.2 with TFA and mobile phase B consists of 0.1% TFA in acetonitrile and water in the ratio (95:5). The column temperature was maintained at 40˚C and detector was monitored at a wavelength of 210 nm. The injection volume 5 µl. acetonitrile and water was used as a diluent.
3. Precision of Solution
3.1. Precision of Standard Solution
A stock solution of Candesartan (2.0 mg·ml–1) was prepared by dissolving an appropriate amount in diluent. Working solutions were prepared from above stock solution for related substance determination and assay determination, respectively. A stock solution of impurities (mixture of imp-A and imp-B) at a concentration of 0.5 mg·ml–1 was also prepared in diluent.
3.2. Specificity
Specificity is the ability of the method to measure the analyte response in the presence of its potential impurities. Stress testing of the drug substance can help to identify the likely degradation products, which can in turn help to establish the degradation path ways and the insentric stability of the molecule and validated the stability indicating power of the analytical procedures used.
The specificity of the Candesartan in the presence of its impurities namely imp-A and imp-B and degradation products was determined by the developed UPLC method. Forced degradation studies were also performed on Candesartan to provide an indication of the stability indicating property of the proposed method. The stress conditions employed for degradation study including light (carried out as per ICH Q1B), heat (60˚C), acid hydrolysis (1N HCl), base hydrolysis (0.1 N NaOH), water hydrolysis (room temperature at 6 h) and oxidation (3% H2O2). For heat light studies the study period was 48 h where as acid, base, peroxide and water hydrolysis the test period was 6 h. Peak purity of stressed samples of Candesartan was checked by using a photo diode array detector of waters corporation, MA, USA.
3.3. Analytical Method Validation
The developed chromatographic method was validated for linearity, precision, accuracy, sensitivity, robustness and system suitable.
3.4. Precision
The precision of the related substances method was checked by injecting six individual preparations of (500 µg·ml–1) Candesartan spiked with 0.15% each imp-A
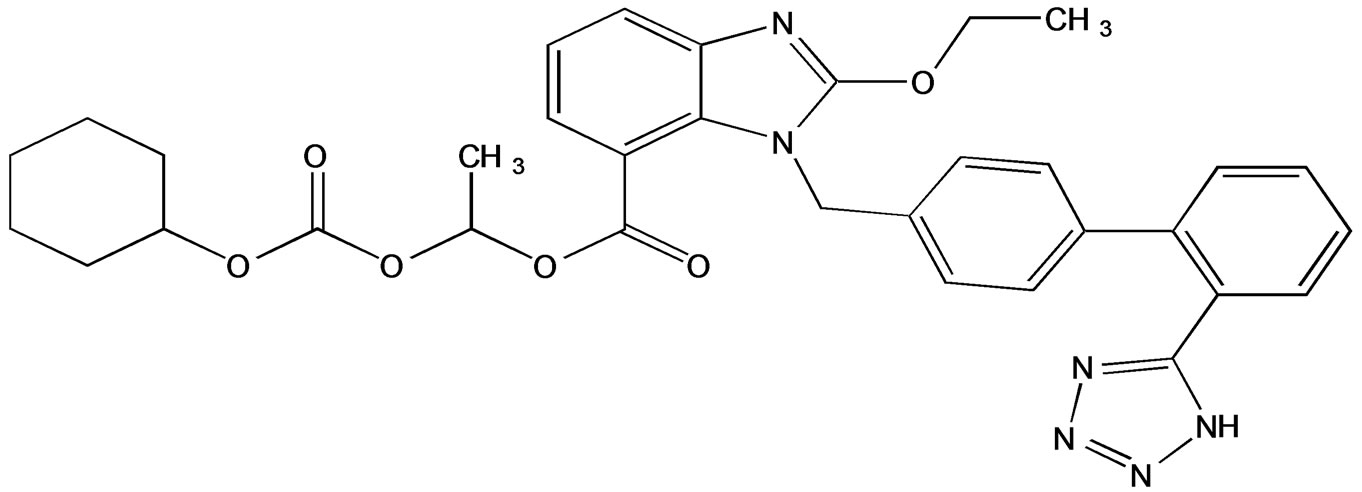
Figure 1. Chemical structure of candesartan.
and imp-B. Each % RSD area of imp-A and imp-B was calculated. Precision study was also determined by performing the same procedures on a different day (inter day precision).
The intermediate precision (ruggedness) of the method was also evaluated by a different analyst, different column and different instrument in the same laboratory.
Assay method precision was evaluated by carrying out six independent assays of test sample of Candesartan against qualified reference standard. The % RSD of six assay values obtained was calculated. The intermediated precision of the assay method was evaluated by different analyst and by using different instrument from the same laboratory.
3.5. Sensitivity
Sensitivity was determined by establishing the limit of detection (LOD) and limit of quantification (LOQ) for imp-A and imp-B estimated at a signal to noise ratio of 3:1 and 10:1 respectively, by injecting a series of dilute solutions with known concentrations. The precision study was also carried out at the LOQ level by injecting six individual preparations of imp-A and imp-B and the % RSD for the areas of each impurity was calculated.
3.6. Linearity and Range
Linearity test solutions for the assay method has prepared from stock solution at five concentration levels from 50% to 200% of assay analyte concentration (250, 375, 500, 750 and 1000 µg·ml–1).
A linearity test solution for related substance method was prepared by diluting the impurity stock solution to required concentrations. The solutions were prepared at seven concentration levels. From LOQ to 200% of the permitted maximum level of the impurity (i.e. LOQ 0.0375%, 0.075%, 0.01125%, 0.15%, 0.225% and 0.3%) was subjected to linear regression analysis with the least squares method. Calibration equation obtained from regression analysis was used to calculate the corresponding predicted responses. The residuals and sum of residual squares were calculated from the corresponding predicted responses.
Linearity was checked for three consecutive days in the same concentration range for both assay and related substances method and % RSD value of the slope and yintercept of the calibration curve were calculated. Upper and lower levels of range were also established.
3.7. Accuracy
The accuracy of the assay method was evaluated in triplicate at five concentration levels i.e. 250, 375, 500, 750 and 1000 µg·ml–1 in bulk drug sample. At each concentration there sets were prepared and injected in triplicate.
The percentage of recovery was calculated at each level.
The study was carried out in triplicate at 0.075%, 0.125%, 0.15%, 0.225% and 0.3% of the analyte concentration (500 µg·ml–1). The percentage of recoveries of imp-A and imp-B were calculated.
3.8. Robustness
To determine the robustness of the developed method, experimental conditions were deliberately changed and the resolution (Rs) between Candesartan and imp-A and imp-B were evaluated. The flow rate of the mobile phase was 0.4 ml·min–1. To study of the effect of flow rate on the developed method 0.1 units of flow were changed (i.e. 0.3 and 0.5 ml·min–1). The effect of column temperature on the developed method was studied at 35˚C and 45˚C instead of 40˚C. The effect of pH on resolution of impurities was studied by varying ± 0.1 pH units (i.e. buffer pH altered from 2.2 to 2.1 and 2.3). In all the above varied conditions, the components of the mobile phase were held constant.
3.9. Solution Stability and Mobile Phase Stability
The solution stability of Candesartan in the assay method was carried out by leaving the test solutions of samples in tightly capped volumetric flasks at room temperature for 48 h. The same sample solutions were assayed at 6 h interval up to the study period against freshly prepared standard solution. The mobile phase stability was also carried out by assaying the freshly prepared sample solution against freshly prepared reference standard solution at 6 h intervals up to 48 h. Mobile phase prepared was kept constant during the study period, The % RSD of assay of Candesartan was calculated for the study period during mobile phase and solution stability experiments.
The solution stability of Candesartan and its related impurities was carried out by leaving both spiked and un spiked sample solution in tightly capped volumetric flasks at room temperature for 48 h. Content of imp-A and imp-B were determined at every 6 h interval up to the study period.
Mobile phase stability was also carried out for 48 h by injecting the freshly prepared sample solution, for every 6 h interval. Content of imp-A and imp-B was checked in the test solutions. Mobile phase prepared was kept constant during the study period.
4. Results and Discussion
4.1. Method Development and Optimization
The main objective of the chromatographic method is to separate Candesartan from imp-A and imp-B were co eluted using different stationary phases such as C8, Phenyl and cyano as well as different mobile phases. The Chromatographic separation was achieved on a Zorbax Extended C18 (50 × 4.6 mm) with 1.8 µm column. The peak shape of Candesartan was found to be symmetrical. In optimized chromatographic conditions the peak shape of Candesartan was found to symmetrical and impurities, imp-A and imp-B were separated with a resolution greater than 2, typical retention times were about 0.86, 1.48 and 2.76 min respectively (Figure 2). The system suitability results are given in Table 1 and the developed UPLC method was found to be specific for Candesartan and its two impurities namely imp-A and imp-B (Figure 2). The relative response factors are shown in Figure 3.
4.2. Results of Forced Degradation
Degradation was not observed in Candesartan sample when subjected to stress conditions like photolytic, thermal and aqueous hydrolysis. Candesartan was degraded under oxidation, acid and base hydrolysis. Peak purity test results obtained by using PDA detector conformed that the Candesartan peak is homogeneous and pure in the entire analysed stress sample. The assay of Candesartan is unaffected in the presence of Imp-A and imp-B and its degradation products confirm the stability indicating power of the method. The summary of forced degradation studies is given Table 2.
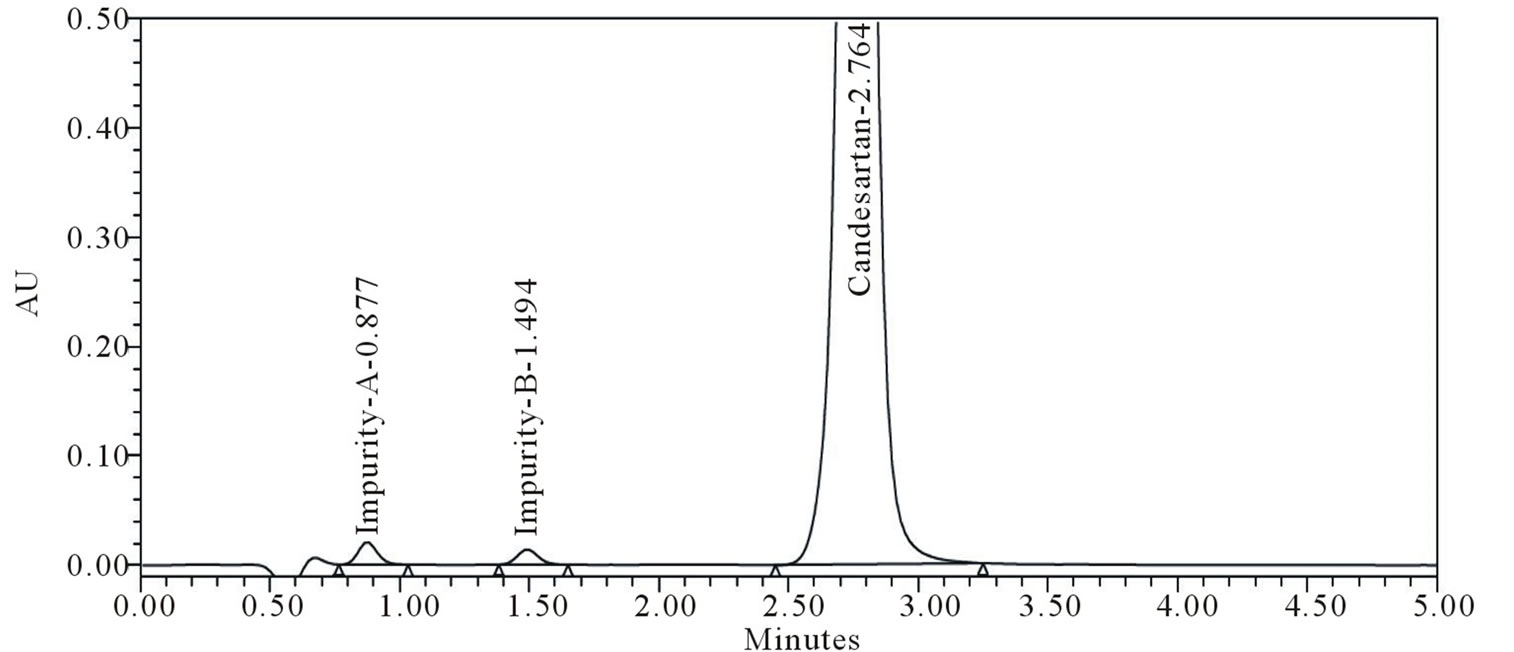
Figure 2. Candesartan spike with 0.3% level impurities.
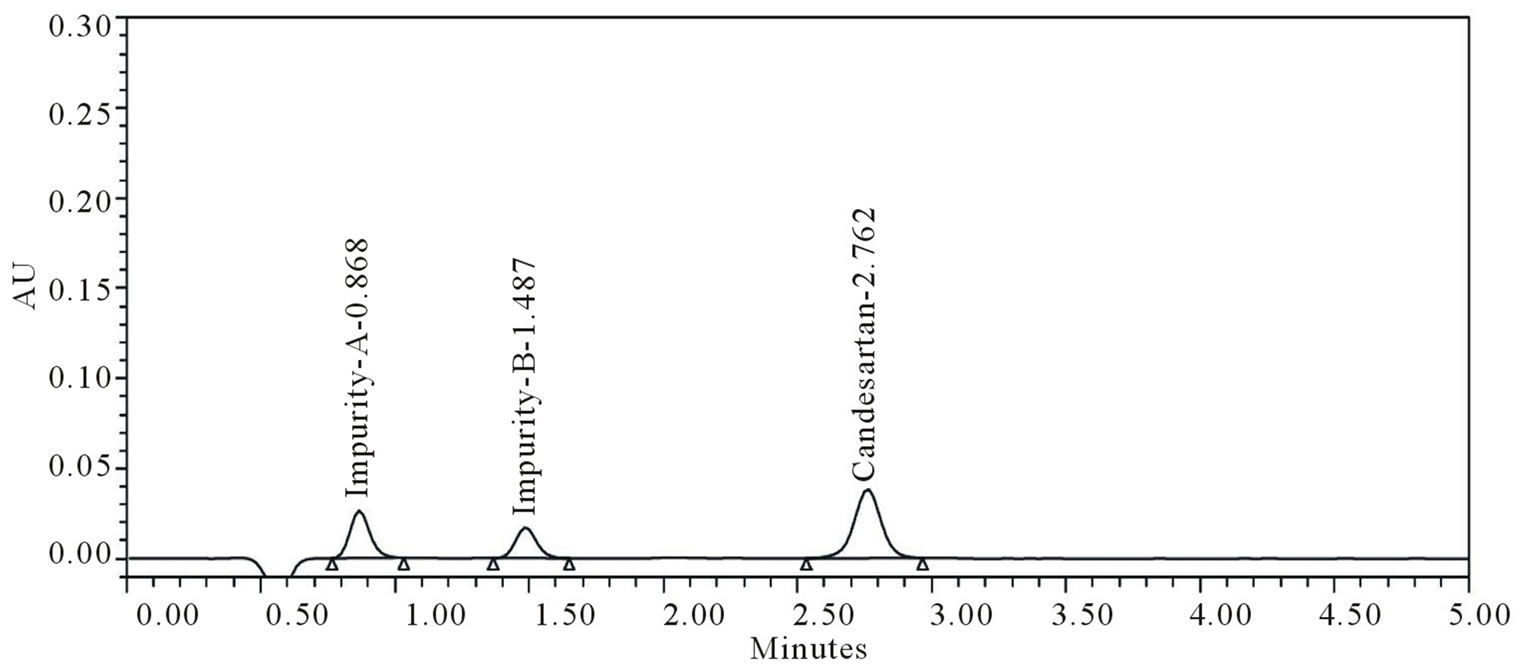
Figure 3. RRF solution of impurities and samples.
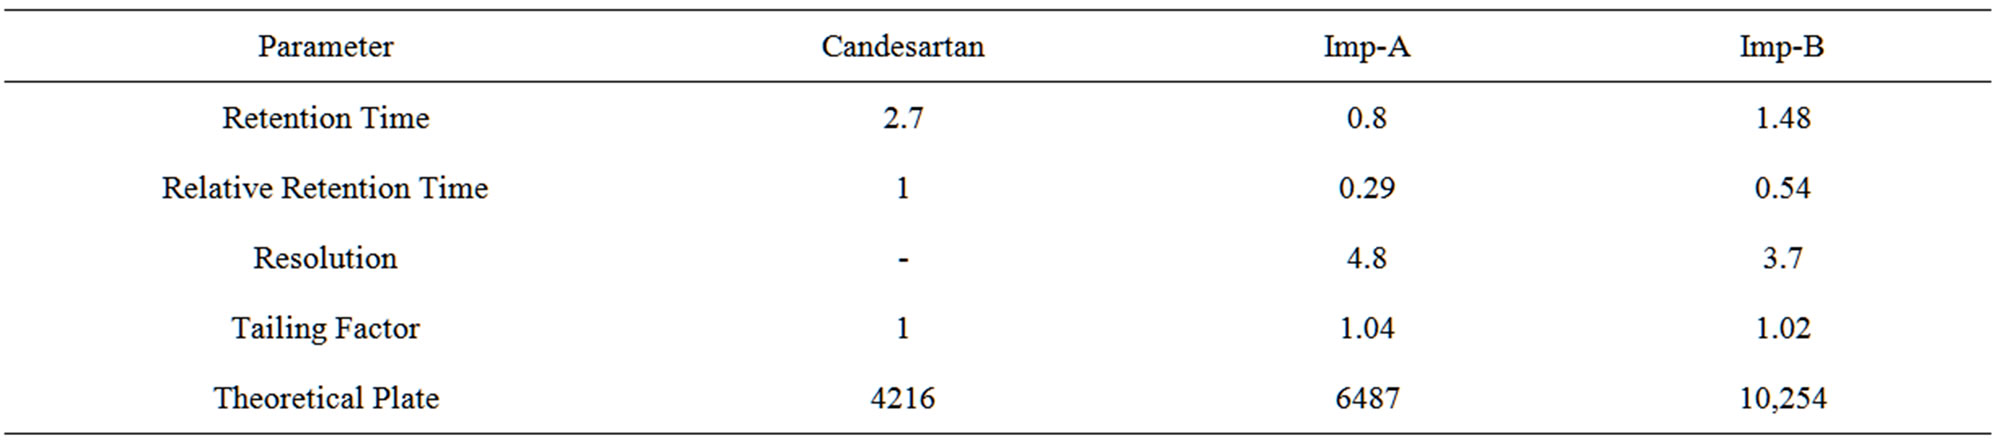
Table 1. System suitability parameters.
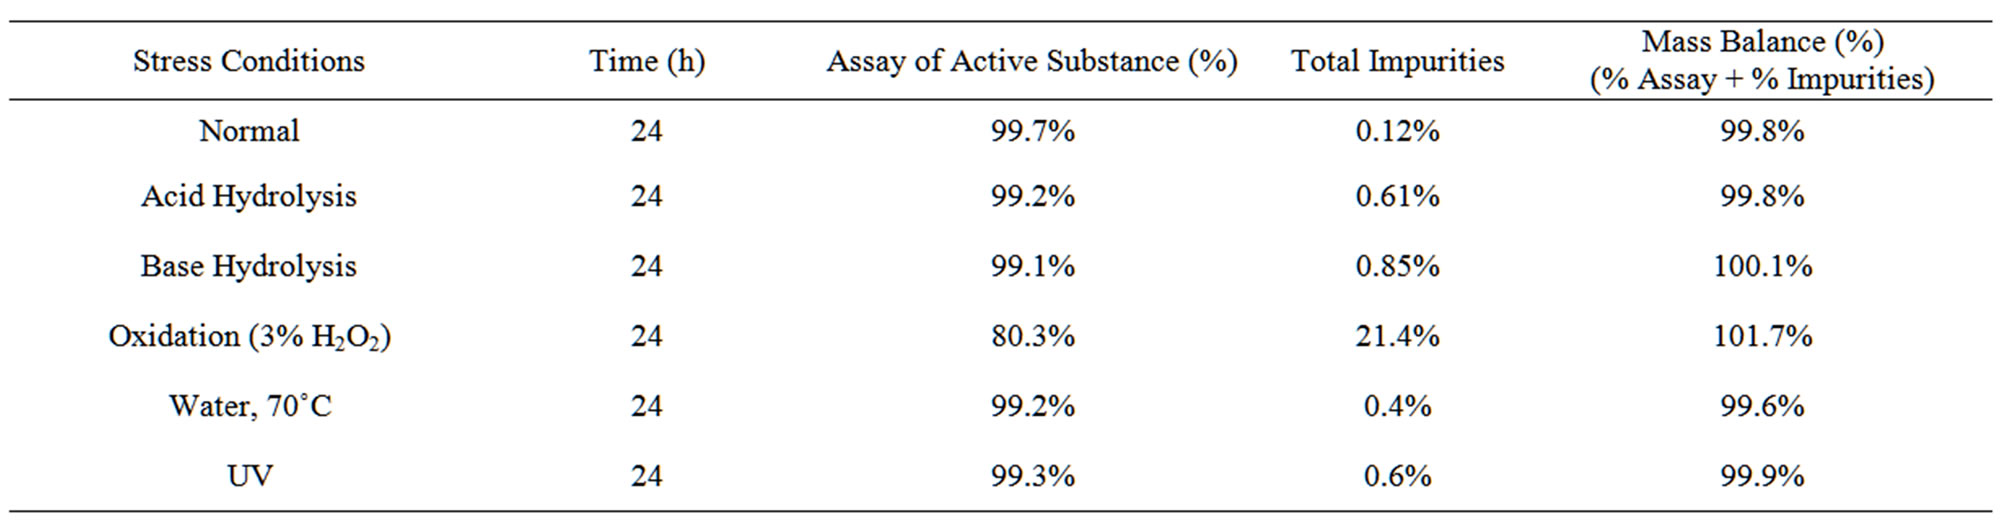
Table 2. Summary of forced degradation data.
4.3. Precision
The % RSD of assay of Candesartan during the assay method precision study was within 0.04% and % RSD for the imp-A and imp-B in related substance method precision study was within 2.5%. The % RSD of the assay results obtained in the intermediate precision study was within 0.09% and the % RSD for the area of imp-A and imp-B were well within 4.06%, conforming good precision of the method.
4.4. Limit of Detection and Limit of Quantification
The limit of detection of all the impurities namely imp-A and imp-B was achieved at 0.016% for 5 µl injection volume. The limit of quantification for all impurities namely imp-A and imp-B was achieved at 0.048% for a 5 µl injection volume. The precision at the LOQ concentrations for imp-A and imp-B were below 5.2%.
4.5. Linearity
The linearity calibration plot for the assay method was obtained over the calibration ranges tested, i.e. 5 - 60 µg·ml–1 and correlation coefficient obtained was 0.999. The result showed that an excellent correlation existed between the peak area and concentration of the analyte.
Linear calibration plot for the related substances method was obtained over the calibration ranges tested i.e. LOQ (0.05%) to 0.3% for imp-A and imp-B. The correlation coefficient obtained was greater than 0.999. The above results showed that an excellent correlation existed between the peak area and the concentration of imp-A and imp-B.
4.6. Accuracy
The percentage recovery of Candesartan in bulk drug samples ranged from 99.8% to 100.3%. The percentage recovery of impurities in Candesartan samples varied from 97.5% to 102.4%.
4.7. Robustness
In all the deliberate varied chromatographic conditions
(flow rate and column temperature), the resolution between imp-A and imp-B was greater than 4.0, illustrating the robustness of the method.
4.8. Solution Stability and Mobile Phase Stability
The % RSD of the assay of Candesartan during solution stability experiments were within 0.5%. No significance changes were observed in the content of impurities namely imp-A and imp-B during the solution stability and mobile phase stability experiments when performed using the related substance method. The solution stability and mobile phase stability experiment data confirmed that the sample solutions and mobile phases used during the assay and related substance determination were stable for at least 48 h.
5. Conclusion
The UPLC method developed for quantitative and related substances determination of Candesartan is precise, accurate, rapid and specific. The method was fully validated, and the data found to be satisfactory for all the method validation parameters tested. The developed method is stability indicating and can be conveniently used by a quality control department to determine the related substance and assay of regular Candesartan commercial samples and also stability samples.
6. Acknowledgements
The author would like to thank the management of Dr. Reddy’s laboratories, Hyderabad, India for their support to carry out this investigation.
REFERENCES
- E. Nevin, “Simultaneous Analysis of Candesartan Cilexetil and Hydrochlorothiazide in Human Plasma and Dosage Forms Using HPLC with a Photodiode Array Detector,” Journal of Liquid Chromatography & Related Technologies, Vol. 26, No. 15, 2003, pp. 2581-2591. doi:10.1081/JLC-120023802
- C. Fenton and L. J. Scott, “A Review of Its Use in the Management of Chronic Heart Failure,” Drugs, Vol. 65, No. 4, 2005, pp. 537-558. doi:10.2165/00003495-200565040-00007
- R. Revathi, T. Ethiraj, J. L. Marreddy and V. Ganeshan, “Development and Validation of a Dissolution Test for Candesartan Cilexetil in Tablet Forms Using Reverse Phase—High Performance Liquid Chromatography,” Journal of Pharmaceutical Education and Research, Vol. 2, No. 2, 2011, pp. 71-77.
- M. M. Annapurnaa, A. Narendra and K. R. Kumar, “Liquid Chrmotographic Method for Determination of Candesartan Cilexetil and Hydrochlorothiazide in Pharmaceutical Dosage Forms,” Journal of Drug Delivery & Therapeutics, Vol. 2, No. 2, 2012, pp. 48-54.
- K. B. Tejaswini, K. M. Shrinivas and S. M. Chandrakant, “Simultaneous Estimation of Candesartan Cilexetil and Hydrochlorothiazide in Tablet Dosage Form by UV Spectrophotometric Method,” International Journal of Pharmtech Research, Vol. 4, No. 2, 2012, pp. 786-790.
- S. T. Prajapati, P. K. Patel, M. Patel, V. B. Chauhan and C. N. Patel, “Development and Validation of the Liquid Chromatography-Tandem Mass Spectrometry Method for Quantitative Estimation of Candesartan from Human Plasma,” Pharmaceutical Methods, Vol. 2, No. 2, 2011, pp. 130-134.
- B. H. Mehta and S. B. Morge, “HPTLC-Densitometric Analysis of Candesartan Cilexetil and Hydrochlorothiazide in Tablets,” Journal of Planar Chromatography, Modern TLC, Vol. 21, No. 2, 2008, pp. 173-176. doi:10.1556/jpc.21.2008.3.3
- Y. D. Zhang, X. H. Wei, A. F. Wang, Y. J. Xu, X. H. Zhu and J. M. Luo, “HPLC Determination of Candesartan Cilexetil and Its Related Substances,” Central South Pharmacy, Vol. 2, No. 2, 2004, pp. 80-83.
- N. Devanaboyina and T. Satyanarayana, “Simultaneous Determination of Candesartan and Hydrochlorothiazide in Combined Pharmaceutical Dosage Form by New RPHPLC Method,” Research Journal of Pharmaceutical, Biological and Chemical, Sciences, Vol. 3, No. 1, 2012, pp. 270-278.
NOTES
*Corresponding author.