American Journal of Analytical Chemistry
Vol. 3 No. 5 (2012) , Article ID: 19441 , 7 pages DOI:10.4236/ajac.2012.35050
Development and Validation of Stability Indicating RP-LC Method for Estimation of Ranolazine in Bulk and Its Pharmaceutical Formulations
Department of Chemistry, Acharya Nagarjuna University Nuzivid Campus, Andhra Pradesh, India
Email: *grreddy121@yahoo.com
Received March 9, 2012; revised March 21, 2012; accepted April 22, 2012
Keywords: Ranolazine; RP-LC; Validation; Dosage Form
ABSTRACT
An isocratic reverse phase liquid chromatography (RP-LC) method has been developed and subsequently validated for the determination of Ranolazine in Bulk and its pharmaceutical formulation. Separation was achieved with a X-terra RP-18 (Make: Waters Corporation; 150 mm × 4.6 mm I.D.; particle size 5 µm) Column and Sodium di-hydrogen phosphate monohydrate buffer with Tri ethyl amine (pH adjusted to 5.0 with diluted orthophosphoric acid): Acetonitrile (600:400) v/v as eluent at a flow rate of 1.0 mL/min. UV detection was performed at 225 nm. The method is simple, rapid, and selective. The described method of Ranolazine is linear over a range of 11.98 µg/mL to 37.92 µg/mL. The method precision for the determination of assay was below 1.0%RSD. The percentage recoveries of active pharmaceutical ingredient (API) from dosage forms ranged from 99.1% to 100.9%. The results showed that the proposed method is suitable for the precise, accurate and rapid determination of Ranolazine in bulk, its capsule dosage forms.
1. Introduction
Ranolazine [1-3] (Figure 1) a piperazine derivative is a new antianginal agent approved for the treatment of chronic stable angina pectoris. Ranolazine has antianginal and anti-ischemic effects that do not depend upon reductions in heart rate or blood pressure. Ranolazine reduces the late sodium current and, is expected to decrease sodium entry into ischemic myocardial cells. As a consequence, ranolazine is proposed to reduce calcium uptake indirectly via the sodium/calcium exchanger. It has a cardio protective effect against ischemia or reperfusion injury, without affecting hemo-dynamics, both in vitro and in vivo. Its anti-ischemic action is thought to be by modifycation of metabolism, specifically, activation of pyruvate dehydrogenase and promotion of glucose oxidation with concomitant reduction in fatty acid oxidation. Thus Ranolazine can enhance utilization of oxygen under conditions of oxygen supply deficiency. Ranolazine, chemically is (RS)-N-(2,6-dimethylphenyl)-2-[4-[2- hydroxy-3-(2-methoxyphenoxy)propyl]piperazin-1-yl] acetamide, which was initially known to prolong the QT interval. The drug can be used in combination with other anti angina drugs for patients who have not achieved an adequate response.
The reported medical benefits of ranolazine have emphasized the urgent needs for analytical techniques for quantification of ranolazine in phartmaceutical substance and its different formulations. Although there are certain methods reported in literature for estimation of Ranolazine by LC-MS, LC and UV methods, besides they lack of stability indication, complicated sample processing procedures, low sensitivity and time consuming gradient elution.
The authors have developed a new, simple and fast analytical method by RP-LC, which is stability indicating to quantify Ranolazine in bulk and its dosage forms. It has been shown that the method presented here is rapid, convenient, inexpensive, flexible and sufficiently sensitive for analysis of Ranolazine in pharmaceutical substance and its formulations with acceptable recovery and
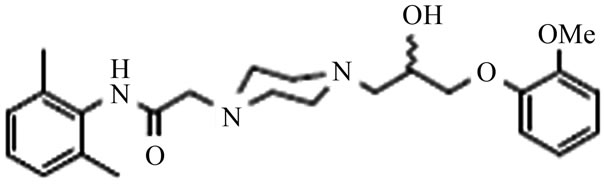
Figure 1. Chemical structure of Ranolazine.
precision. This validation study is carried out as per ICH guidelines.
2. Experimental [4-6]
2.1. Instrumentation
The analysis of the drug was carried out on a waters LC system equipped with 2695 pump and 2996 photodiode array detector was used and a Reverse phase HPLC column Xterra RP-18 ((Make: Waters Corporation, Ireland); 150 mm × 4.6 mm I.D.; particle size 5 µm)) was used. The output of signal was monitored and integrated using waters Empower 2 software.
2.2. Chemicals and Solvents
Milli-Q Water, Acetonitrile (HPLC Grade), Methanol (HPLC Grade), Orthophosphoric acid (GR Grade), Sodium dihydrogen phosphate monohydrate (GR Grade) and Tri ethylamine (GR Grade) were obtained from Qualigens Ltd., Mumbai.
2.3. Buffer Preparation
Accurately weigh and transfer about 2.72 grams of Sodium di-hydrogen phosphate monohydrate and 2 mL of tri ethylamine in 1000 mL of purified water and mix. Adjust pH to 5.0 (±0.05) with dilute orthophosphoric acid solution. Filter the solution through 0.45 µm membrane filter.
2.4. Mobile Phase Preparation
Prepare a filtered and degassed mixture of Buffer and Acetonitrile in the ratio of 600:400 (v/v) respectively.
2.5. Diluent Preparation
Methanol is used initially for extracting the drug and consequent dilutions are made with mobile phase.
2.6. Standard Preparation (for Ranolazine Tablets 500 mg)
Accurately weigh and transfer about 50.0 mg of Ranolazine into a 100 mL volumetric flask, add 60 mL of methanol and sonicate to dissolve. Cool the solution to room temperature and dilute to volume with methanol. Transfer 5.0 mL of the above solution into a 100 mL volumetric flask and dilute to volume with diluent (Mobile Phase).
2.7. Sample Preparation (for Ranolazine Tablets 500 mg)
Weigh and finely powder not fewer than 20 Tablets. Accurately weigh and transfer equivalent to 50 mg of Ranolazine into a 100 mL volumetric flask add about 70 mL of methanol, and sonicate for 30 minutes with intermittent shaking at controlled temperature and dilute to volume with methanol and mix. Filter the solution through 0.45 µm membrane Filter. Transfer 5.0 mL of the above solution into a 100 mL volumetric flask and dilute to volume with diluent.
2.8. Chromatographic Conditions
An X-terra ((Make: Waters Corporation (Ireland); 150 mm × 4.6 mm I.D.; particle size 5 µm)) Column was used for analysis at ambient column temperature. The mobile phase was pumped through the column at a flow rate of 1.0 mL/min. The sample injection volume was 5 µL. The photodiode array detector was set to a wavelength of 225 nm for the detection and Chromatographic runtime was 10 minutes.
3. Results and Discussion
3.1. Method Development [4-6]
To develop a suitable and robust LC method for the determination of Ranolazine, different mobile phases were employed to achieve the best separation and resolution. The method development was started with X-terra ((Make: Waters Corporation (Ireland); 150 mm × 4.6 mm I.D.; particle size 5 µm)) with the following mobile phase. Accurately weigh and transfer about 2.72 grams of Sodium di-hydrogen phosphate monohydrate and 2 mL Triethyl amine in 1000 mL of purified water and mix. Adjust pH to 5.0 (±0.05) with dilute orthophosphoric acid solution. Filter the solution through 0.45 µm membrane filter. Prepare a filtered and degassed mixture of Buffer and Acetonitrile in the ratio of 500:500 (v/v) respectively.
Ranolazine peak was eluted at void volume. For next trial the mobile phase composition was changed slightly. The mobile phase composition was Buffer and Acetonitrile in the ratio of 550:450 (v/v). above trail the peak shape was little broad. Again the mobile phase composition changed slightly to Buffer and Acetonitrile in the ratio of 600:400 (v/v) respectively as eluent at flow rate 1.0 mL/min. UV detection was performed at 225 nm. The retention time of Ranolazine is 4.0 minutes (refer Figure 2) and the peak shape was good.
The chromatogram of Ranolazine standard using the proposed method is shown in (Figure 2) System suitability results of the method are presented in Table 1. Ranolazine shows significant UV absorbance at Wavelength 225 nm. Hence this wavelength has been chosen for detection in analysis of Ranolazine.
3.2. Method Validation [4-6]
The developed RP-LC method extensively validated for assay of Ranolazine using the following Parameters.
3.2.1. Specificity
Blank and Placebo Interference
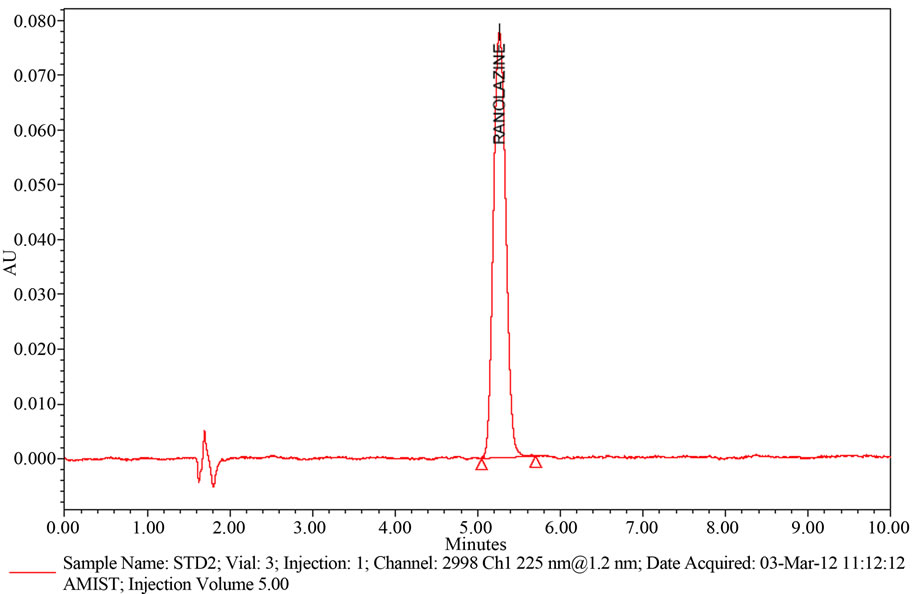
Figure 2. A typical HPLC Chromatogram showing the peak of Ranolazine.
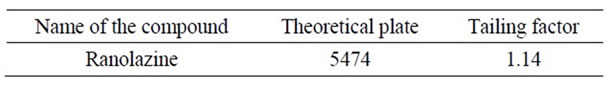
Table 1. System suitability parameters for Ranolazine by proposed method.
A study to establish the interference of blank and placebo were conducted. Diluent and placebo was injected into the chromatograph in the defined above chromatographic conditions and the blank and placebo chromatograms were recorded. Chromatogram of Blank solution (Figure 3) showed no peaks at the retention time of Ranolazine peak. This indicates that the diluent solution used in sample preparation do not interfere in estimation of Ranolazine in Ranolazine tablets. Similarly Chromatogram of Placebo solution (Figure 4) showed no peaks at the retention time of Ranolazine peak. This indicates that the Placebo used in sample preparation do not interfere in estimation of Ranolazine in Ranolazine tablets.
The chromatogram of Ranolazine Blank using the proposed method is shown in Figure 4.
The chromatogram of Ranolazine Placebo using the proposed method is shown in Figure 3.
3.2.2. Forced Degradation
3.2.2.1. Control Sample
Weigh and finely powder not fewer than 20 Tablets. Accurately weigh and transfer equivalent to 50 mg of Ranolazine into a 100 mL volumetric flask add about 70 mL of methanol, and sonicate for 30 minutes with intermittent shaking at controlled temperature and dilute to volume with methanol and mix. Filter the solution through 0.45 µm membrane Filter. Transfer 5.0 mL of the above solution into a 100 mL volumetric flask and dilute to volume with diluent.
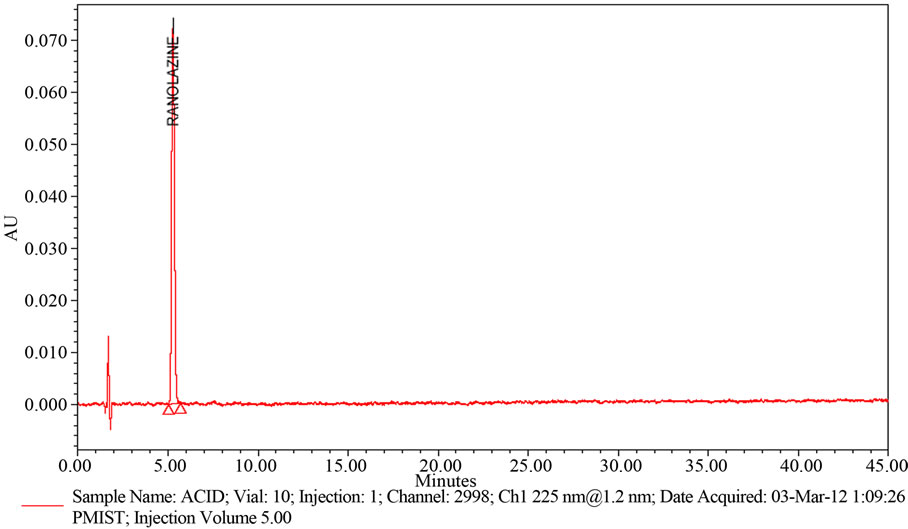
3.2.2.2. Acid Degradation Sample
Weigh and finely powder not fewer than 20 Tablets. Accurately weigh and transfer equivalent to 50 mg of Ranolazine into a 100 mL volumetric flask add about 70 mL of methanol, and sonicate for 30 minutes with intermittent shaking at controlled temperature. Then add 10 mL of 5 N acid, refluxed for 30 min at 60˚C, then cooled to room temperature, neutralize with 5 N NaOH and dilute to volume with methanol and mix. Filter the solution through 0.45 µm membrane Filter. Transfer 5.0 mL of the above solution into a 100 mL volumetric flask and dilute to volume with diluent (Refer Figure 5(a)).
3.2.2.3. Base Degradation Sample
Weigh and finely powder not fewer than 20 Tablets. Accurately weigh and transfer equivalent to 50 mg of Ranolazine into a 100 mL volumetric flask add about 70 mL of methanol, and sonicate for 30 minutes with intermittent shaking at controlled temperature. Then add 10 mL of 5 N Base (NaOH), refluxed for 30 min at 60˚C, then cooled to room temperature, neutralize with 5 N Acid (HCl) and dilute to volume with methanol and mix. Filter the solution through 0.45 µm membrane Filter. Transfer 5.0 mL of the above solution into a 100 mL volumetric flask and dilute to volume with diluent (Refer Figure 5(b)).
3.2.2.4. Peroxide Degradation Sample
Weigh and finely powder not fewer than 20 Tablets. Accurately weigh and transfer equivalent to 50 mg of Ranolazine into a 100 mL volumetric flask add about 70 mL of methanol, and sonicate for 30 minutes with
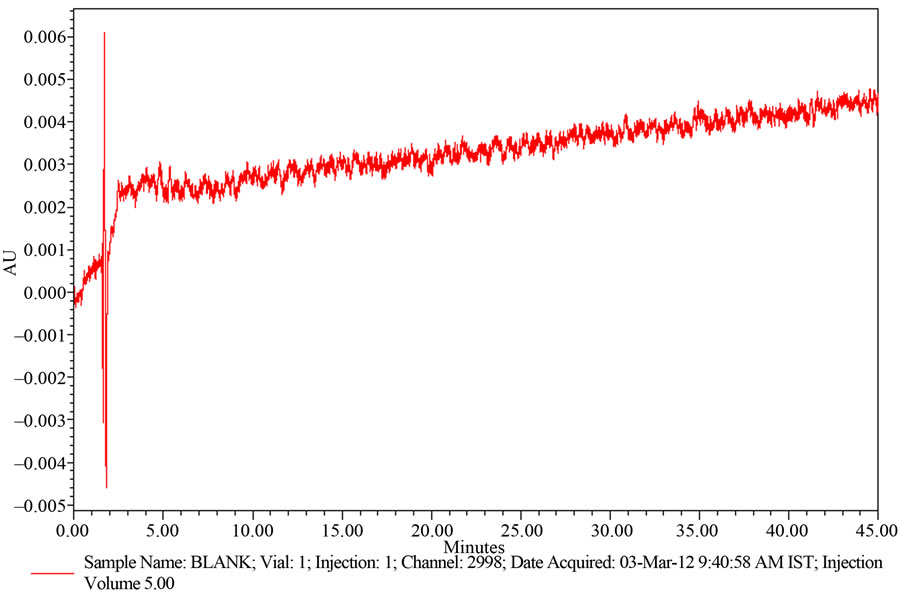
Figure 3. A typical HPLC Chromatogram showing the no interference of diluent for Ranolazine.
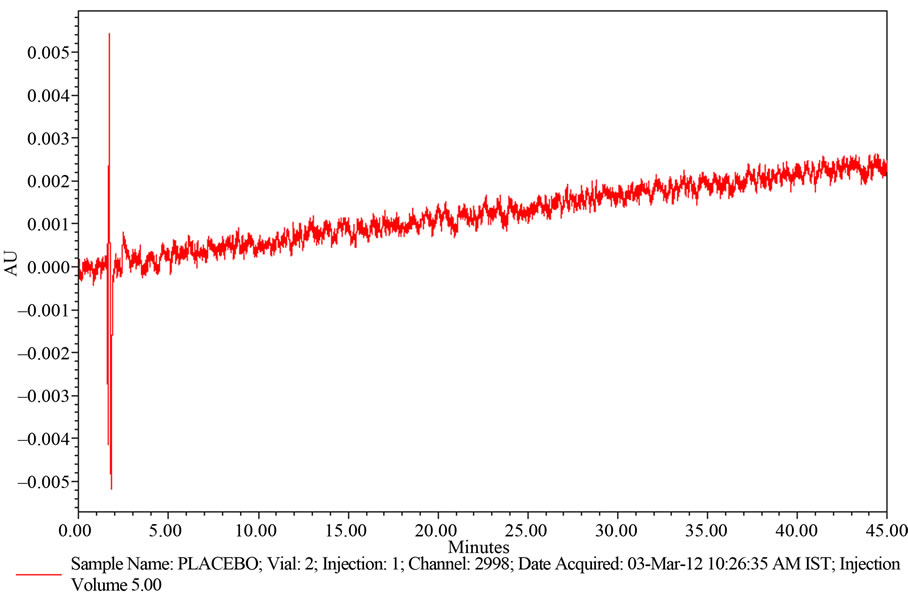
Figure 4. A typical HPLC Chromatogram showing the no interference of placebo for Ranolazine.
intermittent shaking at controlled temperature. Then add 2 mL of 30% Peroxide, refluxed for 30 min at 60˚C, then cooled to room temperature and dilute to volume with methanol and mix. Filter the solution through 0.45 µm membrane Filter. Transfer 5.0 mL of the above solution into a 100 mL volumetric flask and dilute to volume with diluent (Refer Figure 5(c)).
3.2.2.5. Thermal Degradation Sample
Powder collected from 20 tablets are exposed to heat at 105˚C for about 5 days. Then Weigh and finely powder not fewer than 20 Tablets. Accurately weigh and transfer equivalent to 50 mg of Ranolazine into a 100 mL volumetric flask add about 70 mL of methanol, and sonicate for 30 minutes with intermittent shaking at controlled temperature and dilute to volume with methanol and mix. Filter the solution through 0.45 µm membrane Filter. Transfer 5.0 mL of the above solution into a 100 mL volumetric flask and dilute to volume with diluent (Refer Figure 5(d)).
Similarly Humidity, UV-Light exposure, Sunlight exposure and Water hydrolysis stress samples are prepared and checked for their purity by proposed method.
From the above data of degradation profile it can be
 (a)
(a)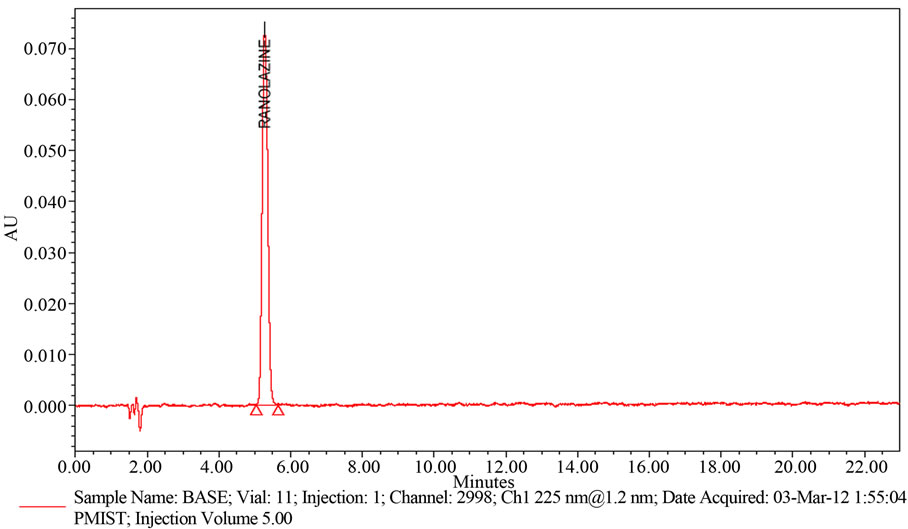 (b)
(b)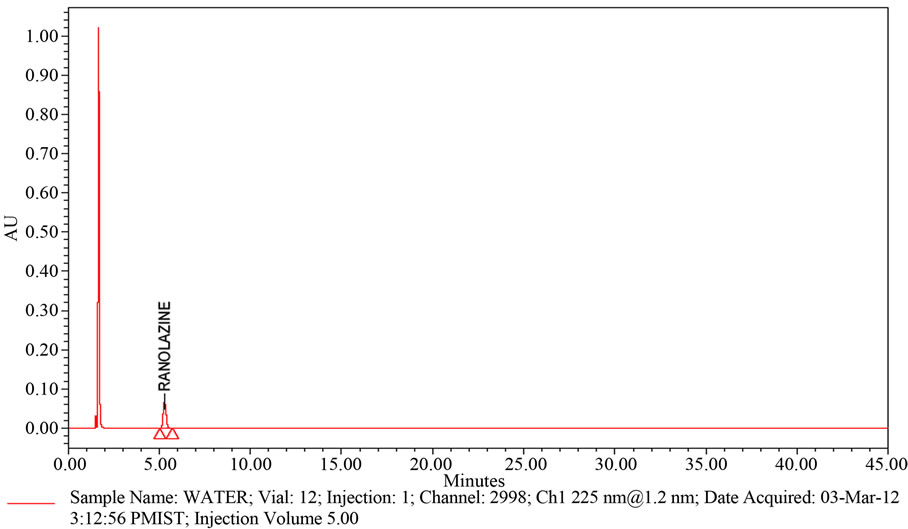 (c)
(c)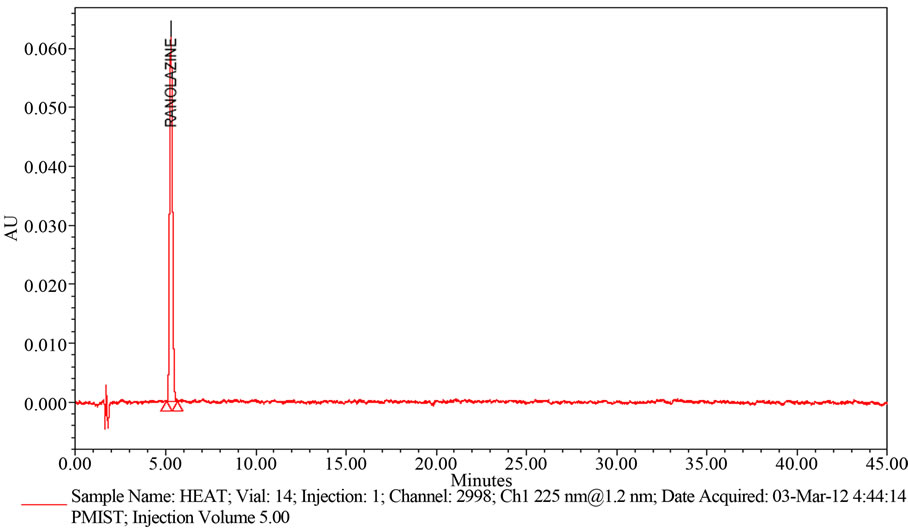 (d)
(d)
Figure 5. (a) A typical HPLC Chromatogram showing the degradation profile of Ranolazine in Acidic hydrolysis by proposed method; (b) A typical HPLC Chromatogram showing the degradation profile of Ranolazine in Basic hydrolysis by proposed method; (c) A typical HPLC Chromatogram showing the degradation profile of Ranolazine in Peroxide hydrolysis by proposed method; (d) A typical HPLC Chromatogram showing the degradation profile of Ranolazine in Thermal degradation by proposed method.
conclude that there is no interference found for of Ranolazine peak.
3.2.3. Precision
In the study of the instrumental system precision where, a RSD of 0.1% was obtained for the standard area obtained corresponding to the first day, being 0.3% for the second day, respectively. The method precision study for six sample preparations in marketed samples showed a RSD of 0.2% and the 95% confidence interval of 0.2 with the assay range of 99.9 - 100.4 For the intermediate precision, a study carried out by the same analyst working on different day. The results calculated as inter-day RSD corresponded to 0.3% (For Standard). The same study was carried out for different analysts (n = 6 number of samples per analyst) obtaining a RSD of 0.5% (Intermediate Precision) and 95% confidence interval of 0.5 with the assay range of 99.8 - 100.6 The Overall %RSD for n = 12 is 0.3. Both results together with the individual results are showing that the proposed analytical technique has a good intermediate precision. Results are summarized in Table 2.
3.2.4. Accuracy
The accuracy of the method was determined on three concentration levels by recovery experiments. The recovery studies were carried out in triplicate preparations on composite blend collected from 20 tablets of Ranolazine and analyzed as per the proposed method. The percentage recoveries with found in the range of 99.1 to 101.1 with an overall %RSD of 0.6. From the data obtained which
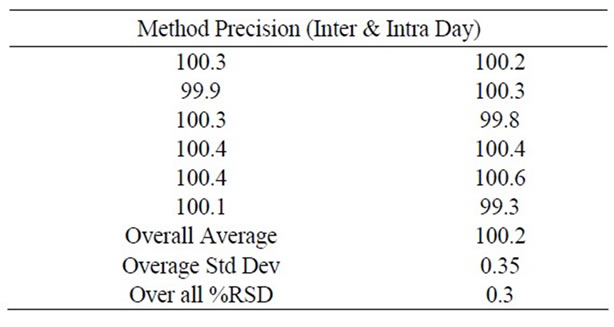
Table 2. Method precision (inter and intraday) studies for Ranolazine by proposed method.
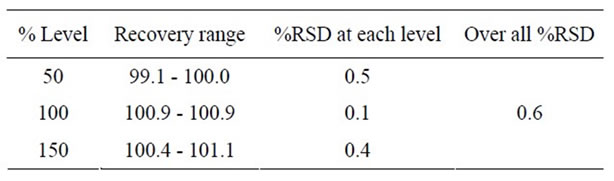
Table 3. Recovery studies for Ranolazine by proposed method.
given in Table 3 the method was found to be accurate.
3.2.5. Linearity of Detector Response
The standard curve was obtained in the concentration range of 12 - 40 μg/ml. The linearity of this method was evaluated by linear regression analysis. Slope, intercept and correlation coefficient of standard curve were calculated and given in Figure 6 to demonstrate the linearity of the method.
From the data obtained which given in Table 4 the method was found to be accurate.
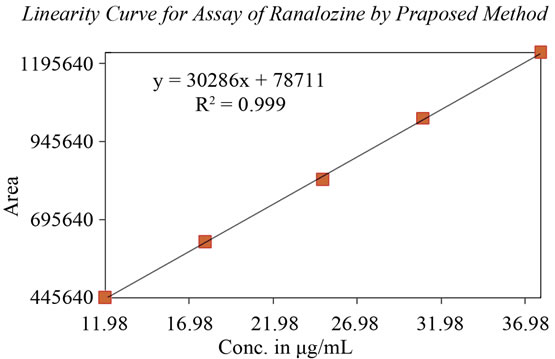
Figure 6. Calibration curve for Ranolazine.
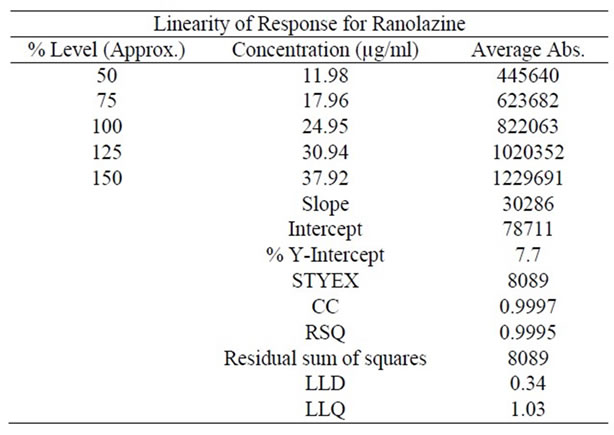
Table 4. Linearity studies for Ranolazine by proposed method.
4. Conclusion
We have developed a fast, simple and reliable analytical method for determination of Ranolazine in pharmaceutical preparation using RP-LC. As there is no interference of blank and placebo at the retention time of Ranolazine. It is very fast, with good reproducibility and good response. Validation of this method was accomplished, getting results meeting all requirements. The method is simple, reproducible, with a good accuracy and precision. It allows reliably the analysis of Ranolazine in bulk, its pharmaceutical dosage forms.
5. Acknowledgements
Rainbow Pharma Labs, Kukutpally, Hyderabad, India.
REFERENCES
- www.druginfo.nlm.nih.gov
- www.rxlist.com
- C. Greenaway, N. Ratnaraj, J. W. Sander and P. N. Patsalos, “A High-Performance Liquid Chromatography Assay to Monitor the New Antiepileptic Drug Lacosamide in Patients with Epilepsy,” Therapeutic Drug Monitoring, Vol. 32, No. 4, 2010, p. 448. doi:10.1097/FTD.0b013e3181dcc5fb
- L. R. snyder, J. J. Kirkland and J. L. Glajch, “Practical HPLC Method Development,” 2nd Edition, Wiley-Interscience, New York, 1997.
- United States Pharmacopeia, USP 34-NF 29, 2011.
- ICH Guidelines on Validation of Analytical procedure: Text and Methodology Q 2 (R1), 2011.
NOTES
*Corresponding author.