American Journal of Analytical Chemistry
Vol. 3 No. 7 (2012) , Article ID: 21046 , 7 pages DOI:10.4236/ajac.2012.37064
Optimization of an Alternative Methodology for Simultaneous Analysis of Nitrite and Nitrate in Water from Urban Stream by Capillary Electrophoresis under Direct UV Detection
1Departamento de Química, Instituto de Ciências Exatas, Universidade Federal de Juiz de Fora, Juiz de Fora, Brazil
2Departamento de Biologia, Universidade Federal de Juiz de Fora, Cidade Universitária, Juiz de Fora, Brazil
Email: *marcone.oliveira@ufjf.edu.br
Received February 19, 2012; revised March 7, 2012; accepted March 26, 2012
Keywords: Capillary Electrophoresis; Nitrite; Nitrate; Urban Stream
ABSTRACT
An alternative methodology for simultaneous determination of nitrite and nitrate by capillary zone electrophoresis using direct detection UV at 210 nm under reverse electrosmotic flow is proposed. The optimization of the electrolyte composition took into account: the buffer and solutes mobilities; the low absorbance of the buffer at 210 nm; the high baseline stability and the short analysis time. The optimized background electrolyte consisted of 100 mmol·L–1 TRIS/HCl buffer and 0.15 mmol·L–1 CTAB at pH 8.2. The proposed method was successfully applied in the analysis of nitrite and nitrate in urban stream samples without usual pretreatment.
1. Introduction
The content of nitrite and nitrate is an important index of water quality, and one of the factors that determines its tap features [1]. In addition, nitrogen is a macronutrient essential to the development of aquatic biota and can, in excess, be toxic or cause eutrophication of lakes and reservoirs, with considerable damage to the environment [2]. Analysis of nitrite and nitrate in water samples is difficult due to the complexity of procedures, the possibility of interference and low levels of detection. Therefore, the development and optimization of analytical methodologies capable of analyzing alternatives such species is relevant.
According to the literature, the quantification of nitrite and nitrate can be performed by colorimetry, distillation, potentiometry, spectrophotometry in the ultraviolet region, gas chromatography and liquid chromatography [3- 10]. Among the most popular procedures highlight the Griess, developed in 1879, a simple technique that became official for the quantification of nitrate and nitrite under ion nitrite form after reaction with sulfanilamide and ethylenediamine. The main disadvantage is the need to employ cadmium columns enveloped in copper for nitrate reduction, and a cadmium chloride solution for extraction of ions from solid samples. The column of reduction must be regenerated after the passage of some samples and its regeneration resulting residues which they must be disposed as well as the amalgam, after a period of use. The method present as disadvantages to be laborious, to require the use of various reagents and to expose the analyst under possible health risks due to cadmium contact.
An interesting alternative for nitrite and nitrate analysis is capillary electrophoresis (CE), which it is a separation technique based on differential migration of neutral compounds, ionic or ionizable by applying an electric field across an electrolyte solution contained within a capillary tube [11,12]. Works from Marshall and Trenerry [13] for food analysis; from Bjergegaard et al. [14], which they analyzed biological compounds, Oehrle [15], which they analyzed the anions in water samples and Bories et al. [16] which they analyzed biological fluids are some examples of successful use of the technique. Compared with traditional methods the technique present as advantages: small sample volume, high efficiency and precision, short analysis time and often without any pretreatment of the sample before injection. However, the CE methodologies described in the literature applied to nitrate and nitrate analysis in fishery wastewater and river water was required pretreatment as centrifugation and filtration to remove particulates and colloids [17,18]. In addition we not found reports in the literature involving analysis of nitrite and nitrate in urban stream by CE. Within this context, this work presents the development and optimization of an alternative methodology for analysis of nitrite and nitrate by capillary zone electrophoresis (CZE) under direct UV detection in urban stream sample containing untreated sewage. Besides, the samples were analyzed in the absence of any pretreatment and direct UV detection permitted the sample analysis containing high amount of chloride which presents negligible molar absorptivity.
2. Experimental
2.1. Chemicals and Reagents
Nitrite and nitrate were purchased from FLUKA (Swiss, Switzerland). Tris (Hydroxymethyl) amino methane (TRIS), cetil trimethyl ammonium bromide (CTAB) and sodium hydroxide (NaOH) were purchased from VETEC (Rio de Janeiro, Brazil), SIGMA (St. Louis, USA) and from Synth (Diadema, Brazil) respectively. Hydrochloride acid was purchased from VETEC (Rio de Janeiro, Brazil).
Aqueous stock solution of nitrite and nitrate standard in the concentration of 100 mg·L–1 were prepared and stored in polyethylene flask in freezer. CTAB aqueous stock solution was prepared in deionized water in the concentration 10.0 mmol·L–1 and stored in polyethylene flask under ambient temperature. NaOH aqueous stock solution was prepared in deionized water in the concentration 1.0 mol·L–1 and stored in polyethylene flask under ambient temperature. Aqueous stock solution of TRIS/ HCl buffer in the concentration of 100 mmol·L–1 was prepared by mixture between mass corresponding to 100 mmol·L–1 of TRIS in a volume corresponding to 50 mmol·L–1 of hydrochloride acid in adequate pre fixed final volume of a volumetric flask completed with deionized water. Other TRIS/HCl buffer concentration used were obtained by dilution in deionized water. The resulting pH was 8.2.
2.2. Instrumentation
All experiments were conduced in a capillary electrophoresis system (model HP3d CE, Agilent Technologies, Palo Alto, USA) equipped with a diode array detector set at 210 nm, a temperature control device (maintained at 25˚C) and acquisition and treatment data software (HP ChemiStation, rev A.06.01). Samples were injected hydrodynamically (50 mbar, 10 s) and the electrophoretic system was operated under reverse polarity and constant voltage conditions of –15 kV. A fused-silica capillarycoated with polyimide (Polymicro Technologies, Phonex, Az, USA) 48.5 cm (40 cm effective length) × 75 µm I.D. × 375 µm O.D. was used.
2.3. Analytical Procedures
At the beginning of the day, the capillary was conditioned by pressure flush of 1.0 mol·L–1 NaOH solutions (5 min), deionized water (5 min) and electrolyte solution (15 min). Between runs the capillary was flushed with fresh electrolyte solution (2 min, pressure flush).
2.4. Sample Preparation
The samples were collected in glass bottles and have them added, even the collection site, formaldehyde solution 40% in order to prevent the action of microorganisms. The collection began in May 2005 and ended in April 2006. The samples were collected at five different points of the stream, being performed a collection at each point every 30 days approximately. Samples collected were prepared in authentic duplicate in order to perform quantification and recovery. Below is described the procedure used:
- Collection points 1 and 2:
sample: 900 µL of sample + 100 µL of water;
standard: 100 µL aqueous solution of nitrite and nitrate in concentration of 1.0 mg·L–1 each + 900 µL of water;
sample + standard: 900 µL of sample + 100 µL of aqueous solution of nitrite and nitrate in concentration of 1.0 mg·L–1 each.
- Collection points from 3 to 5:
sample: 500 µL of sample + 500 µL of water;
standard: 100 µL of aqueous solution of nitrite and nitrate in concentration of 1.0 mg·L–1 each + 900 µL of water;
sample + standard: 500 µL of sample + 100 µL of aqueous solution of nitrite and nitrate in concentration of 1.0 mg·L–1 each + 400 µL of water.
In points from 3 to 5 was necessary major dilution because the interferents were difficult nitrate determination.
3. Results and Discussion
3.1. Preliminary Considerations
An usual and efficient procedure for pH selection of the electrolyte system to be used in optimization by CE is through the mobility curve implementation versus pH. Since nitrite and nitrate are small anions and highly dissociable from the origin cation, these presenting electrophoretic mobility constant in pH from 0 to 12.
During method developing and optimization by CE for anionic compounds is interesting to select the electrolyte anion containing mobility close to the interest species in order to avoid electro dispersion phenomena and consequently to minimize peaks asymmetry. Moreover, once the initial idea is to optimize a method under direct detection in UV in order to increase the analytical signal sensitivity, the selected anion must to present low UV molar absorptivity close at 210 nm.
Within this context, sulphate, perchlorate and chloride were investigated as possible electrolyte ions. Another important variable is the base component of the run electrolyte. In the present case, TRIS was selected, since it presents molar absorptivity compatible with UV work range and makes possible to adequate window detection for analysis. As TRIS pKa is equal to 8.2, it is possible to work under a high electrosmotic flow, resulting in short analysis time and a high buffer capacity. It is important to stress that high buffer capacity provide to the electrolyte resistance to the possible pH variations generated by electrolysis due to applied voltage, resulting in better reproducible among runs.
Figure 1 shows mobility effective curve obtained for species investigated preliminarily. Sulphate was disregarded because presented effective mobility more distant from nitrite and nitrate in comparison with perchlorate and chloride. Perchlorate was also disregarded because it formed precipitate with CTAB which was used to reverse electrosmotic flow. It is important to highlight that fast anions analysis is performed under co-electrosmotic mode (electrophoretic and electrosmotic motilities in same direction) in order to achieve short analysis time and high efficiency. Thus, chloride was selected because it presented more adequate features for optimization among the evaluated anions.
3.2. Electrolyte Optimization
After selection of the electrolyte constituents, the next step was to optimize the electrolyte run concentration. Thus, was proposed a study varying the TRIS/HCl buffer concentration. The concentration studied were 20.0, 40.0,
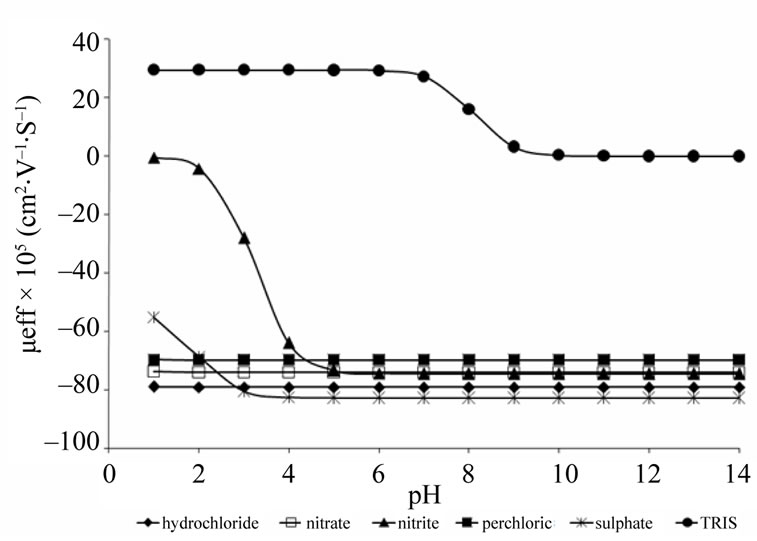
Figure 1. Effective mobility curve obtained for hydrochloride, nitrite, nitrate, perchloride, sulphate and TRIS.
50.0, 60.0, 80.0 and 100 mmol·L–1. Experimental conditions such as injection, voltage, cartridge temperature, wavelength, capillary dimensions and CTAB concentration were maintained constants. Electrolyte concentrations investigated in experimental design were prepared in five authentic replicate and nitrite and nitrate concentration were fixed in 1.0 mg·L–1. Figure 2 shows electrophoretic profile obtained for experiments performed. Since in the present case the analysis were carried out in co-electrosmotic mode and nitrite and nitrate present a negative charge, however different hydration radius (nitrite is minor than nitrate), the charge and size proportion between nitrite is major than nitrate and thus nitrite migrates in front of the nitrate.
During optimum condition study, the mathematic algorithm which it take into account analytical performance such as resolution between critical pair (efficiency), sensitivity (nitrite and nitrate signal height), reproducibility (area and migration time standard deviation) and run time (the last peak migration; in the present case nitrate) for simultaneous nitrite and nitrate analysis was implemented in order to select the best response. Thus, a quantitative measure of separation performance (QMSP) to auxiliary in optimum selection was used [19]. The mathematic equation used as QMSP is described following:
 (1)
(1)
where: R is the adjacent critical peak pairs resolution;
H1: is the nitrite mean height;
H2: is the nitrate mean height;
T2: is the nitrate migration time (run time);
ST1: is the nitrite migration time standard deviation;
ST2: is the nitrate migration time standard deviation;
SA1: is the nitrite area standard deviation;
SA2: is the nitrate area standard deviation.
Analyzing the results showed in Table 1, TRIS/HCl buffer in concentration of 100 mmol·L–1 was selected as optimum because was it which presented higher QMPS value.
3.3. Sample Analysis
After methodology optimization with Standards, this was applied in the nitrite and nitrate analysis in water samples collected in five points along the São Pedro stream, situated in the Juiz de Fora city in the Minas Gerais state in Brazil, during the period of 11 months. The points 1 (661317, 7590765) and 2 (661799, 7591070) are located in expanding urban area or rural, near the headwaters. The points 3 (666477, 7591092) 4 (668307, 7591772) and 5 (668954, 7593495) are located in a region with extensive sprawl, which can be observed release of untreated sewage. The coordinates of the collection sites
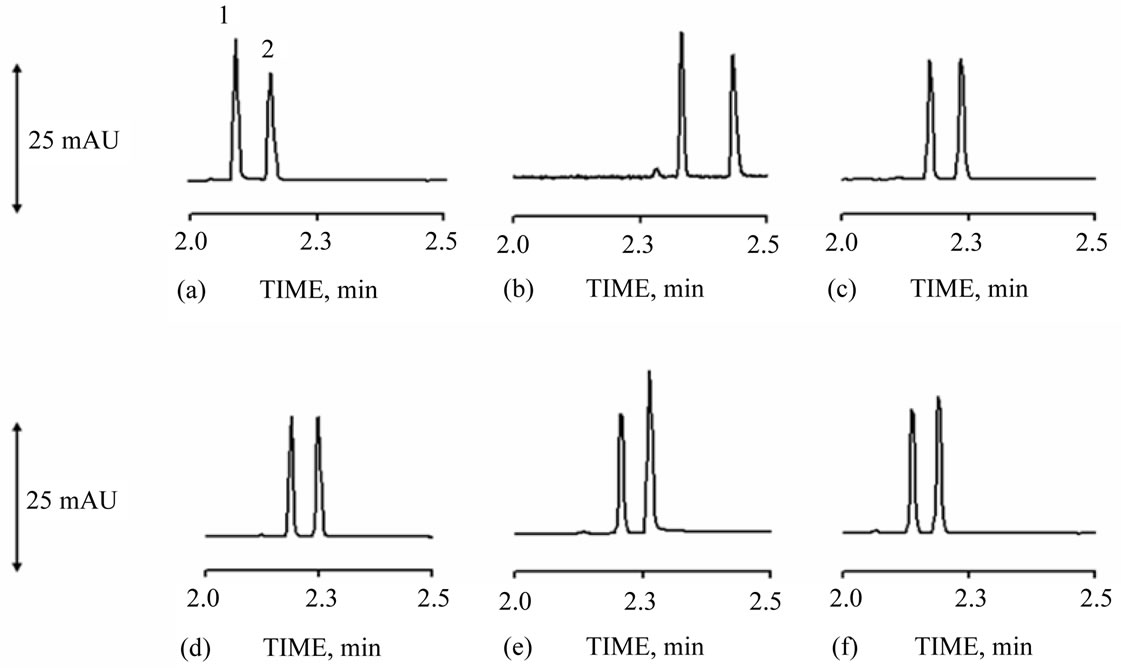
Figure 2. Nitrite (1) and nitrate (2) standards (1.00 mg·L–1 each). TRIS/HCl buffer concentrations: (a) 20; (b) 40; (c) 50; (d) 60; (e) 80; (f) 100 mmol·L–1, all at pH 8.2 and with 0.15 mmol·L–1 of CTAB. Operational conditions: cartridge temperature 30 ˚C; injection 50 mbar·10 seconds; wavelength at 210 nm and voltage of –15 kV.
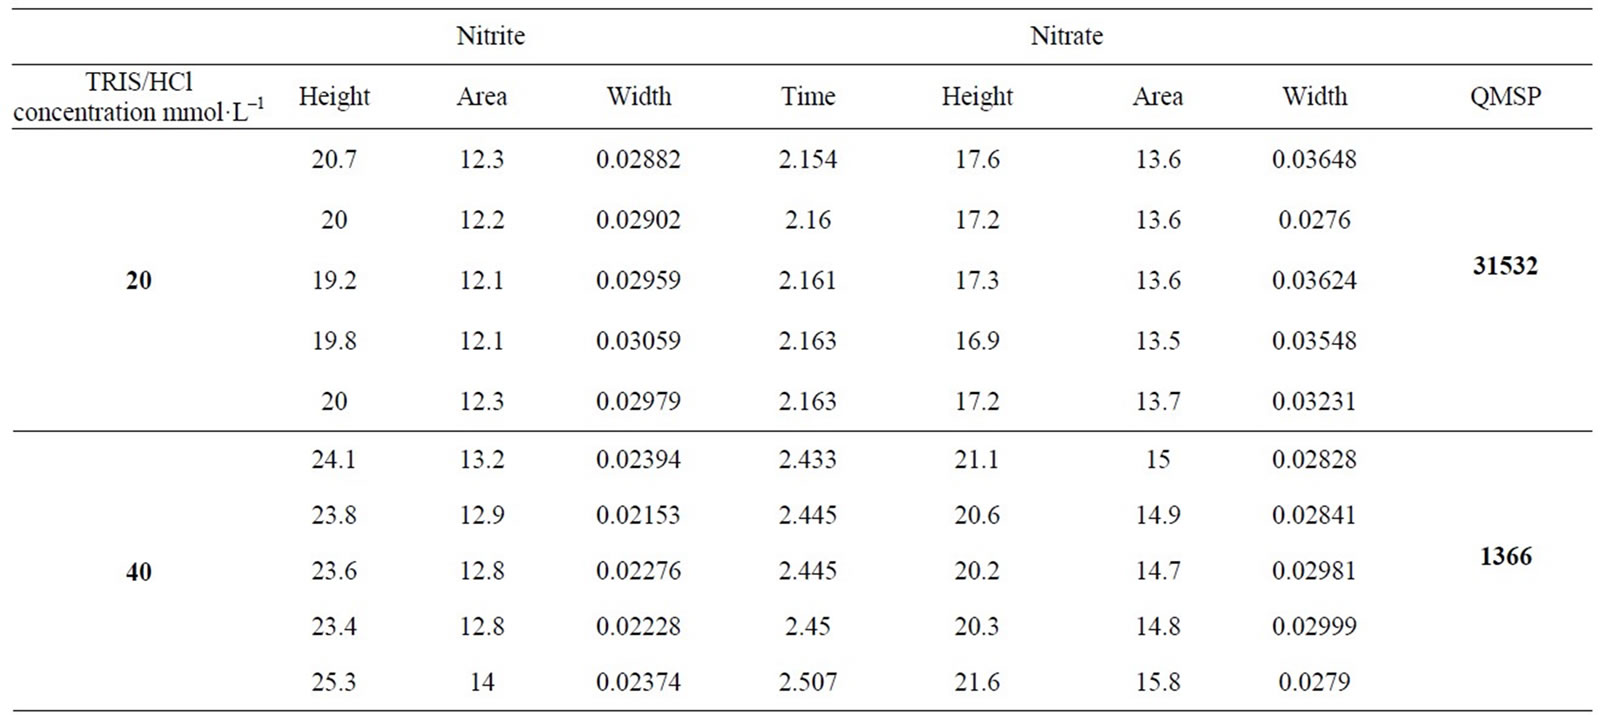
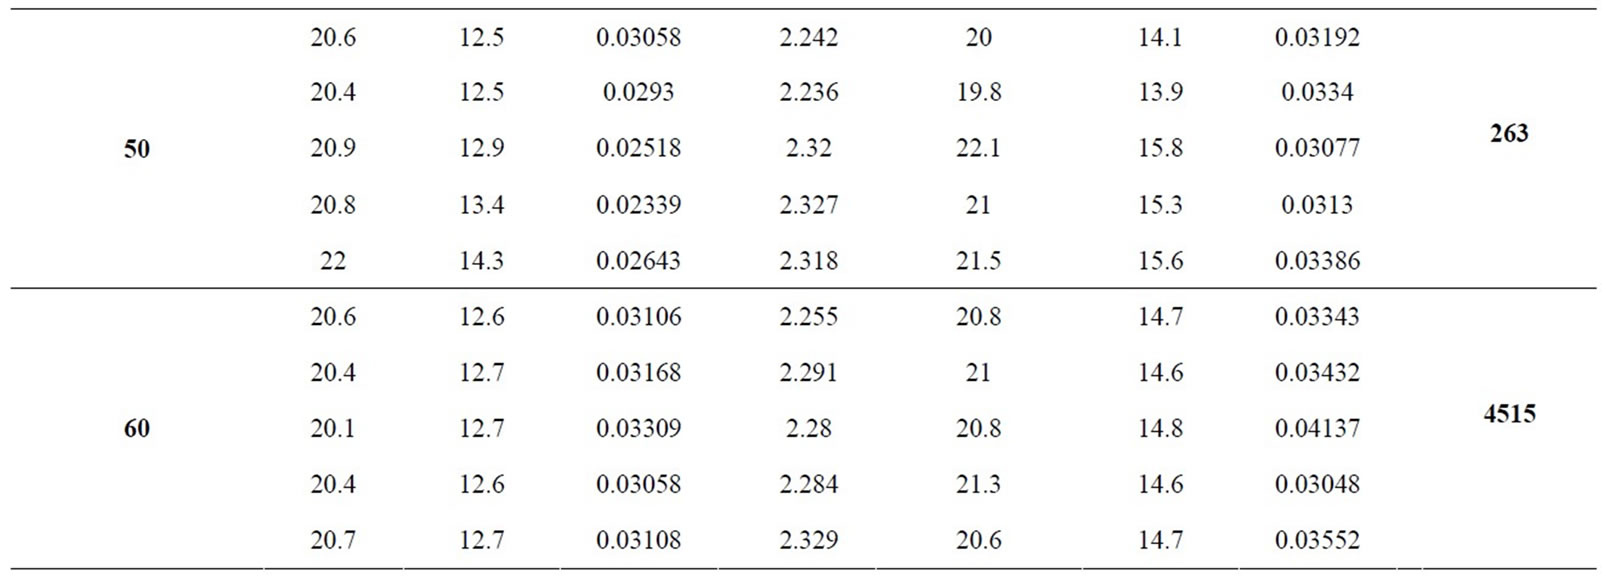
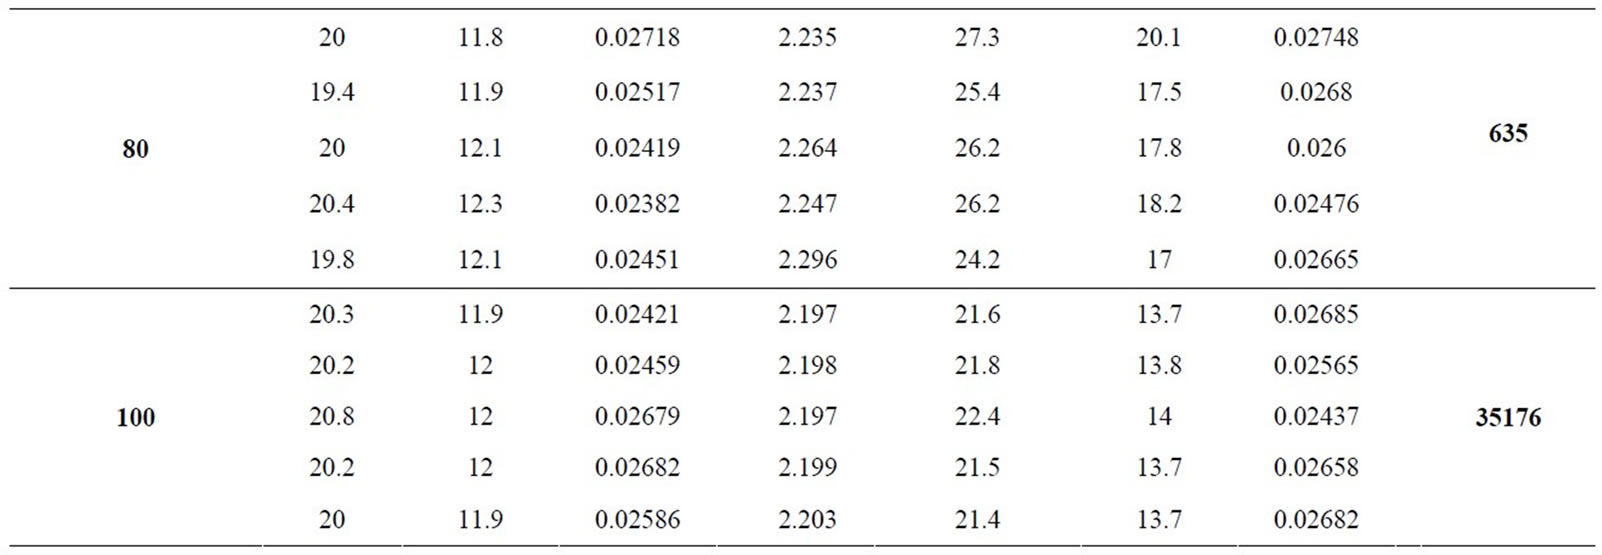
Table 1. Electrophoresis optimization results.
were obtained from GPS (Global Position System) Garmin brand with a readability of geographic coordinates in UTM (Universal Transverse Mercator Coordinates) using the datum (regional data correction) of stream Alegre.
The analysis conditions were the same used during the method optimization. Due to the matrix complexity, the constituent identification in sample was obtained by spiking and quantification through standard addition analysis using only two increments for authentic triplicate [20]. Equation (2) was used for concentration calculation:
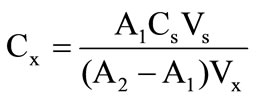 (2)
(2)
where: A1 and A2 are absorbance of the diluted samples and diluted samples plus standard, respectively;
Cs is the standard concentration in stock solution;
Vs is the standard volume added;
Vx is the sample volume.
Figure 3 illustrates an electropherogram obtained for each point analyzed and Table 2 shows quantitative results for samples analyzed.
Table 3 presents the limit of detection (LOD) and quantification (LOQ) for some samples randomly selected. As can be observed for samples taken at different points, was obtained different limits of detection and therefore quantification. This fact is not surprising, since each collection performed in different points has different matrixes.
Therefore, the concentration in mg·L–1, LOD, LOQ and recovery values found for samples were directly related to the complexity of the matrix in each point, which exhibits dynamic behavior, but acceptable results.
4. Conclusion
The results showed that the methodology proposed signals positively to screening monitoring of nitrate, nitrite used as parameters determining in the water quality. The
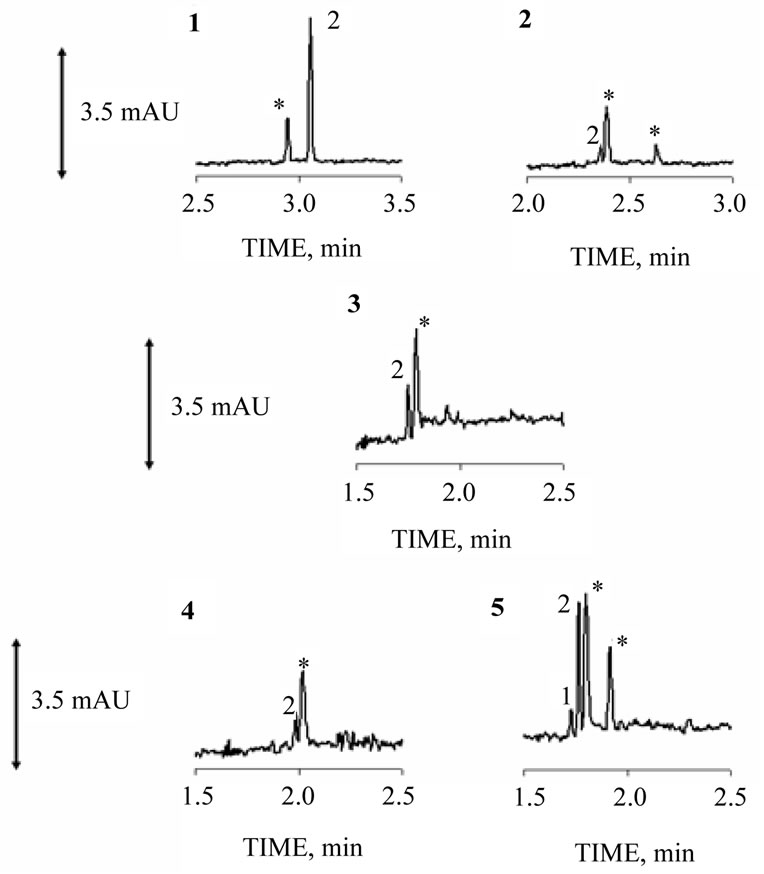
Figure 3. Peak 1 nitrite, peak 2 nitrate and asterisk peak interfering. The major numbers 1, 2, 3, 4 and 5 refer to collection points. Electrolyte run: 100 mmol·L-1 of Tris/HCl buffer (pH 8.2) and 0.15 mmol·L–1 of CTAB. Other conditions as described in Figure 2 caption.
optimized methodology is simples, fast and work in absence of pretreatment procedures for sample preparation. However, if interferences present in high concentration, nitrate analysis will be impaired. On the other hand, the migration time displacement observed due to matrix complexity makes the standard addition methodology mandatory to identification and quantification.
5. Acknowledgements
The authors wish to acknowledge Conselho Nacional de
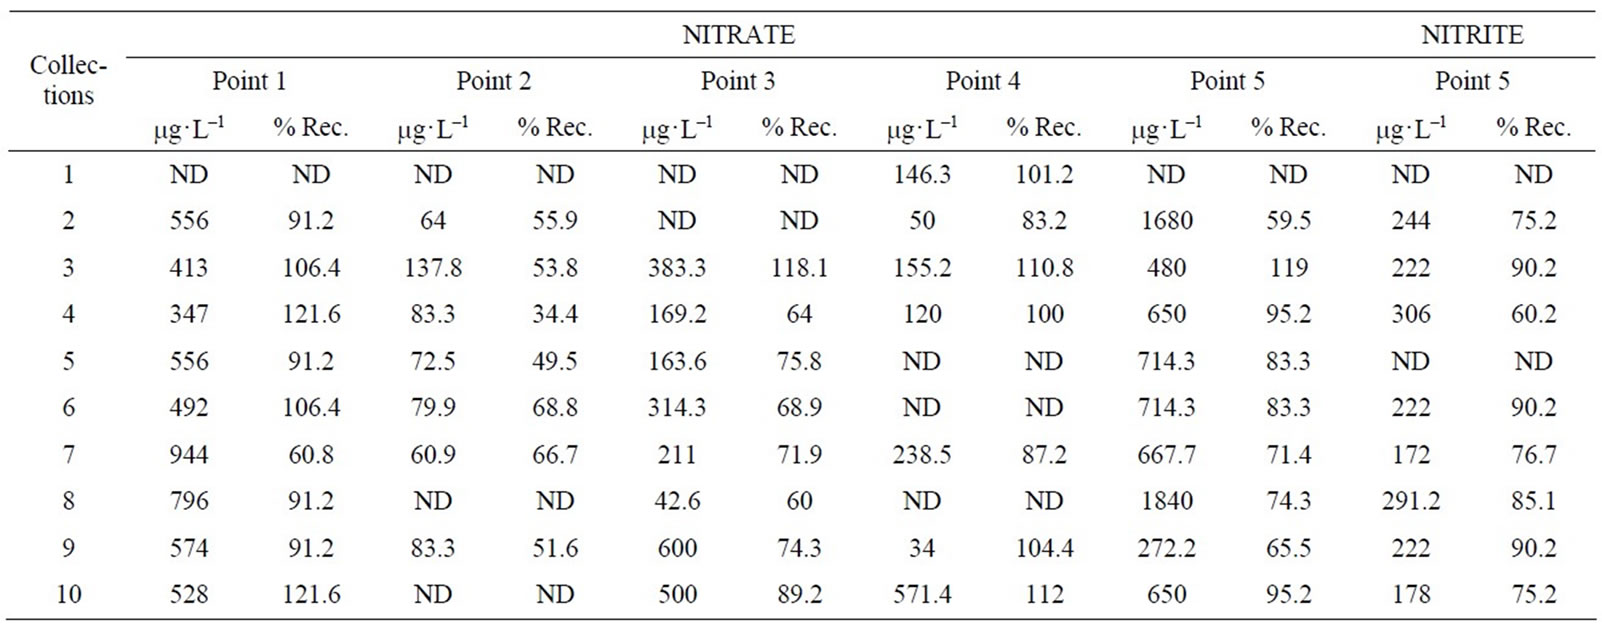
Table 2. Results of nitrite and nitrate analysis in samples.

Table 3. LOD and LOQ in mg·L-1.
Desenvolvimento Científico e Tecnológico (CNPq— 476386/2007-1 and 300593/2008-2), Fundação de Amparo à Pesquisa do Estado de Minas Gerais of Brazil (FA-PEMIG—CEX-APQ 1906-502/07, CEX APQ 01837/ 08 and CEX PPM 00326/09) and Coordenação de Aperfeiçoamento de Pessoal de Nível Superior (CAPES) for fellowships and financial support.
REFERENCES
- Ministério da Saúde, “Controle e Vigilância da Qualidade da Água Para Consumo Humano e Seu Padrão de Controle e Vigilância da Qualidade da Água Para Consumo Humano e Seu Padrão de Potabilidade,” Diário Oficial da União, Portaria 1.469/2000, 2001.
- F. A. Esteves, “Fundamentos de Limnologia,” Interciência, FINEP, Rio de Janeiro, 1998, p. 575.
- R. N. Sah, “Nitrate-Nitrogen Determination—A Critical Review,” Communications in Soil Science and Plant Analysis, Vol. 25, No. 17-18, 1994, pp. 2841-2869. doi:10.1080/00103629409369230
- K. A. Anderson and T. E. Case, “Evaluation of Plant Nitrate Extraction Techniques and Effect on Commonly Used Analytical Methods of Detection,” Communications in Soil Science and Plant Analysis, Vol. 30, No. 9, 1999, pp. 1479-1495. doi:10.1080/00103629909370301
- J. Salomez and G. Hofman, “Nitrate Extraction from Fresh Plant Material by Means of a Methanol: Water Extraction Solution,” Communications in Soil Science and Plant Analysis, Vol. 33, No. 15-18, 2002, pp. 3397-3404. doi:10.1081/CSS-120014533
- P. Mikuska and Z. Vecera, “Simultaneous Determination of Nitrite and Nitrate in Water by Chemiluminescent Flow-Injection Analysis,” Analytica Chimica Acta, Vol. 495, No. 1-2, 2003, pp. 225-232. doi:10.1016/j.aca.2003.08.013
- P. Guozhen, X. Qingi and F. Mei, “Sequential Spectrophotometric Determination of Microgram Amounts of Nitrate and Nitrite in Mixtures,” Microchemical Journal, Vol. 60, No. 3, 1998, pp. 258-265. doi:10.1006/mchj.1998.1669
- L. Monser, S. Sadok, G. M. Greenway, I. Shah and R. F. Uglow, “A Simple Simultaneous Flow Injection Method Based on Phosphomolybdenum Chemistry for Nitrate and Nitrite Determinations in Water and Fish Samples,” Talanta, Vol. 57, No. 3, 2002, pp. 511-518. doi:10.1016/S0039-9140(02)00057-7
- M. J. Moorcroft, J. Davis and R. G. Compton, “Detection and Determination of Nitrate and Nitrite: A Review,” Talanta, Vol. 54, No. 5, 2001, pp. 785-803. doi:10.1016/S0039-9140(01)00323-X
- M. G. Z. Baumgartem, J. M. B. Rocha and L. F. H. Niencheski, “Manual de Análises de Oceonografia Química,” Editora FURG, Rio Grande, 1996.
- M. F. M. Tavares, “Eletroforese Capilar: Conceitos Básicos,” Química Nova, Vol. 19, No. 2, 1996, pp. 173-181.
- M. Bier, “Electrophoresis—Theory, Methods and Applications,” Academic Press Inc., New York, 1959.
- Z. Deyl, “Electrophoresis,” Journal of Chromatography Library, Vol. 18, 1979, pp. 345-362.
- C. Bjergegaard, P. Moiler and H. Sorensen, “Determination of Thiocyanate, Iodide, Nitrate and Nitrite in Biological Samples by Micellar Electrokinetic Capillary Chromatography,” Journal of Chromatography, Vol. 717, No. 1-2, 1995, pp. 409-414.
- S. A. Oehrle, “Analysis of Anions in Drinking Water by Capillary Ion Electrophoresis,” Journal of Chromatography, Vol. 733, No. 1-2, 1996, pp. 101-104. doi:10.1016/0021-9673(95)00769-5
- P. N. Bories, E. Scherman and L. Dziedzic, “Analysis of Nitrite and Nitrate in Biological Fluids by Capillary Electrophoresis,” Clinical Biochemistry, Vol. 32, No. 1, 1999, pp. 9-14. doi:10.1016/S0009-9120(98)00090-3
- R. Bodor, V. Madajova, D. Kanianskya, M. Masar, M. Johnck and B. Stanislawski, “Isotachophoresis and Isotachophoresis—Zone Electrophoresis Separations of Inorganic Anions Present in Water Samples on a Planar Chip with Column-Coupling Separation Channels and conductivity Detection,” Journal of Chromatography A, Vol. 916, No. 1-2, 2001, pp. 155-165. doi:10.1016/S0021-9673(00)01080-3
- M. C. Mart, G. Bocaz, E. Asp and M. Roeckel, “Simultaneous Determination of NO and NO in Fisheries Wastewaters High in Chloride Concentration by Capillary Ion Electrophoresis with Direct UV Detection,” Biotechnology Techniques, Vol. 11, No. 3, 1997, pp. 163-166. doi:10.1023/A:1018449429551
- A. F. Faria, M. V. N. Souza, M. V. Almeida and M. A. L. Oliveira, “Simultaneous Separation of Five Fluoroquinolone Antibiotics by Capillary Zone Electrophoresis,” Analytica Chimica Acta, Vol. 579, No. 2, 2006, pp. 185- 192. doi:10.1016/j.aca.2006.07.037
- D. A. Skoog, D. M. West and F. J. Holler, “Fundamentals of Analytical Chemistry,” 7th Edition, Saunders, Philadelphia, 1992, p. 575.
NOTES
*Corresponding author.