Modeling and Numerical Simulation of Material Science
Vol.3 No.3A(2013), Article ID:35592,4 pages DOI:10.4236/mnsms.2013.33A005
Behavioural Modelling of Corundum under the Effect of Porosity Rate
Laboratory LM & H, Djillali Liabes University of Sidi Bel-Abbes 89, Sidi bel Abbes, Algeria
Email: ing.seif@hotmail.fr
Copyright © 2013 Seif-Eddine Bendaoudi et al. This is an open access article distributed under the Creative Commons Attribution License, which permits unrestricted use, distribution, and reproduction in any medium, provided the original work is properly cited.
Received June 4, 2013; revised July 4, 2013; accepted July 11, 2013
Keywords: Corundum; Behavioural Modelling; Porosity Rate; Design of Experiments Method
ABSTRACT
Corundum, which is a form of Alumina, is used to manufacture various components and mechanical, electrical and electronics parts. Known for its relatively high hardness, its other characteristics depend on the porosity rate that varies depending on the manufacturing process. One of the characteristics to consider is the tensile stress value changes in a standard test to failure as a function of applied force and porosity rate. In this study, for a better understanding of the effect of the two parameters, we used the statistical method of design of experiments that makes it possible to establish a mathematical model of the response, by which explains the effect of the two parameters in isolation from each other, then their effect simultaneously. Consequently, we can explain the mechanical behaviour of the porous corundum, with curves and graphs, and optimize the final result.
1. Introduction
Alumina, Al2O3, is a well studied and universally used ceramic material possessing, such as attractive properties as the excellent wear and oxidation resistance, thermal and electrical insulation, good mechanical strength at elevated temperatures, excellent thermal shock resistance etc. Their wider use, however, is limited by its relatively low strength and fracture toughness.
Engineering grade polycrystalline Corundum products are usually made by sintering Corundum powder at high temperature (>1300˚C). It has been demonstrated by the fact that the ceramic always contain cracks and pores which largely reduce their tenacity. The manufacturing process limits the component and section size that can be produced in reasonably full density, but it is also a major source of the initial defects, which through fracture toughness will limit the strength of Corundum components in service. As a consequence, strength of Corundum is not a strict material property but dependent on stressed volume [1]. The intention of the present work is to study the influence of porosity rate on the mechanical behaviour of sintered Corundum under nominal compression. It is also an occasion to present the modelling of behaviour by the method of design of experiments; which will allow us to predict a change of stress, through a mathematical model of studied material under compressive loading, and to predict, consequently, the optimal parameters of the work.
2. Experimental Procedure
Alumina powder (95 wt.% α-Al2O3 and 5 wt.% additives) was used for the fabrication of porous Corundum, by the sintering method under high pressure and different temperatures in the range of 1350˚C - 1550˚C, with which we had obtained blocks of Corundum with different rate of porosity of 38%, 32.7%, 7.7%, and 3.3%. The surface measurement of pores was done from micrographs by using “Scion Image” software. The percentages are estimated by the means of several surface measurements of different sections from the same sample. The study of the mechanical behaviour of Corundum was performed in exposing the samples to the compression test on a universal testing machine by applying a uniaxial load at room temperature (Figure 1). The dimensions of test samples are summarized in Table 1.
The test measurements were conducted as follows: For every given rate of porosity, a compressive stress is measured several times during variation of strain in the sample, this last that depends, of course, on the change in length. Then all the results and parameters were associated to modelling process by the quoted method, in order, to understand its mechanical behaviour (stress-strain) as
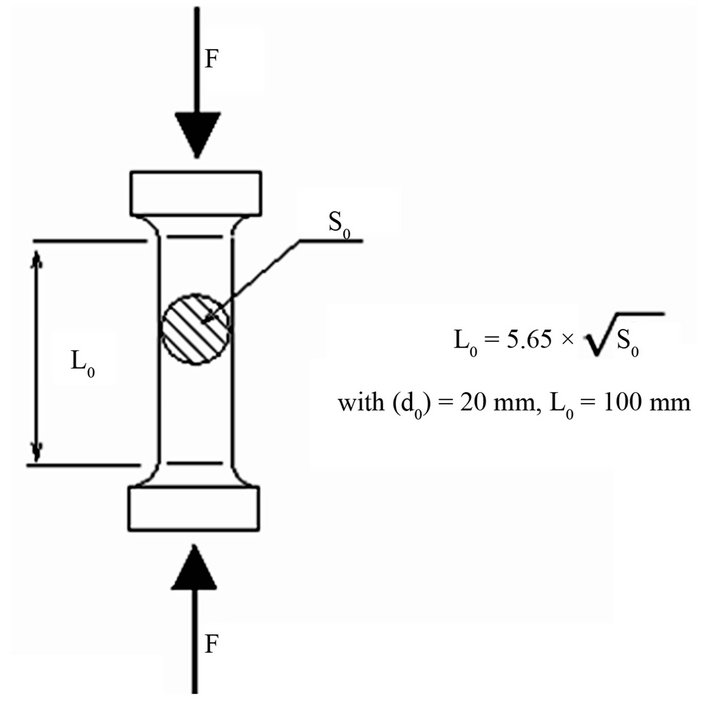
Figure 1. Uniaxial compression test.
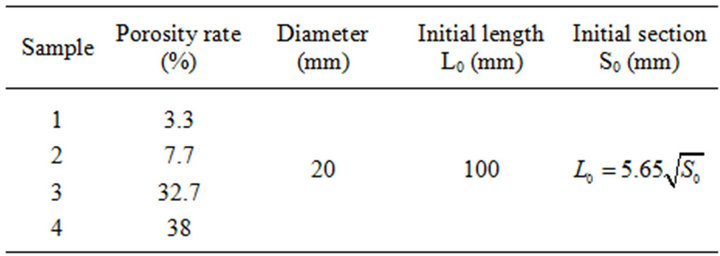
Table 1. A summary of the test sample dimensions.
well as the mechanisms which explain that.
3. Equations and Modelling
In order to investigate the effect of porosity rate on the behaviour of Corundum under continued increase loading, the modelling by the method of design of experiments seems adequate. It makes possible to predict other response values of stress in the experimental field, basing of course on test results already performed, in other words, without any required additional experiments. This method brings a solution that makes possible to minimize the number of experiments to carry out, and thus, saving time and money without sacrificing the precision of the results [2]. In the present study, we use the No-conventional design of experiments which makes possible to use data at our disposal without following a plan, defined in advance [3].
As the response yi depends on two factors (rate of porosity & strain), both having several levels, so it is judicious to express the estimated response in matrix form as the following notation:
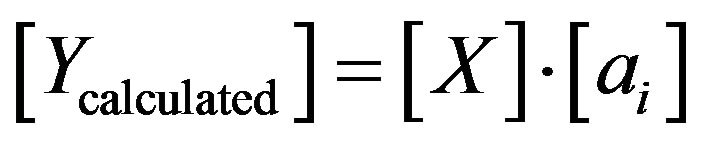 (1)
(1)
where [Ycalculated], [X] and [ai] are matrix of estimated response, model and coefficients, respectively.
3.1. Model Coefficients
Mathematical modelling by design of experiments is done by a polynomial of a second degree Equation (1), which derives from the development of function in Taylor series, in which, each effect of parameter is represented by variable xi attached to a coefficient ai. Other coefficients aij are related to the interaction of effects xi and xj [4]. The general form of the polynomial model is written in the following form:
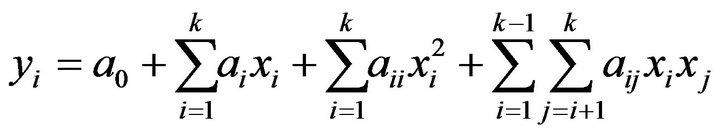 (2)
(2)
The developed form of polynomial model is written as below.
 (3)
(3)
where xi,1 is porosity rate factor; xi,2 is strain factor; yi is response factor and ei is gap between measured and predicted values obtained from the model of stress variation for any cycle i under applied load test.
The treatment of design of experiments consists on estimating, by the method of least squares, the P coefficients of a mathematical model while their number is lower than that of experiments performed [4]. By using “Matlab” for treatment of Equation (2), we obtain the coefficients values by the following equation.
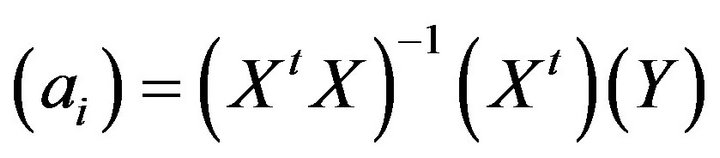 (4)
(4)
where a is coefficient matrix; ('XX)−1 is matrix inverse of (X'X); X' is matrix transpose of X and Y is experimental measured response [4].
3.2. Mathematical Modelling
After estimating coefficients of model (porosity rate; strain), we can now establish the mathematical model that linked response to factors. The model takes the following form.
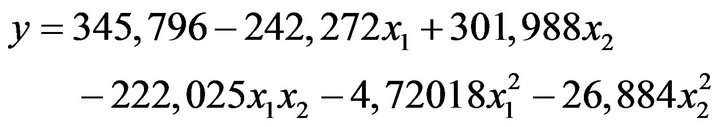 (5)
(5)
where ystress is a predicted value of stress; x1 is porosity rate; and x2 is strain value.
Through the estimating values of model coefficients and as a preliminary analysis, we can already indicate that the acting of porosity rate is important.
4. Model Quality
The Equation (5) drifting from a statistical method is only an approximation of reality, from where appear the differences between the experimental and the predicted values. The estimation of coefficients of the second-degree polynomial model is based on test results, which are particular values with a random variable, for each treatment of design of experiments. So we have to make a judgment on the obtained results via the quality of model coefficients. Two types of qualities are defined as following.
4.1. Model Validity
It defines the degree of rapprochement of the predicted values compared to the measured values. This coefficient translates the contribution of the model in the restitution of measured response variation. It can be calculated by the relation in Equation (6).
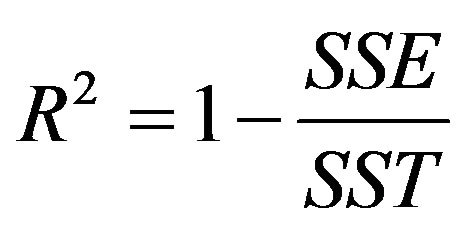 (6)
(6)
where SSE is the error sum of squares, and SST is the total sum of squares [5,6].
In our case, the coefficient model validity is 0.988, it is estimated very good since it checks the following relation.
 (7)
(7)
4.2. Model Reproducibility
It makes possible to judge the ability of the polynomial model to predict the response without carrying out any tests, other than those already done. Its theoretical value can vary between minus infinity (−∞) and (+1), but the model is considered reproducible [6], if the value of Q2 is close to 1.
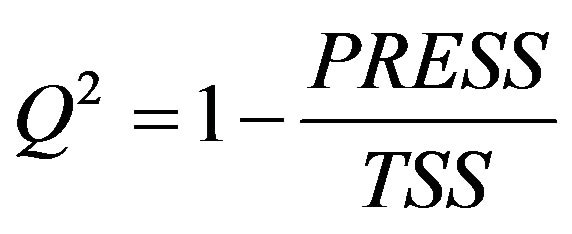 (8)
(8)
 (9)
(9)
where PRESS is the prediction error sum of squares, and TSS is the total sum of squares.
The model reproducibility obtained by applying Equation (8), of which Q2 is 0.975, is even good since it checks Equation (9).
The results mentioned before show that the quality of mathematical model obtained is satisfactory. It means that the new response values, obtained from model, will be close to experimental values.
5. Graphical Analysis
A graphical description of the overall experimental response of the porous ceramics under compression tests is shown in Figure 2. The stress-strain variation of the studied samples of various porosity rates, exhibit increasing slopes with different inclination angle. First, we note that the initial porosity influences the inclination
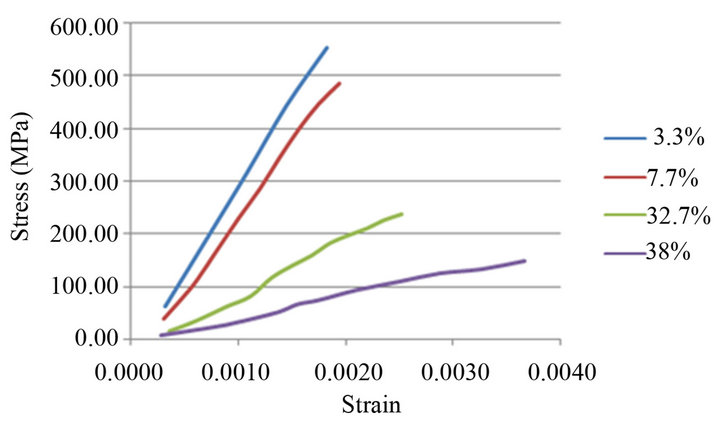
Figure 2. Stress-strain curves of Corundum obtained at different rates of porosity.
angle of the stress-strain slopes. Generally, for the low rates of porosity (3.3%; 7.7%), an increase in strain leads to a large increase in stress, but instead, for the higher rates (32.7%; 38%), it leads to a low increase in stress. In other words, the stress in the Corundum of low porosity increases rapidly than the one of high porosity, with the increase of strain.
In the following, basing on the theory of design of experiments, we report a series of curves plotted with the estimated response, that interpret the mechanical behaveiour of Corundum under the effect of porosity rate during the applied load.
Figures 3(a) and (b) show typical 3D and 2D graphs of the estimated response; which are usually called Response-surface and Iso-response respectively; this last, being a projection of the 3D graph onto the plane-down. These graphs illustrate the evolution of the Corundum stress-strain according to the change of porosity rate. It is worth notifying that the uniaxial load is applied to the samples until rupture moment takes place.
Overviewing Figure 3, it is found that the Corundum of high porosity rate exhibits, with the increase of strain, broader coloured zones of response. It means that the stress increases less rapidly in this case, thus the Corundum with a higher porosity rate, can endure a relatively larger strain before reaching the rupture moment shown by the red zone. This is in agreement with the results given in Figure 4 (see also Table 2) in which the Corundum presents a high Young’s modulus that decreases with the porosity rate increasing. However, it increases under the increase of strain as shown in Figure 5.
Physically, the material of high porosity has a tendency to absorb, with the stress increasing, more damage, before failure. In that fact that, under the compression load, the grains on the top and bottom of the pores have tendency to be closer. This allows to fill the void and consequently reduces the wear rate. From which the plasticity of the material is increased slightly. But at the same time, the grains on the sides of the pores are moved
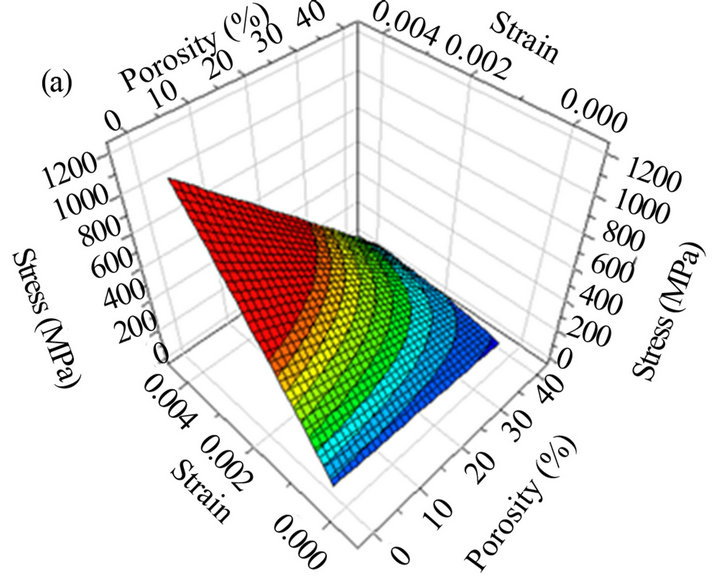
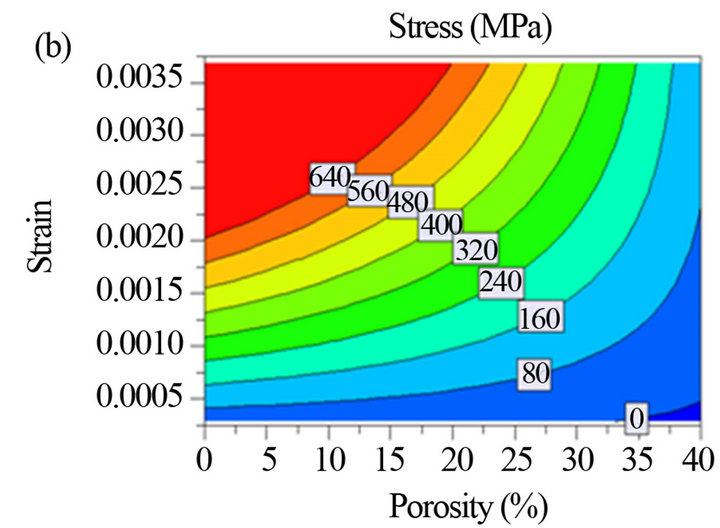
Figure 3. Response-surface (a) and Iso-response (b) plot showing the effect of porosity rate on the behaviour of Corundum.
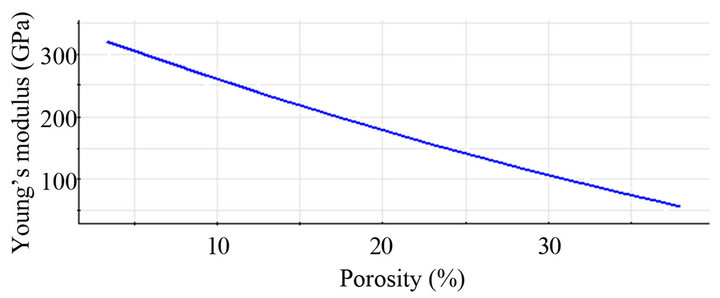
Figure 4. Young’s modulus of Corundum as a function of porosity rate.
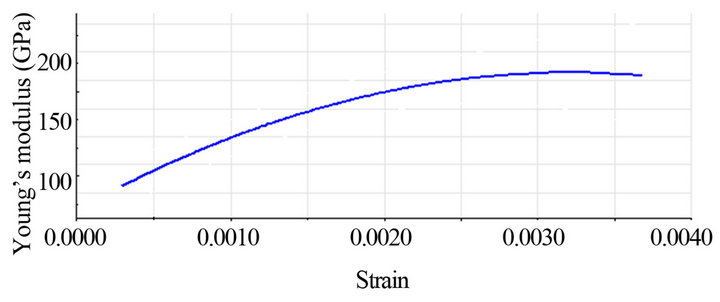
Figure 5. Young’s modulus of Corundum as a function of strain.
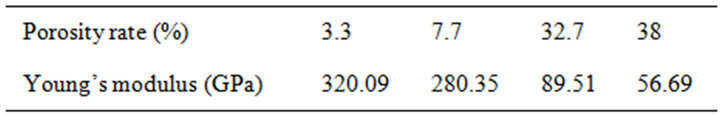
Table 2. Young’s modulus of Corundum with various porosity rates
farther apart so that it allows the propagation of cracks, as known for the brittle material, when it is loaded to failure, it does so by the propagation of cracks [7]. So it is worthy of noting that the pores, take part in this propagation and so in failure of ceramics. Consequently, this mechanism increases the fragility of the material. However, the higher values of stress are reached for the Corundum of smaller rate of porosity.
• 6. Conclusions
• Corundum, the studied material exhibits, with various rates of porosity, different mechanical behaviours (stress-strain): For the low rates of porosity (3.3%; 7.7%), an increase in strain leads to a large increase in stress, but instead, for the higher rates (32.7%; 38%), it leads to a low increase in stress.
• Initial porosity influences the inclination angle of the stress-strain curve. The greatest angle is met in the graph of porosity rate of 3.3%.
• High porosity rate increases slightly the plasticity of the material, but also it increases the fragility of the material.
• The stiffness of Corundum decreases with the effect of simultaneous change of porosity rate and strain.
REFERENCES
- C. G. Sammis and M. F. Ashby, “The Damage Mechanics of Brittle Solids in Compression,” Acta Metallurgica, Vol. 34, No. 3, 1986, pp. 511-526. doi:10.1016/0001-6160(86)90087-8
- G. E. P. Box, W. G. Hunter and S. J. Hunter, “Statistics for Experimenters,” 2nd Edition, John Wiley & Sons, New York, 2005.
- J. Goupy, “No-conventionals Design of Experiments; Theory and Applications (or How to Save Failed Plan),” Journal of Analysis, Vol. 23, No. 4, 1995, pp. 152-158.
- J. Goupy, “Tutorial: Design of Experiments,” MODULAD Journal, Vol. 34, 2006, pp. 1769-7387.
- F. Louvet and L. Delplanque, “Design of Experiments: A Pragmatic Approach, and Illustrated,” Design of Experiments: The French Touch, Expérimentique Ed., ISBN 2-95251126-0-4, 2005.
- D. C. Montgomery, “Design and Analysis of Experiments,” 6th Edition, Wiley, New York, 2004.
- G. W. Stachowiak and A. W. Batchelor, “Engineering Tribology,” BH (Butterworth Heinemann), 2001.