Modeling and Numerical Simulation of Material Science
Vol.4 No.3(2014), Article ID:47847,8 pages
DOI:10.4236/mnsms.2014.43014
Simulation of Fatigue Life Behavior of Circular Cross-Section Bar with Straight-Fronted Crack
1Department of Mining and Metallurgy Engineering, Amirkabir University of Technology, Tehran, Iran
2Department of Mechanical Engineering, University College of Engineering, University of Tehran, Tehran, Iran
Email: *hamid.alihossieni@gmail.com
Received 8 May 2014; revised 7 June 2014; accepted 7 July 2014
ABSTRACT
In this paper, fatigue life circular cross-section elastic bar under pure fatigue axial loading is stu- died through principles of linear elastic fracture mechanics (LEFM) coupled with the three-di- mensional finite element technique for determination of critical crack size and residual lifetime. Three different initial notch depths are discussed. The relations between aspect ratio (b/c) and relative crack depth (b/D) are obtained, and it is shown that there is great difference in the growth of cracks with different front shapes and initial notch depths.
Keywords:Simulation, Fatigue Life, Crack Shape

1. Introduction
In many cases, the lifetime of structures and components depends on the behavior of cracks, especially under cyclic loading so called fatigue [1] . Cracks may develop and lead to catastrophic failure of the whole structure at the stresses even far below static strength limits. A published for part circular, part-elliptical, or straight fronted cracks in a bar. Analysis is carried out to determine the stress-intensity factors (SIF) along the front of an edge flaw [2] -[4] .
The problem is very complex since a three-dimensional computation is necessary to obtain the values of the stress intensity factors along the crack front. An actual surface crack may usually be replaced by an equivalent circular arc or an elliptical-arc edge flaw [5] . The stress-intensity factors have been published for part circular, part-elliptical, or straight fronted cracks in a bar [6] . In this paper, three-dimensional finite element analysis was used to estimate the stress intensity factors (SIFs) at a set of points along the crack front and then applied an appropriate fatigue crack growth law to this set of points to obtain a new crack front. Fatigue crack growth can therefore, be predicted in a step by step process. Computational results of fatigue crack growth for a straightfronted edge crack in an elastic bar under axial loading are given. Three different initial notch depths are discussed. The relations of aspect ratio and relative crack depth are obtained and it is shown that the growth of the crack fronts is dependent on the initial notch depth. Using the relations, the crack front shape and crack growth rate in the depth direction can be predicted.
2. Theoretical Background
2.1. Fatigue Crack Growth Law
Paris and Erdogan have constructed a quantitative framework of fatigue fracture mechanics, which correlates the fatigue crack growth rate to the range of stress intensity factor as follows [3] :
 (1)
(1)
where the SIF range,
 , is related to the crack geometry and the applied
load, whilst constants C and m account for stress ratio R (minimum to maximum applied
stress), the material and environmental effects. The experimental relation described
above can be obtained for a particular material from standard specimens subject
to a regulated test procedure.
, is related to the crack geometry and the applied
load, whilst constants C and m account for stress ratio R (minimum to maximum applied
stress), the material and environmental effects. The experimental relation described
above can be obtained for a particular material from standard specimens subject
to a regulated test procedure.
It has been widely confirmed that the Paris Erdogan fatigue crack growth relation can give good predictions in the conceptual long crack low-stress regime, although mean stress, load ratio and frequency, random loading, multi axial and complex stress states as well as environment such as corrosion and temperature, plastic zone sizes, microstructure all affect the manner of fatigue crack growth. Throughout the present work, this basic regime of fatigue crack growth will be applied to the simulation technique.
The estimate of fatigue life can be made by integrating Equation (1), if the stress intensity factor (SIF) range is known. Using of Equation (2), number of cyclic (N) is needed so that an initial crack length (a0) reaches to critical crack length (af) can be calculated [7] .
 (2)
(2)
2.2. Stress Intensity Factor Evaluation
Accurate estimates of stress intensity factors should be achieved in order to eliminate a large error in predictions of fatigue life. Several methods of estimating stress intensity factors are available, such as the alternating, weight function, body force and boundary and finite element methods. The finite element method is employed in the simulation technique because of its versatility and generality for complicated cracked structures. Different techniques of evaluating the stress intensity factor are strain/stress singularity at the corner of a 20-node isoparametric element can be exactly achieved by moving the mid-side nodes of the elements implemented. In this paper, was used 1/4-point displacement method [8] .
2.3. The 1/4-Point Displacement Method
Barsoum [9] proved that the theoretical
 strain/stress singularity at the corner of a 20-node isoparametric element can be
exactly achieved by moving the mid-side nodes of the elements to 1/4-point positions,
as shown in Figure 1. The stress intensity factor
can then be estimated from the crack-surface displacements at these 1/4-points,
i.e.
strain/stress singularity at the corner of a 20-node isoparametric element can be
exactly achieved by moving the mid-side nodes of the elements to 1/4-point positions,
as shown in Figure 1. The stress intensity factor
can then be estimated from the crack-surface displacements at these 1/4-points,
i.e.
 (3)
(3)
where r(1/4) is the distance of the 1/4-point away from the crack tip and uz is displacement in z direction, as shown in Figure 2; and E and υ Young’s modulus and Poisson’s ratio of the material. However, care should be
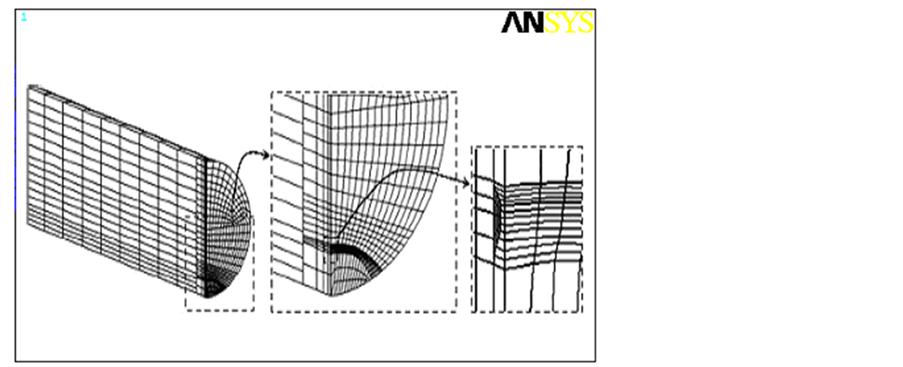
Figure 1. Three-dimensional model of cracked round bar.
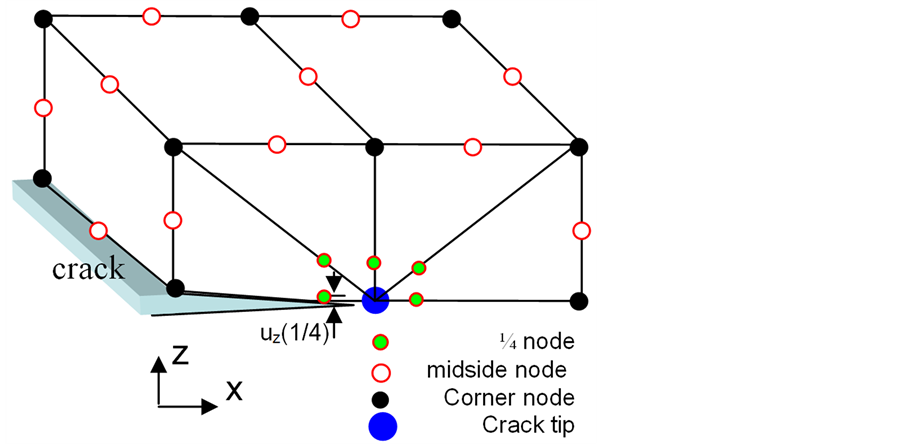
Figure 2. Mesh configuration near the crack tip.
taken on the generation of the mesh. The mesh abutting the crack front should be orthogonal, which will be demonstrated later.
3. Numerical Simulation Technique
The modeling is principally based on finite element analyses together with the step-by-step Paris law described previously. The variation of stress intensity factors along the crack front is estimated using the 1/4-point crack opening displacement method or the J-integral method. A Paris law is subsequently applied to evaluate the local normal outward increments of crack growth in terms of Equations (1) and (2), in which, the technique of specifying a maximum increment of growth, damax, is along the crack front. A new crack front is formed according to these new locations of this set of nodes on the original crack front by using a cubic spline curve, and the nodal positions can be automatically re-arranged along the new crack front with a reasonable interval between them. The technique then can automatically generate a new mesh that corresponds to the new advanced crack front. The new mesh can completely be transferred, in most cases, to the next step computation so that the fatigue cracks growth computation to be followed automatically. Some details of this technique are now given in the following [10] .
The finite element configuration is established by first creating a 2D mesh on the crack plane and then expanding it into a 3D one. This idea is able to facilitate the automatic technique of remeshing the finite element model for successive crack front positions.
Typical 2D crack plane meshes, which consist of eight-noded isoperimetric elements. The crack front is constructed by a set of nodes. The edges of the elements abutting the crack front interest the crack front orthogonally except at the free surface position. The simulation technique has also designed several 2D mesh patterns ready for part-circular and part-elliptical surface cracks in round bars. A desired 3D mesh can be assembled by choosing the number of elements layers and varying the thickness of each layer. The above stages are performed by the pre-processor of the technique.
The post-processor of the technique mainly calculates the stress intensity factors along the crack front from the output file of the commercial software, ANSYS, which has been used as a FE solver in this technique.
Material and Geometry
The material properties of carbon steel CK45 is used for simulation of sample. The
mechanical properties are summarized as follows: monotonic tensile yield strength
635.07 MPa, nominal ultimate tensile strength 775.65 MPa, reduction of area 62.87%,
Young’s modulus 206 GPa and fracture toughness in plane strain (KIC) 31.4 MPa . The outer geometry configuration of a specimen
is shown as Figure 3. The diameter D is 12 mm and
the length L is 90 mm in the test section. Surface edge cracks were modeled with
three different initial flaw depths. b0 = 1.0, 2.0, and 3.0 mm. maximum
fatigue tension 25 kN and same stress ratio 0.1 are used.
. The outer geometry configuration of a specimen
is shown as Figure 3. The diameter D is 12 mm and
the length L is 90 mm in the test section. Surface edge cracks were modeled with
three different initial flaw depths. b0 = 1.0, 2.0, and 3.0 mm. maximum
fatigue tension 25 kN and same stress ratio 0.1 are used.
4. Description of the Parameters
An elliptical surface straight-fronted edge crack defined in a bar by the parameters a, b and centre is assumed to exist in the median cross-section of a round bar with Diameter D and Height L (Figure 3). The load is applied at
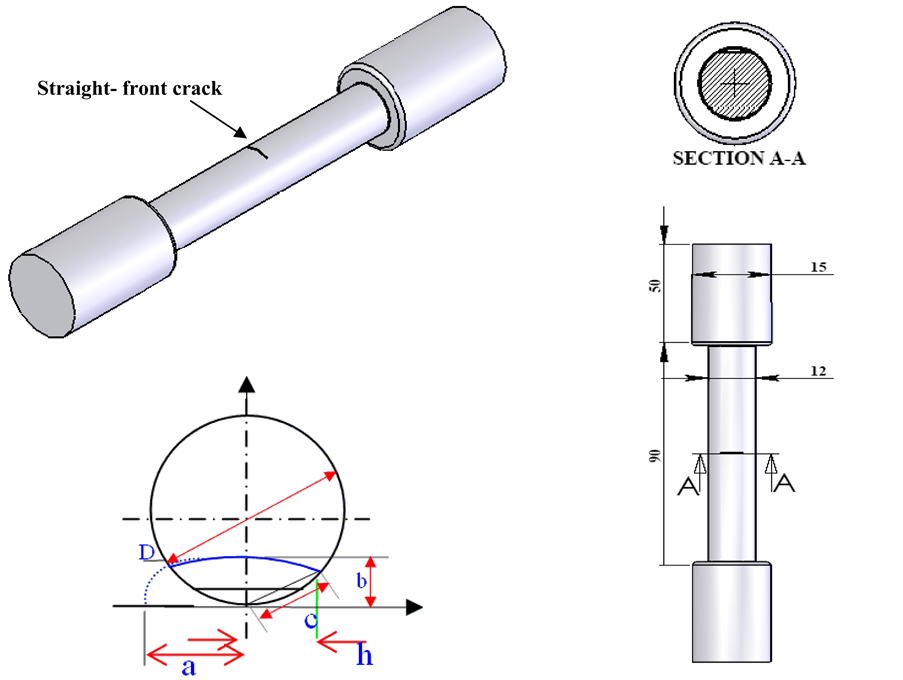
Figure 3. Details of the component geometry and crack.
both the bar ends in the form of a uniform tensile stress or a linearly distributed bending stress. Since the bar geometry and the applied loads present two planes of symmetry, only a quarter of the structure has to be modeled. A finite element analysis using 20-node and 15-node isoparametric three-dimensional elements is carried out at several steps of the fatigue crack propagation. The mid-side nodes adjacent to the crack front are shifted to a quarter-point position in order to induce a square-root singularity of the displacement field.
The stress intensity factor in Mode I, KI, is estimated at each node lying on the crack front by means of 1/4-point crack opening displacement method applied to the crack face displacement in a plane state of strain by Equation (1) dimensional model of the cracked round bar is illustrated in Figure 3.
5. Results and Discussion
5.1. Crack Shape Evolution
The evolution of the crack shape of the straight-fronted edge surface cracks is determined using the results were observed for several different initial crack sizes. As is found crack propagation first start in the deepest point of the cylinder bar.
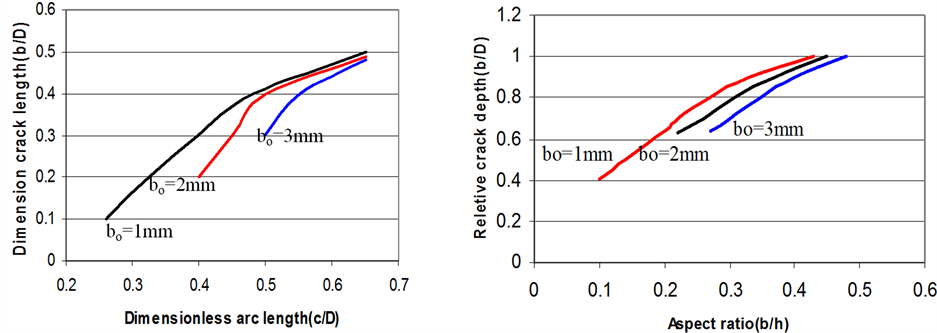
The fatigue crack developments b/D with c/D under cyclic tension loading for three initial notch depths 1.0, 2.0, and 3.0 mm are shown in Figure 4(a). At the beginning of crack growth, the growth rate of the central point of the crack front is faster than that at the intersection with the surface. The reason is that the maximum stressintensity factor is attained at the deepest point on the crack front for the straight-fronted edge crack (b/a = 0). Consequently, a straight-fronted crack tends to become curved, and the flaw aspect ratio b/a increases. When b/a = 0.6, the deepest point and the external surface points on the crack fronts, almost have the same stress-intensity factor. After b/a = 0.6, the crack growth rate at the intersection of the crack with the external surface is higher than that at the deepest point and the curve tends to flatten. Polynomial functions can be used to express the crack shape development rule as:
For b0 =1 mm
 (4)
(4)
For b0 =2 mm
 (5)
(5)
For b0 =3 mm
 (6)
(6)
5.2. Influence of Initial Crack Sizes
Figure 4(b) show the computational data are given for the relations of the crack aspect ratios (b/c and b/h) ver-
 (a) (b)
Figure 4. (a) Relationships of the crack growth in the depth and surface directions; (b) Fatigue crack growth patterns for different initial surface flaws.
sus relative crack depth (b/D), and comparison of fatigue propagation patterns for three surface flaws in round bars. It can also be observed that the propagation pattern converges to a range of b/D of about 0.5 - 0.6.
5.3. Fatigue Life Prediction
For simulating fatigue crack growth of component during service, the crack driving
force to fatigue crack growth have to be known. In general terms this consists of
determination of the linear-elastic stress intensity factor (K factor), and based
on the stress intensity range . An elliptical surface
crack with straight front is defined by the parameters (see
Figure 3).
. An elliptical surface
crack with straight front is defined by the parameters (see
Figure 3).
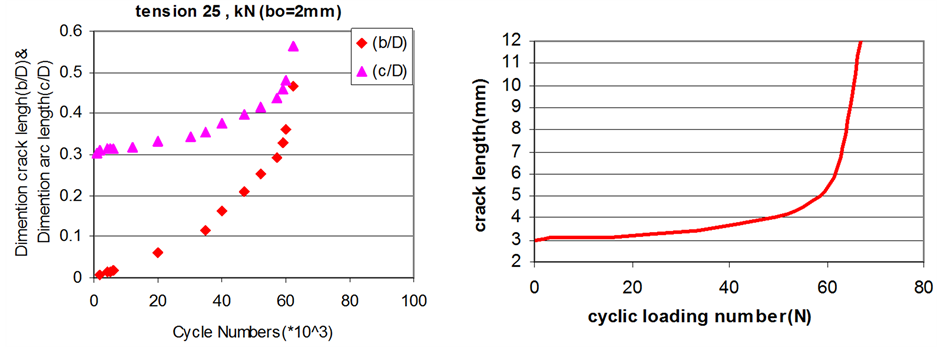
The SIF values have been obtained from the displacements of the wedge finite elements, measured in corresponding to the quarter-point nodes. The stress intensity is estimated at each node lying on the crack front by Equation (3). An initial crack growth step by step was designed and in any step stress intensity factor determined in any point of crack front. The stress intensity factor as a function of crack length is approximated by extrapolation method. Results has shown for points P(1) (point in center of crack front) and P(2) (point nearest the surface of bar in crack front) by Equation (7) and (8):
 (7)
(7)
 (8)
(8)
If use these equation in instead K parameter in Pais-Erdogan equation (Equation (1)), values of crack growth in each point of crack on specific cyclic can be predicted. Results for some points in crack front are shown in Figure 5(a) and Figure 5(b).
Most consistently, the residual lifetime is defined as the number of cycles until
the initial crack (a0), reaches its critical size (acr). However,
since the growth rate of long cracks is usually so high that failure is imminent
whatever the actual crack depth, quite different definitions of the critical state
are in use. The critical crack length (acr) is calculated from the stress
intensity factor for point P(1)
 and fracture toughness KIC. A deterministic value
10.21 mm is determined by the Newton-Raphson Method by Equation (7), resulted from
numerical procedure. In order to carry out a statistical analysis of the fatigue
life Nf of this component, the data presented in Section 4 was employed
in the integral in Equation (4).
and fracture toughness KIC. A deterministic value
10.21 mm is determined by the Newton-Raphson Method by Equation (7), resulted from
numerical procedure. In order to carry out a statistical analysis of the fatigue
life Nf of this component, the data presented in Section 4 was employed
in the integral in Equation (4).
The critical crack length was obtained from Equation (3) for deepest point P(1) of ac = 10.21 mm. The initial crack length was assumed to be the deterministic value of a0 = 2 mm. Values of KI(A) were simulated using the third order polynomial given in Equation (6). The simulation of fatigue crack extension and the determination of the residual lifetime is illustrated in Figure 5(b). This figure shows the growth a surface crack and its effects on fatigue life of component. This crack was then supposed to growth in many steps. Using the fracture mechanics theories, the crack propagation, after applying many cycles, was simulated according to the obtained equation
 (a) (b)
Figure 5. (a) Fatigue crack growth curves: arc length c versus cycle numbers N; (b) Fatigue life curve of component.
(Equation (1)). As that is shown , after applying 63,000 cycles the crack growth rate increases rapidly so that once the crack length reaches 12 mm the sudden fracture take place.
6. Conclusion
The behavior of a surface crack with straight front in a round bar under tension cyclic loading has been analyzed. The effects of supposed cracks on the fatigue behavior of round bar were simulated as well. The finite element method is employed in the present simulation technique because of its versatility and generality for complicated cracked structures. Also, the 1/4-point displacement method was used for evaluating the stress intensity factor by strain/stress singularity at the corner of a 20-node isoparametric element. It is noted that a few parameters, namely the initial crack aspect ratio has an influence on the crack front evolution, provide that the crack geometry is represented by relative dimensions with respect to the bar diameter. Results were shown, under pure cyclic tension loading, it can be seen that the crack propagation paths differ with diverse initial flaw depths, but converge to the same configuration when the crack depth ratio b/D is larger than about 0.5. The functions of aspect ratio and relative crack depth are obtained and by means of the function, the crack front shape and crack growth rate can be predicted well. This observation is obtained by means of the computational model. By using extrapolate method equations were offered for K1C and crack growth rate estimations. Based on these equations, the critical crack length was predicated to be about 10.21 mm after 6300 cycles.
Acknowledgements
The authors wish to thank the Iran National Science Foundation (Grant No. 51061005) for the financial support, the Iranian railway research center for the provision of the research facilities used in this work.
[1] Alihosseini, H. and Dehghani, K. (2010) Modeling and Failure Analysis of a Broken Railway Axle: Effects of Surface Defects and Inclusions. Journal of Failure Analysis and Prevention, 10, 233-239.
[2] Alihosseini, H. and Dehghani, K. (2006) Fatigue Life Analysis in Railway Axle. 10th Iranian Metallurgist Congress, Mashhad, 23-26 July 2006, 30-36.
[3] Alihosseini, H. (2006) Numerical Simulation and Experimental Study of Fatigue Crack Growth in Railway Axles. M.Sc. Thesis, Shiraz University, Shiraz.
[4] Lin, X.B. and Smith, R.A. (1999) Shape Evolution of Surface Cracks in Fatigued Round Bars with a Semicircular Circumferential Notch. International Journal of Fatigue, 21, 965-973. http://dx.doi.org/10.1016/S0142-1123(99)00075-4
[5] ASTM E 647 (1995) Standard Test Method for Measurement of Fatigue Crack Growth Rates. ASTM, Philadelphia.
[6] Daoud, O.E.K. (1984) Strain Energy Release Rates for a Straight-Fronted Edge Crack in a Circular Bar Subject to Bending. Engineering Fracture Mechanics, 19, 701-707. http://dx.doi.org/10.1016/0013-7944(84)90102-4
[7] Paris, P.C. and Erdogan, F. (1963) A Critical Analysis of Crack Propagation Laws. Journal of Basic Engineering, 85, 528-533. http://dx.doi.org/10.1115/1.3656900
[8] Alihosseini, H. and Dehghani, K. (2006) Simulation the Effects of Surface Cracks and Inclusion in Fatigue Life of Railway Axles. 10th Iranian Metallurgist Congress, Mashhad, 23-26 July 2006, 41-50.
[9] Barsoum, R.S. (1976) On the Use of Isoparametric Finite Elements in Linear Fracture Mechanics. International Journal for Numerical Methods in Engineering, 10, 25-37. http://dx.doi.org/10.1002/nme.1620100103
[10] Lin, X.B. and Smith, R.A. (1998) Fatigue Growth Simulation for Cracks in Notched and Unnotched Round Bars. International Journal of Mechanical Science, 40, 405-419. http://dx.doi.org/10.1016/S0020-7403(97)00039-8
Nomenclature

NOTES

*Corresponding author.