Journal of Geoscience and Environment Protection
Vol.05 No.06(2017), Article ID:76857,19 pages
10.4236/gep.2017.56011
Assessment of Groundwater Vulnerability in Kaduna Metropolis, Northwest Nigeria
Murtala Shehu Ahmed1*, Adamu Idris Tanko2, Martin Obada Eduvie3, Mohammed Ahmed2
1Department of Health, Safety and Environment, Kaduna Refining and Petrochemical Company Limited, Kaduna, Nigeria
2Department of Geography, Bayero University, Kano, Nigeria
3National Water Resources Institute, Kaduna, Nigeria

Copyright © 2017 by authors and Scientific Research Publishing Inc.
This work is licensed under the Creative Commons Attribution International License (CC BY 4.0).
http://creativecommons.org/licenses/by/4.0/


Received: April 4, 2017; Accepted: June 11, 2017; Published: June 14, 2017
ABSTRACT
DRASTIC index model was employed in the assessment of the intrinsic groundwater vulnerability to contamination in Kaduna metropolis, Nigeria. The model evaluates the contribution of seven environmental parameters (Depth to water level, Net Recharge, Aquifer media, Soil media, Topography, Impact of vadose zone, and Hydraulic Conductivity) in the protection of groundwater against contamination. The mapping was conducted within the framework of Geographical Information System. The study area has very low, low to slightly moderate vulnerability with highest and lowest DRASTIC values of 131 and 77 respectively. To have better understanding of the spatial vulnerability of groundwater in the area, the DRASTIC map was reclassified into five (very high, high, moderate, low and very low) vulnerability zones. Generally, the distribution of the vulnerability classes indicated the low to moderate vulnerability status of the majority parts of the study area, with high vulnerability at the center. Strict control measures should be put in place when locating land uses with high potential hazards in the high and very high vulnerability areas.
Keywords:
Groundwater, Vulnerability Mapping, Contamination, Geographic Information Systems, Nigeria

1. Introduction
Urban centers in many developing countries such as Nigeria, lack adequate supply of potable water for various activities from the municipal water supply agencies. In Kaduna metropolis, water supply consists of intakes of water from River Kaduna and backs up from Kangimi reservoir [1] which is not adequate to cater for the growing population. Households in these areas normally augment the epileptic supply by drilling boreholes and hand dug wells. Groundwater therefore, plays an important role in supporting both human livelihood and ecological balance in these areas. Numerous anthropogenic activities threatened groundwater quality globally. In some parts of the world, groundwater quality has deteriorated and seems unfit for human consumption without prior treatment [2] - [14] .
Although groundwater has a natural protection against contamination, once its quality is impaired, it proves difficult, costly and sometimes practically impossible to remediate. A proactive measure against groundwater contamination is therefore the basis for sustainable groundwater quality management. Natural protection of groundwater varies spatially dependent upon the intrinsic hydrogeological characteristics of areas, and this is coined as groundwater vulnerability. It is a measure of the degree of protectiveness of groundwater system against possible contamination, which depends on the intrinsic hydrogeological properties of an area. Groundwater vulnerability according to [15] , is the intrinsic property of groundwater system that depends on the sensitivity of that system to human and/or natural impacts.
The term vulnerability of groundwater to contamination was first introduced in France by Margat in late 1960s [16] . The idea was conceived in order to create awareness about the danger of groundwater contamination (Albinet and Margat in [16] ), variability of natural protection and identification of areas where protections are needed. Methods of assessing groundwater vulnerability to contamination are numerous, [17] however, they can be grouped into three, hydogeological complex and setting methods (HCSM), parametric system methods consisting of matrix, rating and point count system models, as well as analogical relations and numerical models. Parametric system models such as the DRASTIC index model [18] , GOD model [19] , EPIK model [20] , PI model [21] and COP model [22] are the most widely used vulnerability models in the world. Among the parametric, DRASTIC index model [18] is the most widely used vulnerability model throughout the world because of its relative simplicity, applicability at all scale and dependence on the existing data. It has been used by several researchers in different parts of the world such as [11] - [33] among others. The model was however, criticised by different scholars for its under estimation of the vulnerability of fractured aquifer (Rosen in [34] ), lack of detail on Karstic aquifer [20] [35] , and non flexibility enough to be customized to specific needs [17] . It was also criticised by [34] for the production of vulnerability index whose meaning are rather obscure and whose significance is unclear. Other criticisms include that it uses so many variables, which may cause some non-critical variables to subdue the influence of the critical parameters in some settings [35] . These notwithstanding, the advantages of the model were adjudged to have outweighed its shortcomings [36] .
Several researches have reported the deterioration of groundwater quality in parts of Kaduna metropolis, Nigeria [37] [38] [39] [40] [41] . The deteriorations were mostly attributed to poor sanitations and inappropriate land use planning occasioned by weak oversight functions of the agencies charged with environmental protection and planning. Proper documentations of the various contaminants sources as well as the spatial variations of aquifer vulnerability to contaminations were however, not conducted in the area. To bridge this gap, this paper assessed and mapped out the vulnerability of groundwater to contamination in Kaduna metropolis using DRASTIC Index model [18] . The choice of the model was informed by the availability of the required input data and the assumptions of the model. This model was developed by [18] in the United States for Environmental Protection Agency (US EPA). It is an acronym of seven factors considered relevant in assessing and mapping the intrinsic groundwater vulnerability. The factors are Depth to water level, Recharge, Aquifer media, Soil media, Topography, Impact of vadose zone and (hydraulic) Conductivity. The model is a point count system where each of the seven parameters is assigned a weight according to its relative importance in influencing groundwater vulnerability. Each parameter also has its own range, weight (W) and rating (R) (see appendix 1). DRASTIC Index is computed using the following formula:
 (1)
(1)
Final vulnerability map shows different classes (recent use normally five) indicating very high to very low vulnerability.
Since it is practically impossible to monitor all groundwater sources in Kaduna metropolis, the vulnerability map will guide in designing groundwater monitoring programme in the area. Fewer monitoring wells may be located in the less vulnerable areas with greater number in the highly vulnerable areas. This will reduce the overall cost of groundwater monitoring in Kaduna metropolis. It will also guide the authority charged with the urban planning to make an informed decision on future land use planning and the need for modifications of the present land uses where necessary. The maps, being in a Geographical information System (GIS) format, can easily be updated and incorporated into the environmental database of the study area.
2. Materials and Methods
2.1. The Study Area
Kaduna metropolis, the capital of Kaduna state, is located in north-western Nigeria between latitude 10˚18'40'' - 10˚40'48'' north of the equator and longitude 7˚11'6'' - 7˚36'18'' east of the Greenwich meridian (Figure 1) on an altitude of about 643 m above sea level. Administratively, it comprises the whole of Kaduna North and South, and parts of Igabi and Chikun local government areas. The climate of Kaduna is Aw as coded by Koppen with rainfall of about 1200 mm annually which typically last between 5 to 6 months (April to September). The rainy season is preceded by a short hot dry spell with mean monthly temperature of between 35˚C and 40˚C [42] . Temperature is generally hot throughout the year with the exception of slight period of cold and dry season (November to February).

Figure 1. Map of the Study Area. Source: Geographical Information System (GIS) Analysis.
The geology of Kaduna metropolis is predominantly metamorphic rocks of the Nigerian basement complex rock composing mostly of migmatite-gneiss complex and meta-sedimentary series. The area lies largely within the lower Kaduna catchment. Groundwater occurrence is predominantly in the weathered/fractured basement complex and river alluvium [43] . The weathered metamorphic and magmatic rocks produced weathered products known as regolith, saprolite or alterite composing of a mixture of sands and clays of varying thickness overlaying the altered or fractured parent rock [43] . Typical layers in the saprolite profile are top lateritic soil, clay alterite layer, granuler sandy zone and bed rock (Jones in [43] ). The relief is mostly undulating plains with isolated high plains in some parts. The soils are red brown to red yellow ferruginous soils. The vegetation of the area is northern guinea savannah with predominant grassland and scattered trees.
Kaduna is mostly populated by Hausa, Gbagyi, Katab, Bajjuu and 20 other ethnic communities, with Hausa and English as the most commonly spoken languages [1] . Nearly all Nigerian ethnic groups can be found in the metropolis. Urban agglomeration is put at 1,422,000 by UN estimate for 2007 [1] .
2.2. Data Type and Sources
All most all the data used for this research were from the documentary sources, first-hand survey was also conducted. A total of about 198 Vertical Electrical Sounding (VES) data and borehole completion report (BCR) were secured and their coordinates determined in the field using the Global Positioning System (GPS) GARMIN GPSmap 76CSx model. Over 90% 0f the VES and BCR were secured from the MEV Hydrosearch Engineering, Kaduna, others were secured from the Kaduna State Ministry of Water Resources and Kaduna State Rural Water Supply and Sanitation Agency. Additional 42 locations were sourced from [43] . Groundwater level measurement was conducted in some areas to augment the existing information. Table 1 summarizes the data sources.
2.3. Drastic Index Model
Detail on this model can be found in [18] . Preparation of the seven DRASTIC layers was conducted as prescribed by the authors with modification of the net recharge component. Geographical information system (GIS) was employed in the assessment.
2.3.1. Depth to Water Level
Most parts of the study area have groundwater level within 5 - 30 feet, it reaches up to about 50 - 75 feet in some locations such as Sabon Gayan. In some locations around Badiko and Tudun Wada, groundwater level is found within 5 feet above mean sea level. A thematic layer of this parameter for the study area was created using the spatial analyst function of Arc GIS 10.0 according to the model rating (Figure 2).
2.3.2. Net Recharge
In the study area, there was no readily available data on recharge from documentary sources, as such a simple formula proposed by [44] was used to determine the net recharge:
 (2)
(2)
Slope was generated by reclassifying the thematic layer of topography which was secured from the Digital Elevation Model of the area (section 2.3.6). Soil

Table 1. Data Type and Sources.

Figure 2. Thematic Layer of Depth to Water Level (ft) in Kaduna Metropolis. Source: Data Analysis (2015).
permeability as used in the formula, is a qualitative value given to the three soil types in the area (section 2.3.4). Sandy soils was rated 5, sandy loam 3 and loamy sand 4. Rainfall is expectedly uniform in the whole study area and exceeded 1000 mm according to literature, a uniform rating of 4 which signifies rainfall greater than 850 mm was adopted. Thematic layer of net recharge was produced using Equation 3. Recharge pattern is somewhat uniform in the whole study area and follows the pattern of topography. Using the model builder of Arc GIS 10.0, the qualitative classification of recharge was achieved (Figure 3).
2.3.3. Aquifer Media
According to literature and VES report, the study area is completely overlaid by uniform aquifer media, the weathered metamorphic/igneous rock which has the DRASTIC rating between 3 - 5. Typical rating of 4, as suggested by [18] was adopted in most parts of the study area. The value was adjusted in some areas to reflect the degree of consolidation of the aquifer materials. In some areas around Malali and Unguwan Rimi, where the materials are highly consolidated according to the VES reports, a rating of 3 was adopted. A rating of 5 was adopted in some areas such as Unguwan Pama, Romi and Barnawa due to the extreme weathering of the aquifer media. The result is depicted on Figure 4.
2.3.4. Soil Media
A scanned copy of Soil map of Nigeria produced by [45] was georefrenced, digi-
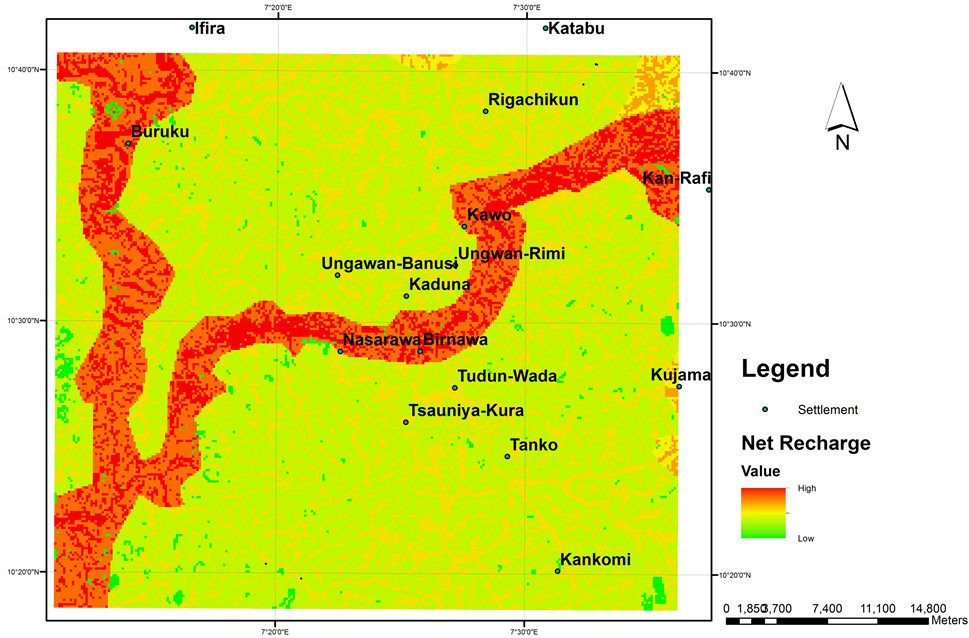
Figure 3. Qualitative Classification of Net Recharge in Kaduna Metropolis. Source: Data Analysis (2015).

Figure 4. Thematic Layer of Aquifer Media in Kaduna Metropolis. Source: Data Analysis (2015).
tized and the study area was extracted and vectorized. From the map and its accompanying report, two major soil textural classes were present in the area, the sandy loam and loamy sand. The third soil group which is the recent alluvium soil found within the course and the flood plain of River Kaduna, Rivers Tubo, Chidawaki, Rumana among others was described as sandy soil in the report, as such a rating of 9 was adopted for the category. Sandy loam which can be seen in the north, northeast, and eastern tips of the study area, was rated 6 according to the model. Loamy sand which occupies most parts of the study area, but not considered by the model was adjusted to 6.5. A thematic soil map of the area (Figure 5) was produced according to this rating using Arc GIS 10.0.
2.3.5. Topography
Topography of the area was generated using Digital Elevation Model (DEM) of Arc GIS 10.0. Slope percent was then calculated using the slope function of the same software. It was classified according to the DRASTIC rating as can be seen on Figure 6.
2.3.6. Impact of Vadose Zone
The vadose zone media of the study area is metamorphic/igneous formation which has the theoretical rating of between 2 - 8. A typical rating of 4 was adopted for most parts of the area according to the DRASTIC rating. The rating

Figure 5. Thematic Layer of Soil Media in Kaduna Metropolis. Source: Data Analysis (2015).
was also adjusted to 2 and 3 for massive igneous around Malali and partially weathered formation around Malali, Unguwan Rimi and the like. Using the same software, the vadose zone map of the area was produced (Figure 7).
2.3.7. Hydraulic Conductivity
Information on this parameter appeared scanty in the study area. However, almost all the available information documented through pumping test of some boreholes in the area, indicated that the conductivity falls within the range of 1 - 100 gallon per day per square feet, thus, a rating of 1 was adopted for the parameter throughout the study area (Figure 8).
3. Result and Discussion
3.1. Drastic Index Vulnerability Mapping
Using the model builder of Arc GIS 10.0, Equation (1) was inputted and the model runs to produce the final DRASTIC vulnerability map of Kaduna metropolis (Figure 9).
The highest DRASTIC value obtained in the whole study area was 131 while the lowest was 77. Theoretically, the highest value of normal DRASTIC is 223 while the lowest is 65. The values can thus be graded into five qualitative classes (Table 2).

Figure 6. Thematic Layer of Slope in Kaduna Metropolis. Source: Data Analysis (2015).
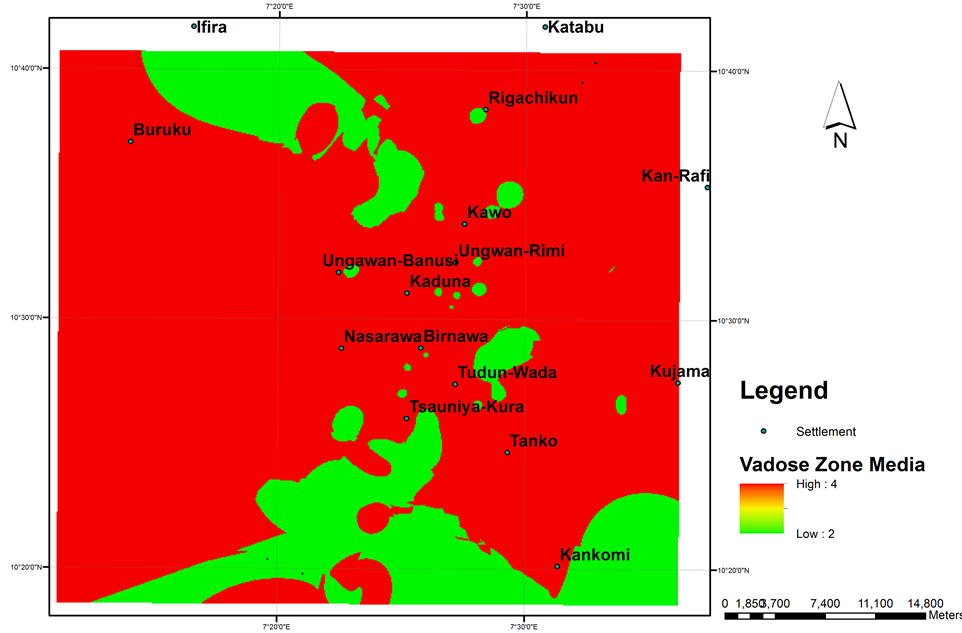
Figure 7. Thematic Layer of Vadose Zone Media in Kaduna Metropolis. Source: Data Analysis (2015).

Figure 8. Thematic Layer of Hydraulic Conductivity in Kaduna Metropolis. Source: Data Analysis (2015).

Figure 9. Unclassified DRASTIC Vulnerability Map of Kaduna Metropolis. Source: Data Analysis (2015).
Table 2. Classification and Description of DRASTIC Index Values.
Source: Discerned from [18] based on the theoretical values.
Putting this in mind, it is noticeable that, the groundwater vulnerability to contamination of the entire study area falls within very low, low and slightly moderate vulnerability (Figure 10). However, the essence of this study is to determine which area is more vulnerable to groundwater contamination than others, as such, the obtained values were retained and reclassified (via “reclass” function of ArcGIS) into five classes of very low, low, moderate, high and very high vulnerability to contamination (Figure 11) as suggested by [15] .
From the classified DRASTIC vulnerability map, one can rightly see that, majority of the study area falls within very low, low and moderate vulnerability to groundwater contamination. Very low vulnerability areas can be seen in the northern part around Turunku and Sabon Gida, in the northeast around Rinagi,
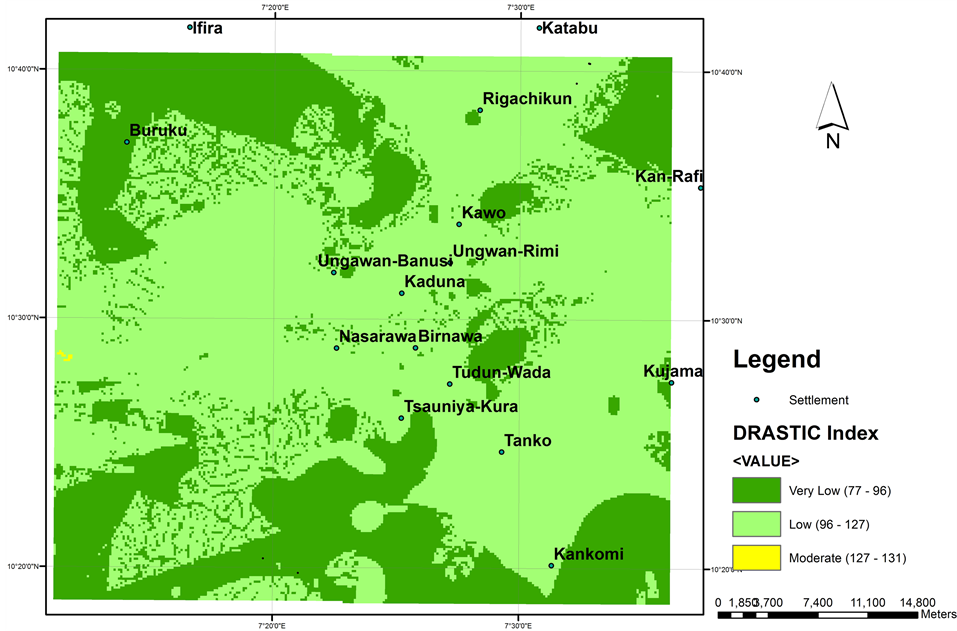
Figure 10. Classified DRASTIC Vulnerability Map of Kaduna Metropolis Based on Total DRASTIC Scores. Source: Data Analysis (2016).

Figure 11. Classified DRASTIC Vulnerability Map of Kaduna Metropolis. Source: Data Analysis (2015).
and in the southwest around Kasewa Hill. The same vulnerability class occurred in the southern part of the study area around Bakin Kasuwan Gwari and south- eastern tip.
Low vulnerability areas can be seen in the northwest around Rumana and Zato, and southwest around Jimmu, Nima and Kasewa Hill. In the south and southeast, low vulnerability class is predominant as can be seen around Kukau, Kakau and Kankomi respectively, the same class can be found in the north around Afaka and Rigachikun, in the northeast around Butonu and in the center at Babban Saura and Kamazo.
Moderate vulnerability happens to be the most dominant class in the study area. Encircling the high vulnerability areas, moderate vulnerability occurs to the north around Rigachikun Forest Reserve, Afaka and Kawo. It can also be seen around Gwogote and Tagwaye in the west, as well as most eastern and southern parts of the study area.
High groundwater vulnerability areas occupied most of the central parts of Kaduna metropolis especially within the township, Tudun Nupawa and Unguwan Shanu. It also occupies the northern part of the metropolis stretching from NDC, Rigachikun, Maraban Jos and Birnin Yero. The same class occurs in Kaduna south around Kakuri, Makera and Sabon Tasha, and in the southeast around Chidunu and Anguwan Tanko. Other areas belonging to this category are Kwane and Kadi in the west as well as Gwarso in the north-western part of the study area.
Very high vulnerability class occupies very small portion of the study area. It can be seen as an encircled area in the east, and in scattered form in the west, south-west, as well as southern part of the study area. Fewer areas also occurred at the center around River Mashi and north-western part of the area.
3.2. Map Production, Data Quality and Reliability
It is generally believed that, the quality of any map is determined by the quality of the input data used in map production. In this research, several types and sources of data were consulted, extracted, gathered and synthesized for the production of the thematic layers used in the production of the final DRASTIC vulnerability map. Its believed that, the data used for the task and at this scale, represent the best quality information which is available at the moment. However, with improved data quality, the map quality will also be greatly improved. Mapping and models in general, are simplifications of the complex reality. Groundwater vulnerability assessments and mapping as put forward by [46] are “a means to synthesize complex hydrogeological information into a form useable by planners, decision and policy makers, geoscientists and the public”.
4. Conclusions
From the previous section, it can be concluded that groundwater system in most parts of Kaduna metropolis is low to moderately vulnerable to contamination. However, this does not preclude the occurrence of real pollution incidence in the area which may be tight to the potential or actual contaminants sources (hazards) present. In view of this, a low vulnerability area with very high hazards may be exposed to higher risk of groundwater contamination than a highly vulnerable area with low or very low hazards. Conversely, contamination incidence may be low in a highly vulnerable area with high hazards, but with adequate control measures to safeguard the groundwater system. The vulnerability map will serve as screening tool and guide the administrators where to direct resources (more vulnerable areas) when there is limited resources. It may be used for preventive purposes through prioritization of areas where groundwater protection is critical. This will help in reducing the cost of groundwater monitoring in the area.
That notwithstanding, it is recommended that land use(s) with high groundwater potential hazards be located in the low vulnerability areas. Where an existing land use with higher contamination hazard is already located on a highly vulnerable area, more sophisticated control measures should be put in place. Proper documentation of potential and existing groundwater contaminants sources in the area, will therefore, be vital for sustainable groundwater quality management in Kaduna metropolis.
Cite this paper
Ahmed, M.S., Tanko, A.I., Eduvie, M.O. and Ahmed, M. (2017) Assessment of Groundwater Vulnerability in Kaduna Metropolis, Northwest Nigeria. Journal of Geoscience and Environment Protection, 5, 97-115. https://doi.org/10.4236/gep.2017.56011
References
- 1. Max Lock Consultancy Nig. Ltd. and Partners (2008) Kaduna Master Plan Interim Report, Kaduna.
- 2. Yidana, S.M., Yakubo, B.B. and Akabzaa, T.M. (2010) Analysis of Groundwater Quality Using Multivariate and Spatial Analyses in the Keta Basin, Ghana. Journal of African Earth Sciences, 58, 220-234.
https://doi.org/10.1016/j.jafrearsci.2010.03.003 - 3. Yerima, F.A.K., Daura, M.M. and Gambo, B.A. (2008) Assessment of Groundwater Quality in Bama Town, Nigeria. Journal of Sustainable Development in Agriculture and Environment, 3, 128-137.
- 4. Raja, G. and Venkatesan, P. (2010) Assessment of Groundwater Pollution and Its Impact in and around Punnam Area of Karur District, Tamilnadu, India. E-Journal of Chemistry, 7, 473-478.
https://doi.org/10.1155/2010/782134 - 5. Mohammed, S.A.S., Naik, M., Fakruddin, S.P., and Nazeer, Z.A.M. (2008) Studies of Contaminant Transport at an Industrial Waste Dumpsite of Bangalore, India. Ambiente e Agua An Interdisciplinary Journal of Applied Sciences, 3, 55-66.
https://doi.org/10.4136/ambi-agua.61 - 6. Galadima, A., Garba, Z.N., Leke, L., Almustapha, M.N. and Adam, I.K. (2011) Domestic Water Pollution among Local Communities in Nigeria—Causes and Consequences. European Journal of Scientific Research, 4, 592-603.
- 7. Foster, S.S.D. and Chilton, P.J. (2003) Groundwater: The Processes and Global Significance of Aquifer Degradation. Philosophical Transactions of the Royal Society B, 358, 1957-1972.
https://doi.org/10.1098/rstb.2003.1380 - 8. Asadi, S.S., Vuppala, P. and Reddy, M.A. (2007) Remote Sensing and GIS Techniques for Evaluation of Groundwater Quality in Municipal Corporation of Hyderabad (Zone-V), India. International Journal of Environmental Research and Public Health, 4, 45-52.
https://doi.org/10.3390/ijerph2007010008 - 9. Sagnak, C. (N.D) Groundwater pollution originated from geological formation, example of Konya-Cumra-Karapinar Plain with GIS application. Department of Geotechnical Services and Groundwater, State Hydraulics Works, Ankara, Turkey.
- 10. Berg, M., Tran, H.C., Nguyen, T.C., Pham, H.V., Schertenleib, R. and Giger, W. (2001) Arsenic Contamination of Groundwater and Drinking Water in Vietnam: A Human Health Threat. Environmental Science and Technology, 35, 2621-2626.
https://doi.org/10.1021/es010027y - 11. Castillejos, K.M. (2010) Assessing Integrated Watershed Management and Spatial Groundwater Vulnerability to Pollution in Priority Watersheds of the Yacyreta Dam in Paraguay. Unpublished Ph.D. Dissertation, University of Wales (Bangor University) and Tropical Agricultural Research and Higher Education Center (CATIE).
- 12. Mukherjee, S. and Nelliyat, P. (2007) Groundwater Pollution and Emerging Environmental Challenges of Industrial Effluent Irrigation in Mettupalayam Taluk, Tamil Nadu. Comprehensive Assessment of Water Management in Agriculture, Discussion Paper 4, International Water Management Institute, Colombo, Sri Lanka.
- 13. Singh, C.K., Shashtri, S. and Mukherjee, S. (2010) Integrating Multivariate Statistical Analysis with GIS for Geochemical Assessment of Groundwater Quality in Shiwaliks of Punjab, India. Environmental Earth Sciences, 62, 1387-1405.
- 14. Atlantic Environmental Services, Inc. (1996) Task 210: Surficial Site Investigation, Improvements to Routes 82&85 Salem and Montville. Project No. 1178-075-210, Prepared for Environmental Compliance Division, Department of Transportation, Newington, State of Connecticut.
- 15. Vrba, J. and Zaporozec, A. (1994) Guidebook on Mapping Groundwater Vulnerability, Vol. 16. International Contribution to Hydrogeology, Hannover, 131 p.
- 16. Zaporezec, A. (1994) Concept of Groundwater Vulnerability. In: Vrba, J. and Zaporezec, A., Eds., Guidebook on Mapping Groundwater Vulnerability, Vol. 16. International Contribution to Hydrogeology, Hannover.
- 17. Vrba, J. and Civita, M. (1994) Assessment of Groundwater Vulnerability. In: Vrba, J. and Zaporezec, A., Eds., Guidebook on Mapping Groundwater Vulnerability, Vol. 16, International Contribution to Hydrogeology, Hannover, 31-48.
- 18. Aller, A., Lehr, J.H., Petty, R. and Bennet, T. (1987) DRASTIC: A Standardized System to Evaluate Groundwater Pollution Potential Using Hydrogeologic Settings. National Water Well Association, Wethington, OH.
- 19. Foster, S.S.D. (1987) Fundamental Concepts in Aquifer Vulnerability, Pollution Risk and Protection Strategy. In: Duijvenbooden, W. and Waegeningh, H.G., Eds., Vulnerability of Soil and Groundwater to Pollutants, TNO Committee on Hydrological Research, The Hague, Proceedings and Information 38, 69-86.
- 20. Doerfliger, N., Jeannin, P.Y. and Zwahlen, F. (1999) Water Vulnerability Assessment in Karst Environments: A New Method of Defining Protection Areas Using a Multiattribute Approach and GIS Tools (EPIK Method). Environmental Geology, 39, 165-176.
https://doi.org/10.1007/s002540050446 - 21. Goldscheider, N., Klute, M., Sturm, S. and Hotzl, H. (2000) The PI Method—A GIS-Based Approach to Mapping Groundwater Vulnerability with Special Consideration on Karst Aquifers. Zeitschrift für angewandte Geologie, 46, 157-166.
- 22. Vias, J.M., Andreo, B., Perles, M.J. and Carrasco, F. (2005) A Comparative Study of four Schemes for Groundwater Vulnerability Mapping in a Diffuse Flow Carbonate Aquifer under Mediterranean Climatic Conditions. Environmental Geology, 47, 586-595.
https://doi.org/10.1007/s00254-004-1185-y - 23. Ohio Environmental Protection Agency (2009) Groundwater Susceptibility Analysis Process Manual. Division of drinking and Ground Waters, Source Water Assessment and Protection Programme, Environmental Protection Agency, Ohio.
- 24. Ahmed, A.A. (2007) Using Contamination and Pesticide DRASTIC GIS-Based Models for Vulnerability Assessment of Quaternary Aquifer at Sohag, Egypt. Paper presented at the 5th International Conference on the Geology of Africa, Assiut, Egypt, October 2007.
- 25. Dickerson, J.R. (2007) A Modified DRASTIC Model for Siting Confined Animal Feeding Operations (CAFOs) in Williams County, Ohio. Unpublished M.Sc. Thesis, Graduate College of Bowling Green State University, Ohio.
- 26. Jasrotia, A.S. and Singh, R. (2005) Groundwater Pollution Vulnerability Using the DRASTIC Model in a GIS Environment, Devak-Rui Watershed, India. Journal of Environmental Hydrology, 13, 1-10.
- 27. Babiker, I.S., Mohamed, A.A.M., Hiyama, T. and Kato, K. (2005) A GIS-Based DRASTIC Model for Assessing Aquifer Vulnerability in Kakamigahara Heights, Gifu Prefecture, Central Japan. Science of the Total Environment, 345, 127-140.
https://doi.org/10.1016/j.scitotenv.2004.11.005 - 28. Al-adamat, R.A.N., Foster, I.D.L. and Baban, S.M.J. (2003) Groundwater Vulnerability and Risk Mapping for the Basaltic Aquifer of the Azraq Basin of Jordan Using GIS, Remote Sensing and DRASTIC. Applied Geography, 23, 303-324.
https://doi.org/10.1016/j.apgeog.2003.08.007 - 29. Lobo-Ferreira J.P. (2000) GIS and Mathematical Modelling for the Assessment of Groundwater Vulnerability to Pollution: Application to Two Chinese Case Study Areas. Ecosystem Service and Sustainable Watershed Management in North China, International Conference, Beijing, 23-25 August 2000, 69-90.
- 30. Sekhar, M.C. and Kumar, K.K. (1999) The Use of DRASTIC Modelling Indices for the Assessment of Groundwater Pollution Potential. Proceedings of IUGG 99 Symposium on Impacts of Urban Growth on Surface Water and Groundwater Quality, HS5, IAHS Publ. No. 259, Birmingham, 18-30 July 1999, 111-113.
- 31. Webb, T.H. and Lilburne, L.R. (1999) Use of the LEACHM Model and the DRASTIC Index to Map Relative Risk of Groundwater Contamination by Pesticide Leaching. Journal of Hydrology (NZ), 38, 271-288.
- 32. Engel, B., Navulur, K. and Cooper, B. (1996) Estimating Groundwater Vulnerability to Nonpoint Source Pollution from Nitrates and Pesticides on a Regional Scale. Proceedings of the Vienna Conference, IAHS Publ. No.2 35, April 1996.
- 33. Barber, D.J. (1994) Groundwater Pollution Potential of Cuyahoga County, Ohio. Report No. 4, Department of Natural Resources, Ohio.
- 34. Foster, S.S.D. and Skinner, A.C. (1995) Groundwater Protection: The Science and Practice of Land Surface Zoning, Groundwater Quality: Remediation and Protection. Proceedings of the Prague Conference, IAHS Publ. No. 225, May 1995.
- 35. Zwahlen, F. (2004) Vulnerability and Risk Mapping for the Protection of Carbonate (Karst) Aquifers. Final Report (COST Action 620), European Commission, Directorate XII Science, Research and Development, Report EUR 20912, Brussels, 297 p.
- 36. Wang, J., He, J. and Chen, H. (2012) Assessment of Groundwater Contamination Risk Using Hazard Quantification, a Modified Drastic Model and Groundwater Value, Beijing Plain, China. Science of the Total Environment, 432, 216-226.
https://doi.org/10.1016/j.scitotenv.2012.06.005 - 37. Amadi, A.N., Okoye, N.O., Alabi, A.D., Tukur, A. and Angwa, E.M. (2014) Quality Assessment of Soil and Groundwater near Kaduna Refinery and Petrochemical Company, Northwest Nigeria. Journal of Scientific Research & Reports, 3, 884-893.
https://doi.org/10.9734/JSRR/2014/6579 - 38. Al-Amin, M.A. (2013) Energy Production and Environmental Concerns in Nigeria: The Case of Kaduna Petroleum Refinery on Its Host Communities. Journal of Energy Technologies and Policies, 3, 69-77.
- 39. Eduvie, M.O. and Olaniyan, I.O. (2013) Groundwater Quality Appraisal in Southern Parts of Kaduna State, Nigeria. American Journal of Environmental Engineering, 3, 77-83.
https://doi.org/10.5923/j.ajee.20130301.11 - 40. Muhammad, M.N. (2012) Assessment of Groundwater Quality in Low Income High Density Areas of Kaduna Metropolis. Academic Research Journal, 2.
- 41. Yabaya, A. and Aliyu, A. (2012) Microbial Quality Assessment of Well Water in Kaduna North Local Government. Journal of Biological Science and Bioconservation, 4, 1-6.
- 42. Mallo, I.Y. (2001) Morphometric Characteristics of Barnawa River Catchment in Kaduna Metropolis, Northern Nigeria. Journal of Environmental Sciences, 4, 22-28.
- 43. Eduvie, M.O. (2003) Exploration, Evaluation and Development of Groundwater in Southern Kaduna State. Unpublished Ph.D. Thesis, Department of Geology, Ahmadu Bello University, Zaria.
- 44. Piscopo, G. (2001) Groundwater Vulnerability Map Explanatory Notes, Macquarie Catchment, Parramatta. Centre for Natural Resources, NSW Department of Land and Water Conservation.
- 45. Federal Department of Agricultural Land Resources (1990) The Reconnaissance Soil Survey of Nigeria, Soils Report Vol. 2. Scanned Map and Report downloaded from soil.isric@wur.nl
- 46. Ligget, J.A. and Talwar, S. (2009) Groundwater Vulnerability Assessments and Integrated Water Resources Management. Streamline Watershed Management Bulletin, 13, 18-29.
Appendix 1
Rating of Drastic Index Model (Aller et al. 1987).


Submit or recommend next manuscript to SCIRP and we will provide best service for you:
Accepting pre-submission inquiries through Email, Facebook, LinkedIn, Twitter, etc.
A wide selection of journals (inclusive of 9 subjects, more than 200 journals)
Providing 24-hour high-quality service
User-friendly online submission system
Fair and swift peer-review system
Efficient typesetting and proofreading procedure
Display of the result of downloads and visits, as well as the number of cited articles
Maximum dissemination of your research work
Submit your manuscript at: http://papersubmission.scirp.org/
Or contact gep@scirp.org