Natural Resources
Vol. 4 No. 1A (2013) , Article ID: 29394 , 8 pages DOI:10.4236/nr.2013.41A017
Scientific Catch-Up in Asian Economies: A Case Study for Solar Cell
![]()
1Graduate School of Engineering, University of Tokyo, Tokyo, Japan; 2Policy Alternatives Research Institute, University of Tokyo, Tokyo, Japan.
Email: isakata@ipr-ctr.t.u-tokyo.ac.jp, sasaki@pp.u-tokyo.ac.jp
Received January 14th, 2013; revised February 14th, 2013; accepted February 22nd, 2013
Keywords: Catch-Up; Growth Model; Bibliometrics
ABSTRACT
A significant structural change in the pattern of economic development in Asian economies has been observed in recent years. We have seen many cases in which the Asian economies became the center of the world-wide production in an extremely short period of time after a new product entered the market. Also in the science, the number of papers written by Asian researchers has been increasing dramatically. In this situation, the existing studies cannot sufficiently explain the driving force and the mechanism of catch-up or economic growth. Therefore, it is now required to model this new type of economic development. In this paper we analyzed their scientific catch-up status using scientific papers on solar cells to clarify the structural change. After mid 1990s, knowledge creation has been accelerated in the field of solar cell. Now more than three thousand papers are published annually. We found as a result that the catch-up process in Asian economies had progressed rapidly, that some economies had a larger share of scientific papers in the frontier field of advanced science than in the matured fields, and that the strategy largely changed from area to area. A “parallel-running-type growth model” has thus been emerging in Asia. Responding to the significant changes in development model, we have to re-design the framework of economic cooperation. There is a need for further horizontal collaboration among major Asian economies and developed economies. We also showed that bibliometrics is an effective method for presuming a detailed national strategy that is not known to the outside.
1. Introduction
In fields such as development economics, political science, and innovation research, many studies have been conducted on the process in which the developing economies catch up with the advanced economies and on the convergence of the disparity. In particular, East Asia has been the central target of the researches [1-9]. They can be classified according to the analysis targets: the studies on the production capabilities, those on the innovation capabilities, and those on the fundamentals and policies that affect these capabilities. Most of the studies use models in which the developing economies catch up with the advanced economies and gradually progress in the same development process as did the advanced economies A typical model is the flying goose pattern of industrialization [10,11]. Also, most of the papers focusing on the innovation capabilities are studies on the transfer or development of the industrial technologies, conducted on the basis of patent data. In contrast, there are few researches on the catch-up processes in the science. In the 21st century, however, we have seen many cases in which the developing economies became the center of the world-wide production in an extremely short period of time after a new product entered the market, such as LCD TVs, solar cells, and cellular phones. Also in the science, the number of papers written by Chinese or Indians has been increasing dramatically and the structure of the geographical distribution of scientific knowledge is significantly changing [12]. In this situation, the existing studies cannot sufficiently explain the driving force and the mechanism of catch-up or economic growth. Therefore, it is now required to model this new type of economic development. This paper aims to focus on the catch-up processes in the science and clarify the current situation. We will also discuss the differences among the economies and the causes for the differences.
We selected solar cell as a subject to analysis. Sustainable and renewable energies have been widely accepted as a key concept for our common future [13]. A solar cell or photovoltaic cell, which is a device that converts solar energy into electricity via the photovoltaic effect, represents a promising research front for our future sustainable ecosystem. The solar cell systems can be classified into four types: silicon, compounds, organics, and dye-sensitized cells. The silicon solar cells are the most-commercialized matured technology, while the organics and dye-sensitized cells are new technologies that are not commercialized (see Figure 1). Therefore, solar cellsare an appropriate theme for discussing whether the technical maturity causes a difference in the development strategy
2. Methodology
For each type of solar cell we clarify the research capabilities in major developing economies and the partner relationship between the areas, using numerous paper data, and then compare the types.
We applied two methodologies for analyzing the structure of scientific knowledge. First of all, the citation network analysis for creating an academic landscape is shown. Analyzing schema is schematically depicted in Figure 2. Step 1) is to collect data of the knowledge domain. We collected citation data from the Science Citation Index Expanded (SCI-EXPANDED), the Social Sciences Citation Index (SSCI), and the Arts & Humanities Citation Index (A&HCI) compiled by Thomson Reuters, which maintains citation databases covering thousands of academic journals and offers bibliographic database services, because they are three of the best sources for citation data. The problem of how we should define a research domain is difficult to solve. One solution is to use a keyword that seems to represent the research domain. When we collect papers retrieved by the keyword, we can make the corpus for the research domain.
In step 1) for creating academic landscape, we searched for papers using the terms “solar cell” as the query. As a result, we obtained the data of 41,795 papers published until the mid of 2009.
Step 2) is to make citation networks for each year. We
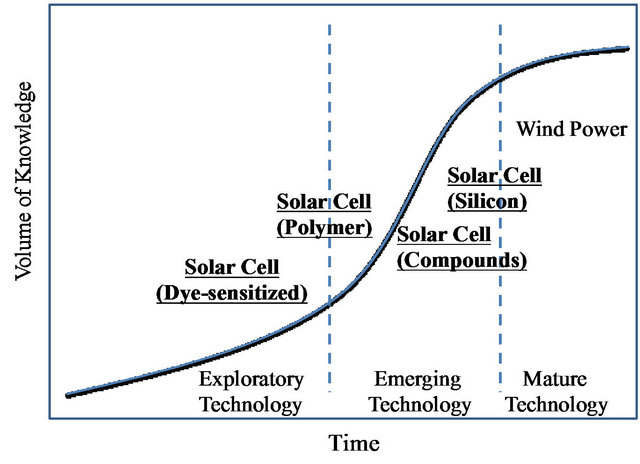
Figure 1. Maturity of Technologies.
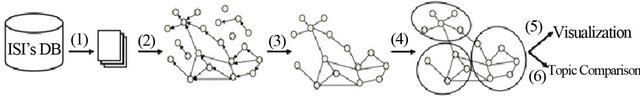
Figure 2. Methodology proposed in this paper.
constructed citation networks by regarding papers as nodes and intercitations as links. According to the previous study, intercitation, which is also sometimes known as direct-citation, is the best way of detecting emerging trends [14]. In network analysis, only the data of the largest component on the graph was used. Because we collected papers by query, our corpus included papers that are not relevant to solar cell. By focusing on the largest component, we can identify papers from our study that are not linked with any others in step 3) and therefore those noisy papers are expected to be eliminated. After extracting the largest connected component, in step 4), the network was divided into clusters using the topological clustering method [15], which does not need the number of clusters by users like k-means clustering algorithm. Newman’s algorithm extracts tightly knit clusters with a high density of links within the cluster. After the clustering, we visualized the citation networks and named the major clusters of emerging topics as in steps 5) and 6), respectively. In step 5), in order to visualize citation maps, we applied a large graph layout (LGL), an algorithm developed by Adai et al. [16], capable of dynamically visualizing large networks comprised of hundreds of thousands of nodes and millions of links. We visualized the citation network by expressing intracluster links in the same color, in order that the clusters are intuitively understood. In step 6), experts in the research domain assign a name to each cluster manually after they have seen the titles and abstracts of the papers in each cluster. Through this process we can identify the solar cell knowledge groups objectively. As is mentioned, we found a clear difference in the knowledge maturity among the groups.
Second, we created a research network diagram from the same database used for the creation of academic landscape, and for the extraction of data related to the organizational affiliation of authors, geographical location of such organizations and co-authorships. We applied this approach to four major clusters, separately. In detail, two types of analysis were conducted: analysis on research competency and that on co-authorship. Research competency of each area and organization was evaluated from the number of papers by them. Collaboration pattern between organizations was analyzed by equally regarding all combinations of organizations of co-authorsas one collaboration. Authors in co-authored papers are not weighed by the order listed. For example, if one paper is written by four different authors, and each author belongs to a different organization, the paper is considered to include six co-authorship relations. In addition, a co-authorship is defined as an international co-authorship if the authors belong to organizations in different areas. The same calculation schema was adopted to analyze the international collaboration pattern with that of the organizational pattern. Combinations of area that have more co-authorship relations are identified. Then, the result was visualized as a “research network diagram” with the author’s area as a node and the co-authorship relation as a link between the nodes. In the diagram, organizations are grouped into the area to which they belong. The hub of international co-authorships was also obtained from the analysis.
As with our analytical method, there are several studies that use co-authorship as an indicator of international collaboration [17-21]. Especially, large number of studies using co-authorship has been conducted in the EU. Katz and Martin point out four key advantages of using co-authorship as an indicator of collaboration including its verifiability, statistical significance, data availability, and ease of measurement [22]. On the other hand, bibliometric analysis of multiple-author papers is not accurate as it can only be used to measure collaborative activities where the collaborating participants have entered their names on joint papers. We are aware of a bias where each research paper published separately despite the collaboration cannot be correctly identified. Nevertheless, this unique analytical method and data provides useful and clear empirical evidence, and when used with appropriate caution reveals new insights for international science policy.
3. Results
Figure 3 shows annual publication of academic papers in the field of solar cell based on the data base provided by Thomson Reuters. It identified the rapid growth of knowledge creation in the field of solar cell.
After mid 1990s, knowledge creation has been accelerated. Now more than three thousand papers are published annually. Without computer-based approach, it is very hard to know the meta structure as well as structural changes of knowledge related to solar cell.
Figure 4 is the visualized results of solar cell research. We can see the main four clusters, #1 Compounds, #2 Organics, #3 Silicon, and #4 Dye-sensitized. The citation network of solar cell research can be divided according to the material used in the cell. The average publication year of the papers on silicon solar cells is the earliest and that of the papers on dye-sensitized solar cells is the most recent. Since there are very old papers on organic solar cells, the average publication year is almost the same as that of silicon and compound solar cells. With the exception of these old papers, the average publication year of the organics is the second most recent, next to dye-sensitized. Also, due to the rapid increase of the number of papers on organics and dye-sensitized solar cells, the numbers of papers belonging to the four clusters are similar to each other.
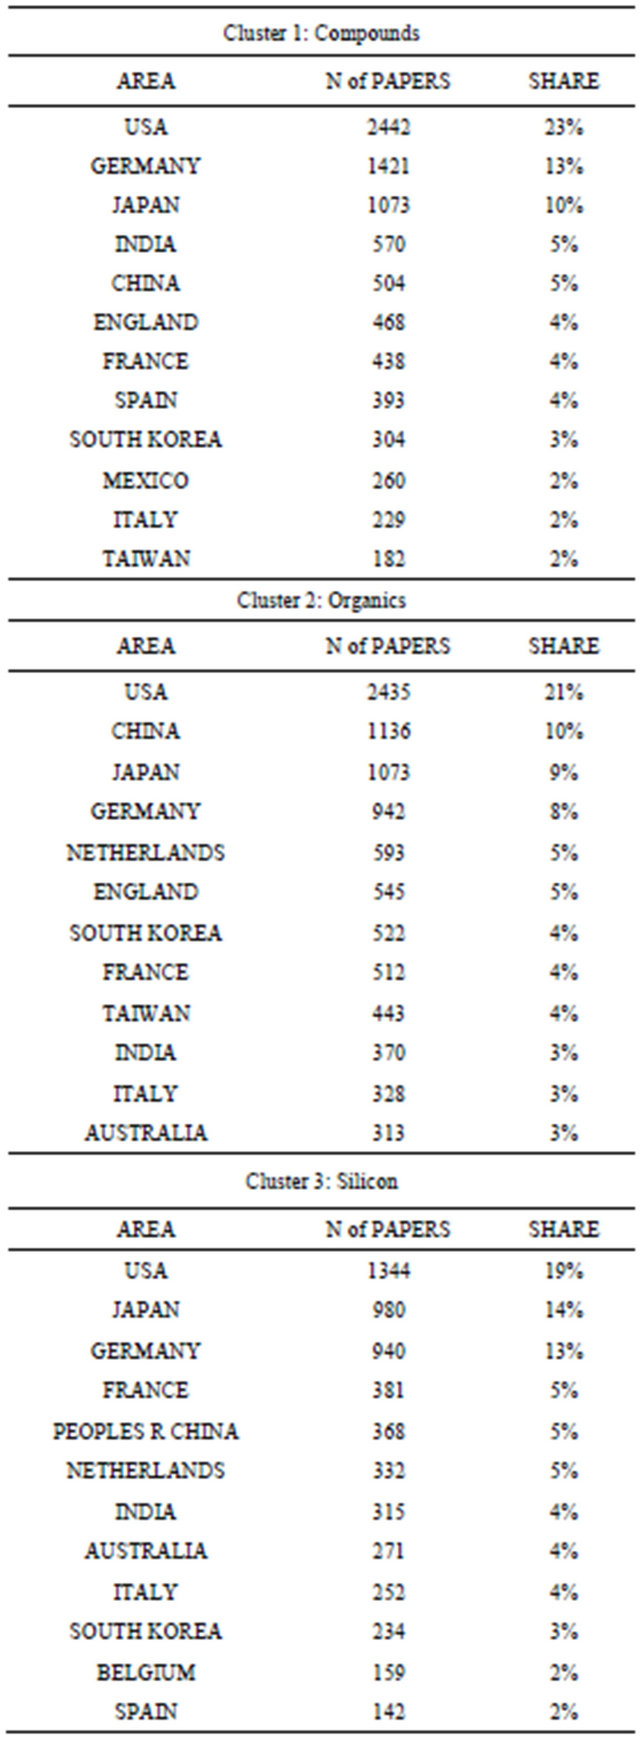
Next, we calculated the number and share of the papers per each cluster written in the major areas. The highranking areas are the USA, Japan, Germany, China, India, France, England, South Korea, and Taiwan. Since China, India, South Korea, and Taiwan are on the list, it is obvious that the Asian areas are catching up not only in the industrial technology, but also in the academic fields (Figure 5). If we look at each area’s share of the papers in each cluster (Table 1), we see that China has more than 10% share in the cluster of organic cells and in the cluster of dye-sensitized cells. In particular the number of

Figure 3. Annual publication of academic paper.
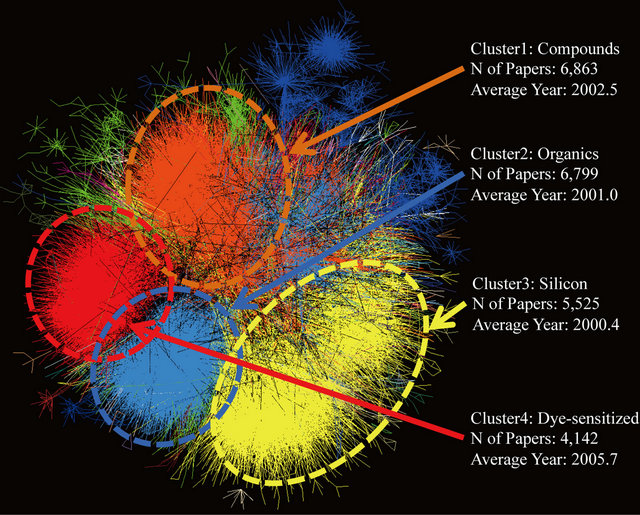
Figure 4. Academic landscape of solar cell

Figure 5. Number of papers in major areas.
Table 1. Top ranking areas in each cluster.
Continued
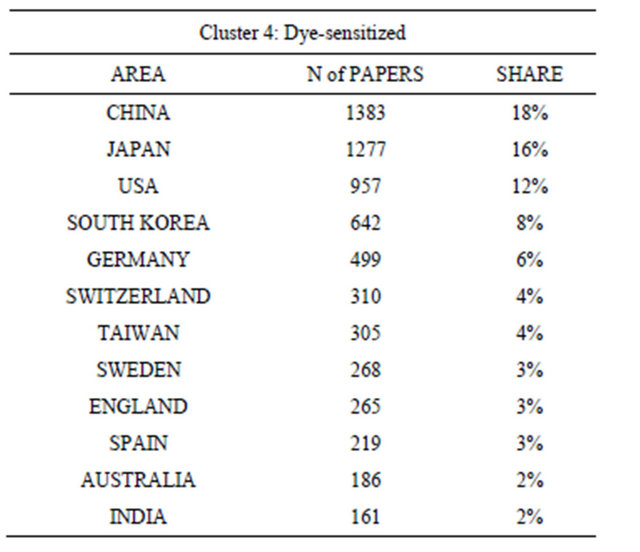
papers of China in the cluster of dye-sensitized solar cells is the highest in the world. However, China’s share in the cluster of compound cells or in the cluster of silicon cells is about 5%. Based on the above data, China is highly competitive in the advanced fields of the immature technologies. At present China does not have a strategy of placing emphasis on the infrastructure reinforcement for silicon solar cells for which China has the largest production share in the world. In contrast, India has a large share in the cluster of compounds and silicon solar cells and low shares in the clusters of organics and dye-sensitized cells. In contrast to emerging fields, it has a relative advantage in the matured field. South Korea has a large share in the cluster of dye-sensitized cells although its share in the cluster of organic solar cells, i.e. newly-developing solar cells, is not very high. Taiwan, like China, has a relatively high share in the clusters of organics and dye-sensitive cells. From these we see that the Asian economies can be classified into three categories. One is China and Taiwan, which have a relative advantage in the emerging fields. The second is India, which has an advantage in the matured fields. The third is South Korea, which lies somewhere between the two.
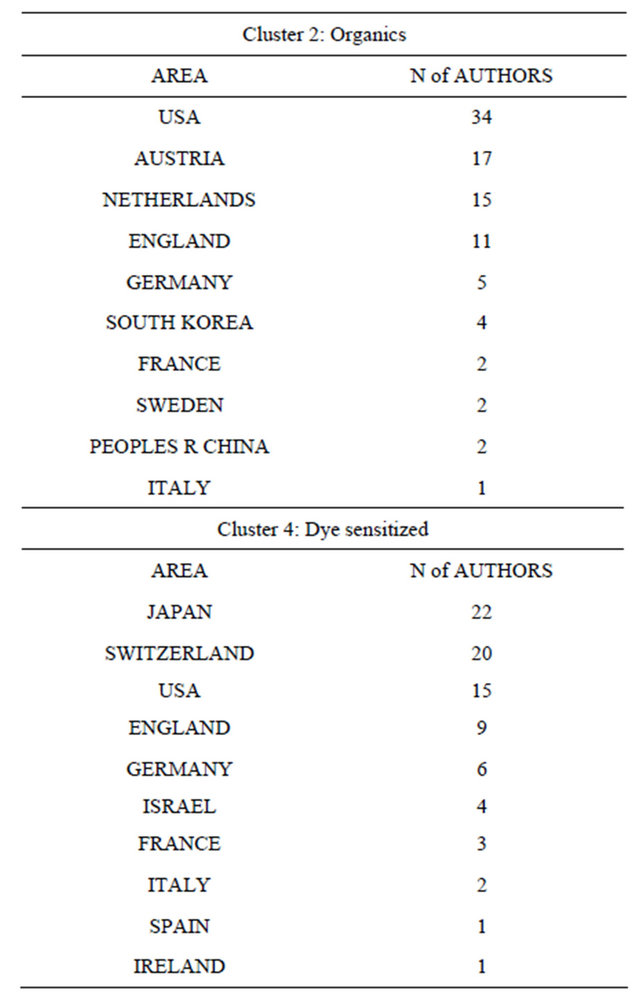
We also checked the quality of papers. First of all, we identified top 50 highly cited papers in each cluster. Then we counted the number of the counties to institute which co-authors belong to (“co-institute”) of top 50 papers belongs (see Table 2). If two co-institutes of one paper belong to the Japanese institutions, we counted two points for Japan. As a result, USA dominated the reputetion of academic research in the field of organics (cluster 2). Austria, Netherland and UK show a position second only to USA. Japan and Switzerland enjoy high reputetion in the field of dye-sensitized (cluster 4). None of Asian economies except Japan are included the list of coinstitutes of highly cited papers. With the respect to the quality and reputation of the study, these facts indicate that a large room for improvement remains in Asian economies.
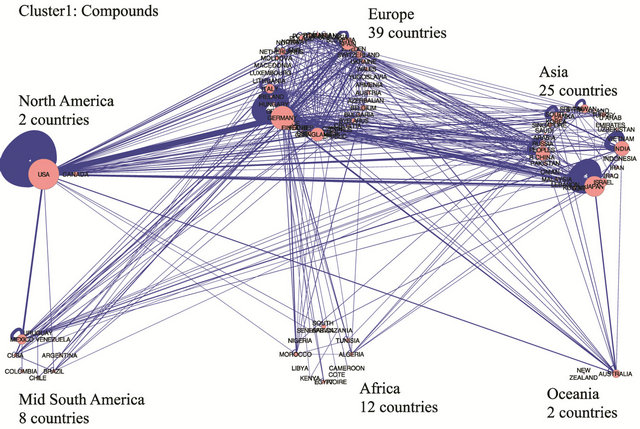
Then we move to the analysis related to the research network diagram which reveals the structure of scientific cross-border collaboration. Figures 6(a)-(d) show visualized patterns of international collaboration of each cluster. It indicates that collaborative researches among three areas, Europe, USA and Asia, have become popular. In the clusters of silicon and compound solar cells, the international collaborations are mostly conducted among the advanced areas. The number of collaborative researches between USA and Germany is 179, which is the highest. Germany plays the role of a hub area for the international collaboration. It also plays the same role in the cluster of organics. Other than Germany, there are 73 collaborative researches between the USA and South Korea. In the cluster of dye-sensitive cells, in contrast, the number of international collaborations is not very high and the researches are less globalized. The number
Table 2. Number of authors in Top 50 papers.
 (a)
(a)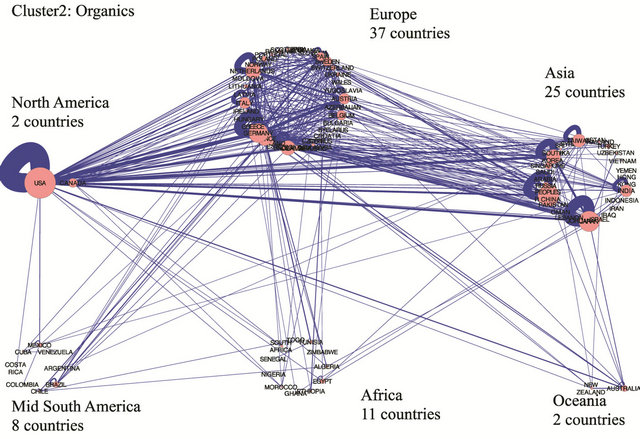 (b)
(b)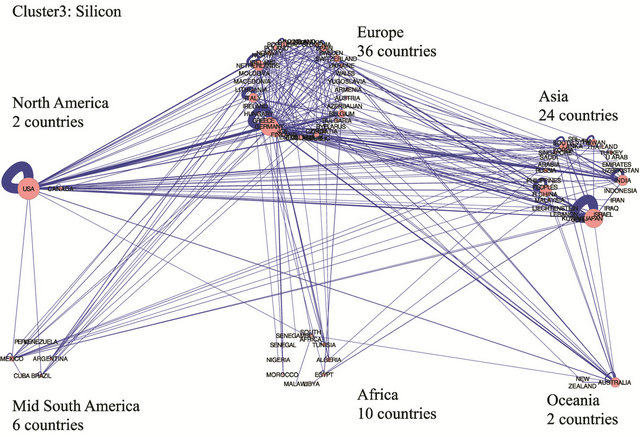 (c)
(c)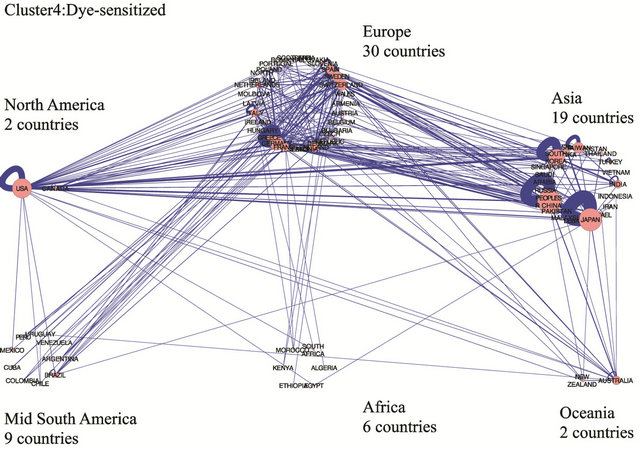 (d)
(d)
Figure 6. (a) Research network diagram (Cluster1: Compounds); (b) Research network diagram (Cluster2: Organics); (c) Research network diagram (Cluster3: Silicon); (d) Research network diagram (Cluster4: Dye-sensitized).
of international collaborations is highest (62) between China and Japan. Also, that between Germany and Switzerland is 39 and that between Switzerland and England is 34. For Asian areas, we see that China has many collaborative researches with Japan in the cluster of dyesensitized cells, Korea with the USA in the cluster of organics, and India with France in the cluster of silicon cells.
4. Discussion
The major cause for the technological progress in developing economies is considered to be the technology transfer through the following five paths in the development policy: licensing, foreign direct investment, technology transfer through ODA, trade in goods and services, and the circulation of skilled labors. In fact, the rapid growth of the silicon solar cell industry in China was supported by the international trade of manufacturing equipment and the hiring of top level managers trained in industrialized economies [6,23]. The result of our analysis on the solar cells showed that not only the absorption of the knowledge from the advanced economies, but also independent development in the science enhanced the competitiveness of the Asian economies in the next-generation fields such as organics or dye-sensitized solar cells. For organics and dye-sensitized solar cells, but not for silicon cells, the Asian economies would conduct independent development of production facilities and materials based on the academic knowledge and realize domestic production in the entire line from the upstream to the downstream even at the early stage of the commercialization.
It is currently difficult to earn a profit in the downstream production lines which include cell and module production of silicon solar cells because of the severe market competition as well as the shrinking of the European market. Expected additional value created in the downstream production lines of organics and dye-sensitized solar cells is becoming smaller and the precision production equipment and materials (i.e. upstream of the production lines) are becoming more important. China, Taiwan, and South Korea could strengthen the academic researches and international collaborations in the emerging fields, responding to the change in the profit structure. To ensure a first mover advantage through active scientific activities has become more essential. Another factor is the growing dependence of the industrial technologies on the science, namely the strengthening of the science linkage. Science linkage of solar cell would greatly exceed that of automobile and electronics. This possibility was indicated for organics and dye-sensitized solar cells [24]. These areas could make large investments in the science in the emerging fields, considering that the science would affect future industrial competitiveness in the production of organics and dye-sensitized solar cells more significantly than in the production of silicon solar cells. In the background, there is an aggressive policy intervention. Typical examples include Mid-term Development Plan for Renewable Energy (China), the Renewable Energy Law (China), the Renewable Energy Development Act (Taiwan) and Renewable Energy Plan (South Korea). Unlike these economies, India employs a different strategy, conducting researches for both matured technologies and emerging technologies in a balanced manner. China and Taiwan have large domestic production sites, but India does not. India, as a promising market to utilize the solar cell technologies, requires a wide knowledge. Thus, the difference in the industrial policy for solar cells seems connected to the difference in the emphasis on the academic researches. Although the policies of the Asian economies on renewable energies including solar power generation have been studied in many researches [6,23,25,26], there are few researches on the difference in the policies for different types of solar cells or on the investment strategies. Our method has made it possible to presume a hidden policy intention and major investment targets in the science and technology strategy.
An eye on the outside of Asia, dense co-authorship relations of solar cell research between organizations in Europeare identified. Even though the scientific and technological capabilities have increased in Asian countries, EU economies still work as a hub for the international collaboration.It is likely that this is aided by policies in Europe. Solar cell research has been mostly funded by the fifth and sixth EU framework programs (FP5, FP6) whose purpose is to promoteinternational research collaborations. A human network such as PV European Research Area Network may also contribute to it.
5. Conclusion
It is widely accepted that scientific research provides a fundamental basis for technology-oriented innovations. Scientists create the seeds of innovation, companies take up these seeds develop technologies, and then industrialize. Although such a linear model is often criticized, technological inventions tend to be strongly connected to material in scientific outputs [27]. As the innovation cycle shortens, the linkage between technology and basic science is increasing [28,29]. We used the bibliometrics to examine the possibility of a new development policy model taking account of the change of the innovation model. We finally showed that scientific catch-up processes could be observed in Asia. Even though a large room for the improvement of paper quality remains, China, Taiwan, and South Korea would compete with USA, Germany, and Japan in not only the production but also the science of the next-generation solar cells. This concept is called the “parallel-running-type model”. Responding to the changes in development model, we have to re-design the framework of economic cooperation. There is a need for further horizontal collaboration among major Asian economies and developed economies to develop more efficient and high quality products and to address global sustainability issues. In the light of European experience, establishment of research fund for the purpose of international collaboration and formation of human network could be effective. In an attempt to relate, the “Open Innovation Platform Initiative” has just started in APEC. At the first conference of this initiative held in Singapore (April 4-5, 2012), delegates from APEC economies discussed the scope of absorptive capacity as well as the way of cooperation. We hope that this initiative will promote international collaboration for basic researches among the USA, Japan and major Asian economies and develop a framework, through the collaboration of these economies, for the absorptive capability building of the least developed economies.
6. Acknowledgement
One of the Authors (Ichiro Sakata) was partially supported by the Ministry of Education, Science, Sports and Culture, Grant-in-aid for Scientific Research (B), 24310109, 2012.
REFERENCES
- World Bank, “The East Asian Miracle: Economic Growth and Public Policy,” World Bank Policy Research Report, 1993.
- J. A. Mathews, “Enhancing the Role of Universities in Building National Innovative Capacity in Asia,” World Development, Vol. 35, No. 6, 2007, pp. 1005-1020. doi:10.1016/j.worlddev.2006.05.012
- T. Altenburg, H. Hubert and A. Stamm, “Breakthrough? China’s and India’s Transition from Production and Innovation,” World Development, Vol. 36, No. 2, 2008, pp. 325-344. doi:10.1016/j.worlddev.2007.06.011
- C. Kenny, “What’s Not Converging? East Asia’s Relative Performance in Income, Health and Education,” Asian Economic Policy Review, Vol. 3, No. 1, 2008, pp. 19-37. doi:10.1111/j.1748-3131.2008.00084.x
- F. Berkhout, D. Angel and A. J. Wieczorek, “Asian Development Pathways and Sustainable Socio-Technical Regimes,” Technological Forecasting and Social Change, Vol. 76, No. 2, 2009, pp. 218-228. doi:10.1016/j.techfore.2008.03.017
- A. Tour, M. Glachant and Y. Meniere, “Innovation and International Technology Transfer: The Case of the Chinese Photovoltaic Industry,” Energy Policy, Vol. 39, No. 2, 2011, pp. 761-770. doi:10.1016/j.enpol.2010.10.050
- Y. H. Lee and M. Y. Cheng, “Catching-Up and Technological Progress of the ASEAN Economies,” Pacific Economic Review, Vol. 16, No. 2, 2011, pp. 236-254. doi:10.1016/j.enpol.2010.10.050
- M. C. Hu, “Technological Innovation Capabilities in the Thin Film Transistor-Liquid Crystal Display Industries of Japan, Korea, and Taiwan,” Research Policy, Vol. 41, No. 3, 2012, pp. 541-555. doi:10.1016/j.respol.2011.10.013
- S. L. Jang, S. Lo and W. H. Chang, “How Do Latecomers Catch up with Forerunners? Analysis of Patent and Patent Citations in the Field of Flat Panel Display Technologies,” Scientometrics, Vol. 79, No. 3, 2009, pp. 563-591. doi:10.1007/s11192-007-2032-1
- G. linden, J. Hart, S. A. Lenway and T. P. Murtha, “Flying Geese as Moving Target: Are Korea and Taiwan Catching up with Japan in Advanced Displays?” Industry and Innovation, Vol. 5, No. 1, 1998, pp. 11-34. doi:10.1080/13662719800000002
- A. Schrank, “Foreign Investors, Flying Geese, and the Limits to Export-Led Industrialization in the Dominican Republic,” Theory and Society, Vol. 32, No. 4, 2003, pp. 415-443. doi:10.1023/A:1025554808570
- I. Sakata, H. Sasaki, N. Nakamura and Y. Kajikawa, “Maps of International Research Collaboration Inrenewable Energy,” Proceedings of the 6th Dubrovnik Conference on Sustainable Development of Energy, Water and Environment Systems, Dubrovnik, 25-29 September 2011.
- P. Hennick and M. Fischedick, “Towards Sustainable Energy Systems: The Related Role of Hydrogen,” Energy Policy, Vol. 34, No. 11, 2006, pp. 1260-1270. doi:10.1016/j.enpol.2005.12.016
- N. Shibata, Y. Kajikawa, Y. Takeda and K. Matsushima, “Comparative Study on Methods of Detecting Research Fronts Using Different Types of Citation,” Journal of the American Society for Information Science and Technology, Vol. 60, No. 3, 2009, pp. 571-580. doi:10.1002/asi.20994
- M. E. J. Newman, “Fast Algorithm for Detecting Community Structure in Networks,” Physical Review, Vol. 69, No. 6, 2004, p. 66133.
- A. T. Adai, S. V. Date, S. Wieland and E. M. Marcotte, “Creating a Map of Protein Function with an Algorithm for Visualizing Very Large Biological Networks,” Journal of Molecular Biology, Vol. 340, No. 1, 2004, pp. 179- 190. doi:10.1016/j.jmb.2004.04.047
- F. Narin, K. Stevens and E. S. Whitlow, “Scientific CoOperation in Europe and the Citation of Multinationally Authored Papers,” Scientometrics, Vol. 21, No. 3, 1991, pp. 313-323. doi:10.1007/BF02093973
- H. F. Moed, R. E. Bruin, A. J. Nederhof and R. J. W. Tijssen, “International Scientific Co-Operation and Awareness within the European Community: Problems and Perspectives,” Scientometrics, Vol. 21, No. 3, 1991, pp. 291- 311. doi:10.1007/BF02093972
- W. Glanzel, “National Characteristics in International Scientific Co-Authorship Relations,” Scientometrics, Vol. 51, No. 1, 2001, pp. 69-115. doi:10.1023/A:1010512628145
- B. Stefaniak, “International Co-Operation in Science and in Social Sciences as Reflected in Multinational Papers Indexed in SCI and SSCI,” Scientometrics, Vol. 52, No. 2, pp. 193-210. doi:10.1023/A:1017959605687
- J. Hoekman, K. Frenken and R. J. W. Tijssen, “Research Collaboration at a Distance: Changing Spatial Patterns of Scientific Collaboration within Europe,” Research Policy, Vol. 39, No. 5, 2010, pp. 662-673. doi:10.1016/j.respol.2010.01.012
- J. S. Katzand and B. R. Martin, “What is Research Collaboration?” Research Policy, Vol. 26, No. 1, 1997, pp. 1-18. doi:10.1016/S0048-7333(96)00917-1
- H. Yang, H. Wang, Y. H. Yu, J. Xi, R. Cui and G. Chen, “Status of Photovoltaic Industry in China,” Energy Policy, Vol. 31, No. 8, 2003, pp. 703-707. doi:10.1016/S0301-4215(02)00121-0
- Q. Chaiand and X. Zhang, “Technologies and Policies for the Transition to a Sustainable Energy System in China,” Energy, Vol. 35, No. 10, 2010, pp. 3995-4002. doi:10.1016/j.energy.2010.04.033
- A. Kumar, K. Kumar, N. Kaushik, S. Sharma and S. Morshra, “Renewable Energy in India: Current Status and Future Potentials,” Renewable and Sustainable Energy Reviews, Vol. 14, No. 8, 2010, pp. 2434-2442. doi:10.1016/j.rser.2010.04.003
- L. Fleming and O. Sorenson, “Science as a Map in Technological Search,” Strategic Management Journal, Vol. 25, No. 8-9, 2004, pp. 909-928. doi:10.1002/smj.384
- F. Narin, K. Hamilton and D. Olivastro, “The Increasing Linkage between U.S. Technology and Public Science,” Research Policy, Vol. 26, No. 3, 1997, pp. 317-330. doi:10.1016/S0048-7333(97)00013-9
- F. Narin and D. Olivastro, “Status Report: Linkage between Technology and Science,” Research Policy, Vol. 21, No. 3, 1992, pp. 237-249. doi:10.1016/0048-7333(92)90018-Y