Natural Resources
Vol.4 No.2(2013), Article ID:32900,5 pages DOI:10.4236/nr.2013.42024
Prediction of Suitable Harvest Time in Aquaculture
![]()
1Jiangsu Provincial Meteorological Bureau, Nanjing, China; 2Yancheng Meteorological Bureau, Yancheng, China; 3Haian Meteorological Bureau, Haian, China.
Email: *jsqxszt@126.com
Copyright © 2013 Zhaotang Shang et al. This is an open access article distributed under the Creative Commons Attribution License, which permits unrestricted use, distribution, and reproduction in any medium, provided the original work is properly cited.
Received October 3rd, 2012; revised March 2nd, 2013; accepted March 18th, 2013
Keywords: Aquaculture; Breeding; Harvest; Prediction
ABSTRACT
A model is provided to predict the prawn’s harvest in aquaculture through analytical research in agrometeorology, mathematical statistics, synoptic meteorology and et al. It is found out that the Benefit Analysis of the Best Harvest is one of the most ideal ways. The models for the breeding objects, climate prediction and analysis of market quotation should be set up and perfected continuously. Only when the dynamic numerical simulation of the growth is accurate and the short-term weather forecast and the market quotation are reliable, will the suitable harvest time be predicted precisely. We used to write this paper with the foundation on ideologies.
1. Introduction
The Harvest, an old topic, originally refers to the ripe crops. The harvest date is the time to harvest, it is decided by crops’ ripeness, purpose and climatic condition usually. The harvest time and the crops life stop time are not synchronous, because people want to get ideal production with harvest. e.g., there’s an old saying, the wheat has ninety percent ripeness, has a hundred percent ripeness, when harvest is most ideal on close to mature, the problem is that how much is it close to the degree. Different experts carry out the system analysis for crops harvest from different angles. e.g., results have that the wheat’s best harvest time is when wheat’s two leaves and 3/4 boot leaves turned yellow from different perspectives [1], and so on. Many experts carry out the system analysis for the suitable harvest time about a different crop from morphology or output [2,3]. Peoples considered meteorological conditions, especially to note disaster weather effect on harvest dates [4,5]. Also, peoples take that climatic change would have effect on harvest dates [6]. It is believed that the warmer is the climate, the quicker is the growing progress, then harvest dates bring forward. The growth model was established, and it was used to predict harvest [7] and et al. At present, many researchers also work on the relationship of crops output, quality and their harvest in China, but few on the harvest of aquaculture and much less on the economic benefit side. However, it’s very common to see the scenes of good yield, bad harvest or harvest with a deficit. Harvest, the missing point, is the purpose of both the society and experts.
The main structure goes with three steps: 1) set up the model formula; 2) analyze the data to set up a better model; 3) use the model to predict in a real case (Yancheng city Prawn’s breeding). Calculation of the contribution rate, accumulated contribution rate and Feature Vector Vkl is also provided to ourselves and other researchers for future study in Tables 1 and 2.
2. Materials & methods
2.1. The Source of the Data
The materials of testing breeding are used primary on this paper in the coastal area of Jiangsu province of China. Jiangsu investigated and surveyed materials are used as auxiliary ones. It was analyzed with the examples as that the Prawn’s breeding is studied in Yancheng city in Jiangsu provincial coastal area of China.
The meteorological data about Jiangsu provincial coastal area is from eight meteorological observatories in the near seaside: Ganyu, Xilian Island, Yanwei Harbor, Sheyang, Dafeng, Rudong, Lvsi and Qidong. Observe dates span from Jan. 1st 1970 to Dec. 31st 2006. These data represented coastal climate in Jiangsu province, they have been analyzed according to both time and space in this paper.
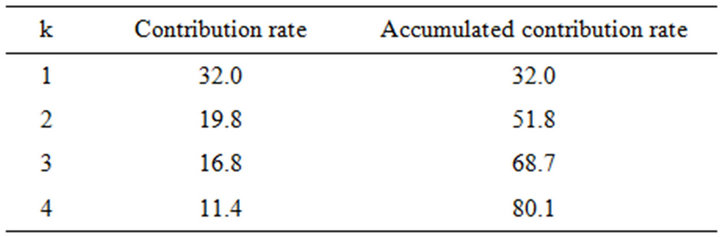
Table 1. The contribution rate and accumulated contribution rate.
2.2. Design the Dynamic Benefit Calculation Formula
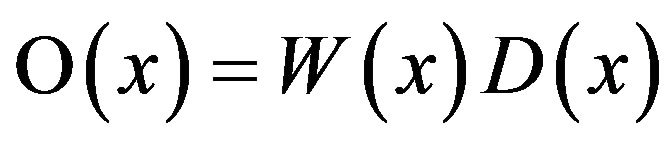
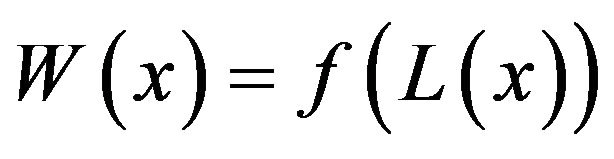
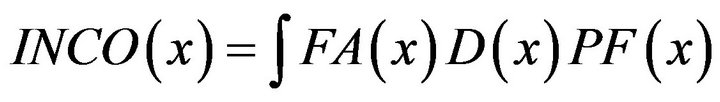
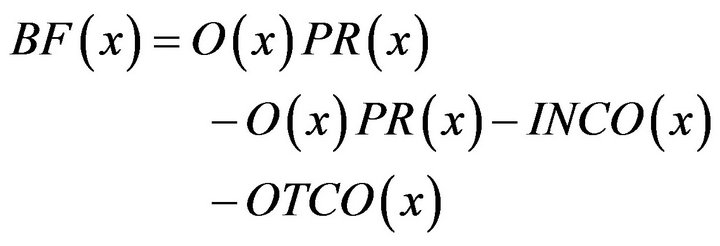
It is created that the per unit area dynamic benefit function about breeding x days is BF(x), the density is D(x), the body length is L(x), the body weight is W(x), the yield per unit area is O(x), the sales price per unit is PR(x), single feed amount is FA(x), the per unit market price on feed is PF(x), whole increased on breeding feed costs is INCO(x), other cost is OTCO(x). Then functions can be written down as formulas:
 (1)
(1)
 (2)
(2)
 (3)
(3)
 (4)
(4)
2.3. Design the Integrated Harvest Decision-Making Formula
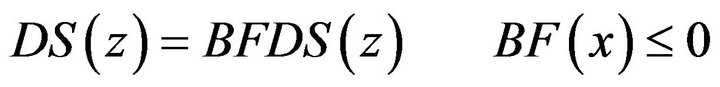
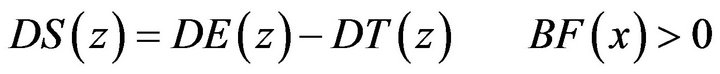
The date serial number of suitable harvest dates was set as DS(z), the deadline date serial number of suitable breeding on meteorological condition is DE(z), harvest to need time is DT(z), when the date serial number on BF(x) ≤ 0 is BFDS(z). Then:
 (5)
(5)
 (6)
(6)
2.4. Prediction on the Deadline Date Serial Number with Suitable Breeding on Meteorological Condition
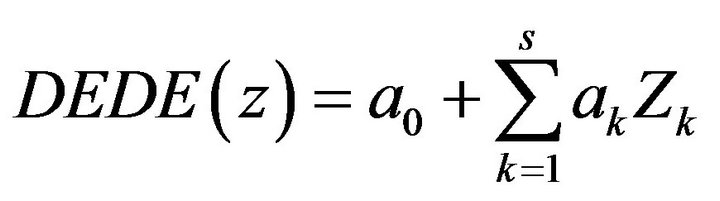
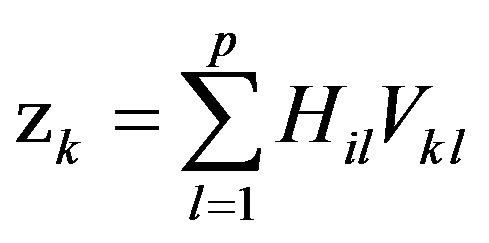
As to predict date serial number, there has many ways and has long and short time limitation. It is need on medium and long term forecast for breeding, it is a sort climatic trendy forecast. The breeding enterprises often care the deviation degrees from an average year, therefore, we choose the monthly average data on 500 hPa, and use the EOF method to analyze and discuss.
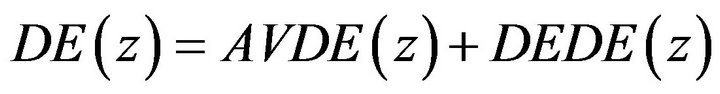
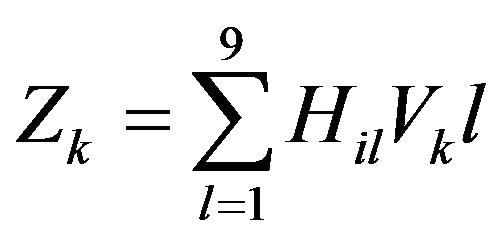
The EOF is a method to decompose the meteorological variable into the sum of two parts product of the space function (V) and time function (T): X = VT. Therefore, the typical orthogonal function is decomposed on eigenvectors with eigenvalues of the covariance matrix for all point of meteorological elements, it was decomposed about accuracy on selecting sum of typical eigenvalues [8]. The average value of deadline date serial number of suitable breeding is AVDE(z), the deviation degree is DEDE(z), to select the NCEP 2.5˚ × 2.5˚ grid. Setting Years’ monthly average atmosphere pressure of January at 500 hPa height as Hil, to calculate the relation monthly p, to have s kinds mainly eigenvectors as Vk1. Then:
 (7)
(7)
 (8)
(8)
 (9)
(9)
3. Results and Analysis
3.1. The relation between Prawns’ Length and Weight
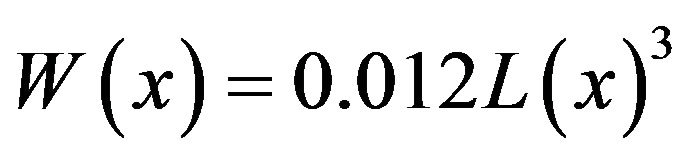 (10)
(10)
the above formula shows the relations between the length and weight of Prawns’ [9]. It was found that is significant on theory and actual value by calculation about tenth formula with texting data, must, which is corrected to use texting data (Table 3), after it is corrected as below:
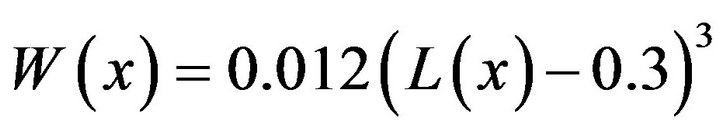 (11)
(11)
3.2. The Relationship between Body Weight and Length and Throwing Feed Amounts
Statistics with texting data suggest that the relationship between the amounts of ingestion of single Prawn IA(x)
(unit: g) and weight W(x) is as below:
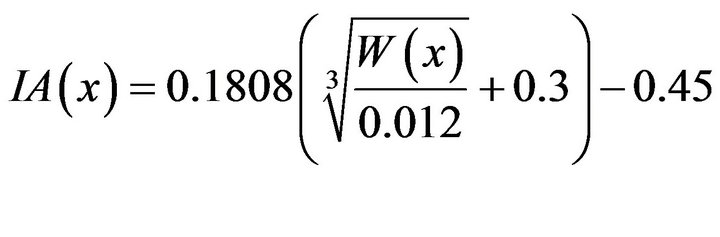 (12)
(12)
and if you put eleventh formula in twelfth formula, you immediately get thirteenth formula.
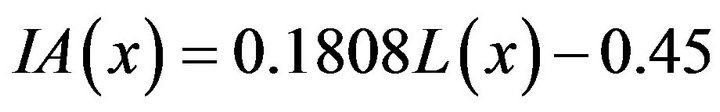 (13)
(13)
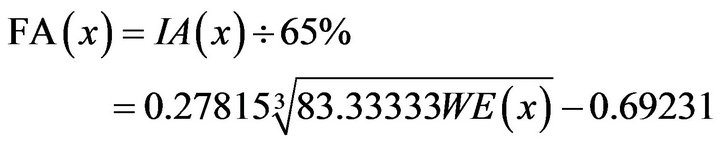
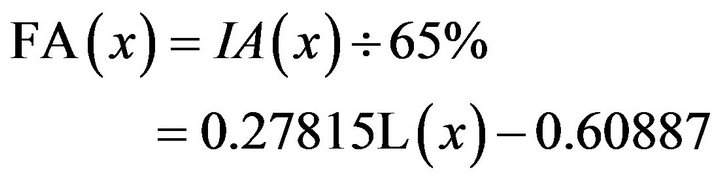
the formula (13) shows a linear relationship between Chinese prawns’ the amounts of ingestion of single Prawn and weight, Wanted to increase body length and specification, must to increase investment, and will increase breeding risk.
The statistics showed that every prawn eats only 65%
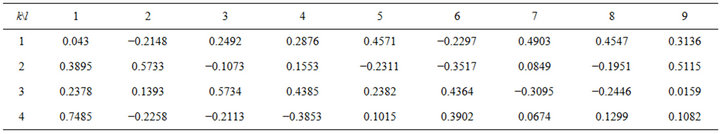
Table 2. Feature vector Vkl.
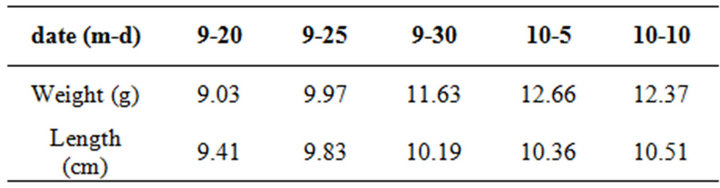
Table 3. Data of observing about prawns body length and weight in different dates.
breeding feedstuff, so we’ll calculate with two formulas below:
 (14)
(14)
 (15)
(15)
3.3. Calculation Method of Dynamic Benefit
The worker wages and consumed devices are fixed value in short time for the special breeding enterprise, and it is lower relation with times, it can be ignored. Mainly the body length is measured in breeding period of prawn. It is same on breeding prawn and fish, the density of prawn is reduced sync with time to move forward, sometimes it is linearly reduced, thus, to set n as the breeding days, to set Equations (11) and (12) into Equation (15), then we can get:
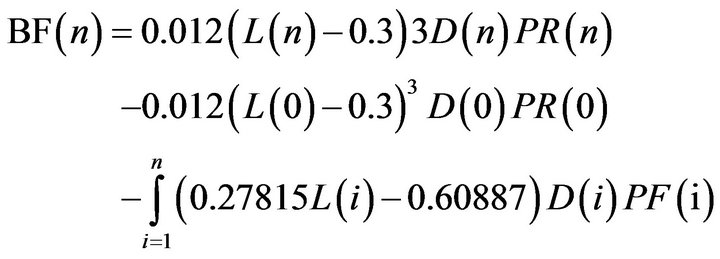 (16)
(16)
it is can calculate into breeding n days benefit from Equation (16). We must decide the order for BF(n) when it has z breeding ponds, which to set the order of harvesting date with BF(n) from small to large.
3.4. The Way of Deciding Deeded Time on Harvest
There are two managing ways after the prawns were harvested, it is refrigeration or transportation to the market for selling by being in water with added oxygen.
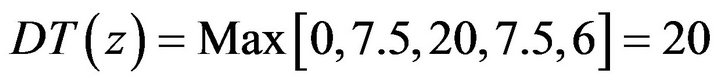
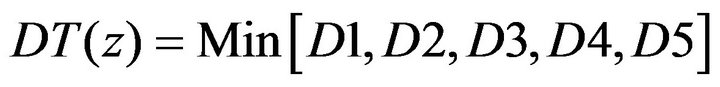
1) Refrigeration Harvested prawns must be kept fresh within 24 hours. So the determination definite harvesting dates must consider the culturists’ cold storage and quick-freeze capacity, every day worker’s dealing with ability, catching and transportation ability. Set deeding days is the refrigerator’s turnover period as D1, quick freeze as D2, the refrigerator’s worker to deal with the prawns as D3, catching as D4, transportation as D5, DT(z) shows below accordingly:
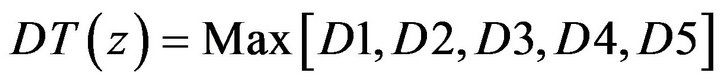 (17)
(17)
there are 26 refrigerators with a total capacity of 5107 tons, daily quick-freeze capacity of 40 tons, dealing with capacity of 15 tons, catching ability of 40 tons and transportation capacity of 50 tons. There are the annual harvesting prawn’s amounts below 3000 tons.
Where D1 = 0, D2 = 3000/40 = 7.5, D3 = 3000/15 = 20, D4 = 3000/40 = 7.5, D5 = 3000/50 = 6,
 (18)
(18)
therefore, it is be harvested to need about twenty days. Shorter is the whole harvest time, better is to increase the ability of preventing market risk. So:
 . In view of improving quick-freeze ability, it requires to increase great investment, it is ideal way that D3 = D4 = D5 = D2 through to increase workers’ ability of dealing and catching for most profit.
2) Transportation with prawns alive It should be transported with fresh alive, necessary measures must be taken after prawns being caught within one hour after the harvest moment. The exact date of prawn’s harvest is determined by abilities of catching, transport and market sale with fresh alive.
It needs days to set catching as D6, transportation as D7 and sale as D8, then:
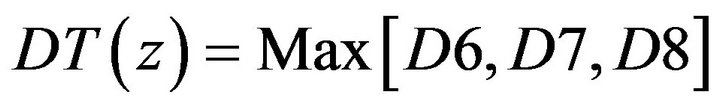 (19)
(19)
where Yancheng’s prawns sale market is two for Nanjing and Shanghai city, e.g. in 2010 year, 3 tons (1.5 tons each) prawns are sold in Nanjing and Shanghai city every day, one specially truck can transport 5 tons, the daily catching ability is 6 tons, also transportation to Nanjing and Shanghai city needs different trucks, and one day sets a truck, after calculation, D7 = 1, D6 = 5/1.5 ≈ 4, D5 = 5/6 ≈ 1. Then:
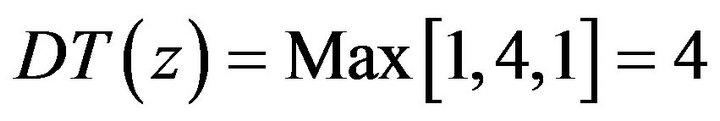 (20)
(20)
sometime, prawns were sold with fresh alive or after treated, then, it is calculated must to consider the relationship between. Market has a great effect on fresh prawn selling but prawns to be sold after dealing are relatively stable. The dynamic relationship should be mastered to assure the overall improvement of the aquaculture benefit.
3.5. The Climatic Analysis and Forecast on the Suitable Harvest
The sea shrimps live in the sea, the sea temperature is the key index that decides one kind living things’ converting on growth stage and growth speed, therefore, the best harvest date is decided mainly by the temperature target. The prawn lives mainly in the Yellow Sea in China and Bohai Sea, as well as in the Korea’s west coastal area. Liaoning, Hebei, is the main origin of Lianoning, Shangdong and Tianjin provincial coastal sea. The aquiculture prawn suitable water temperature is 16.0˚C - 30.5˚C, 22.0˚C - 25.0˚C is best ideal to breed the prawn. Based on the relationship between average daily sea temperature with the deep of 60 cm in Jiangsu provincial coastal pond and air temperature to near meteorological observations in the west part [10]. The water temperature 16.0˚C appeared in May and October, when air temperature is calculated about 4.0˚C. Then at the beginning of the day and the time between all day long for the average daily temperature steadily above 14.0˚C is breed Prawn’s stage (Table 4), to set the order of ending of the average daily temperature steadily above 14.0˚C as DE(z). According to some statistics, the steadily harvest time is from first third of Oct to middle third of Nov. e.g. It is created on forecasting model for be Sheyang county located offshore the middle coast of Jiangsu province, it showed high correlation months (Table 5) and the contribution rate of be above 70% (Table 1).
Used linear regression method, the formula is built as:
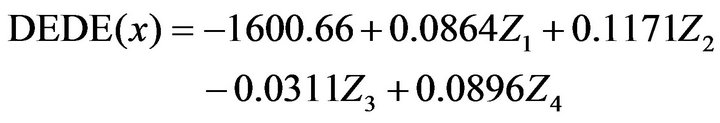 (21)
(21)
the above Zk sets as the following equation and feature Vector Vkl(Table 2).
 (22)
(22)
set the errors ±2 d and trend same is accurate, according to calculate the trend accuracy rate. It showed the accurate rate is 10/17 ≈ 59%, trend growth rate is 13/17 ≈
76%. In 2008-2010’s probation, the accurate rate is 2/3 ≈ 67%, trend growth rate is 3/3 ≈ 100% on be return plug data during 1991-2007.
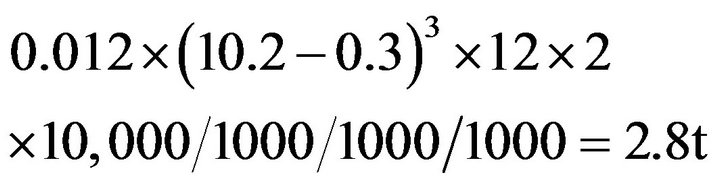
e.g. In 2010, the No. 3 pond in Xiangshui county Yancheng city was 2 hm2; on Oct. 10 2010, the density was 12 prawns per square meter with the average length of 10.2 cm; the prawns price was 50 yuan per kg and the feed price was 6 yuan per kg (0.0006 yuan/g). The immediate predictions for Oct. 20: the density was 11.6 prawns per square meter with the average length of 10.6 cm, the market selling price was 60 yuan per kg (0.006 yuan/g). The feed price does not change, to set the body length increase linearly, the density reduces linearly, market price changes linearly, therefore, to calculate the formula as result:
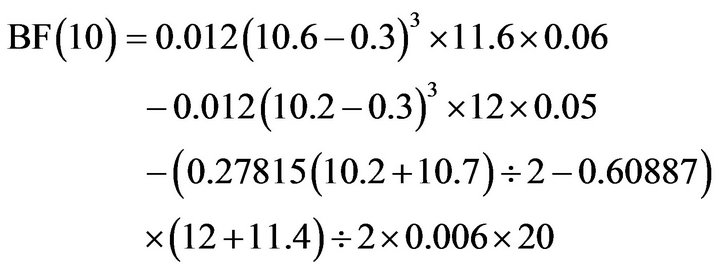 (23)
(23)
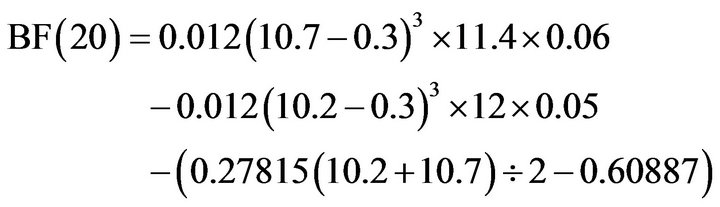 (24)
(24)
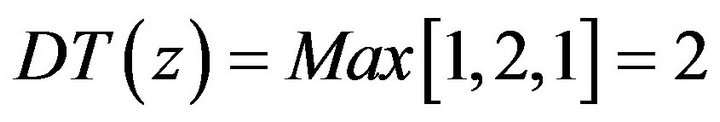
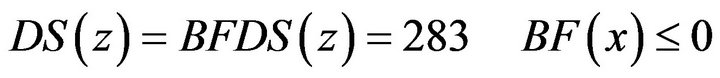
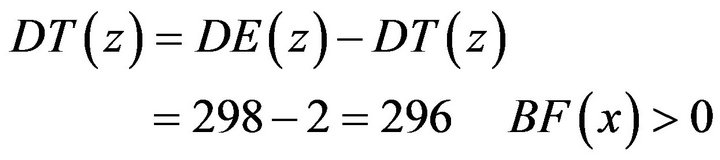
used formulas (23) and (24) to calculate, BF(10) = 0.23241, BF(20) = −0.97938. The benefit is negative during the period, when BFDS(3)=283, Predicted out DEDE(3) − 2, DE(3) = 300 − 2 = 298. The output on Oct. 10 was:
if to take selling alive method, then:
D7 = 1, D6 = 2.8/1.5 ≈ 2, D5 = 2.8/6 ≈ 1, then:
 (25)
(25)
 (26)
(26)
 (27)
(27)
so, the catch should begin at Oct. 10. Even if ignoring the cost, the prawns should be caught no later than Oct. 23rd. In the real case, the catch was arranged at Oct. 10 and gained a well profit.
4. Conclusions and Discussion
The goal of aquaculture is to gain the economic benefit, it is not only to relate the growing speed of the aquatic products but also to relate the selling price in the market, the dynamic breeding cost as mainly feed cost, land’s rent and employees’ salaries are relatively constant. For a
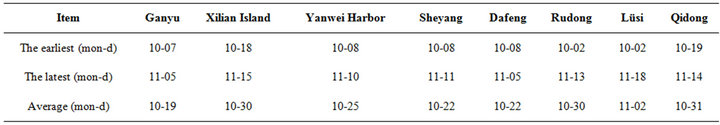
Table 4. Information about the average daily temperature steadily above 14.0˚C.
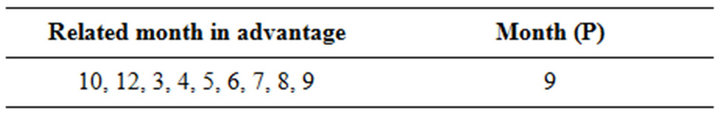
Table 5. Related month in advantage.
certain culturist, market price is determined by the supply and demand relation, oneself can not decide the relationship. It is an important approach on the best profit that supply demand is not balanced by the aircraft.
Some aquatic products are very sensitive with climatic condition, some are not. Some areas are well to breed aquatic products through all the years, but most of areas are not. Therefore, the harvest date decided must consider the conditionality of climatic condition, end time is not blind to prolong, otherwise a great loss comes along with the meteorological disaster.
The predict error interval of the model itself must be taken into consideration before calculating a dynamic benefit to predict the days of having suitable weather. A fault-tolerant interval should be made to decrease the fault possibilities from prediction interval. Long-term predications (over a whole month), middle-term predictions (20 - 30 days) and short-term predictions (5 - 10 days) should all be considered to make a scientific harvest plan, esp. the long-term market trend analyzed must strengthen and make scientific harvest plan, but when the concrete plan is implemented, it must combine with the short-term predictions, in order to consider the likely impact on weather. It is gotten fertility and foison and high yield and high efficient along with a scientific harvest date.
5. Acknowledgements
This work was funded by the National Special Research Fund for Public Welfare (Meteorology) of China (GY HY201006029) (Meteorological Key Technology for Aquaculture) and Jiangsu province Meteorological Scientific Research Open Fund (ZD201108) (Application of Meteorological Key Technology for Aquaculture).
REFERENCES
- J. P. Yuan, C. Y. Wang, S. J. Gao, K. J. Li and X. L. Sun, “Study on Wheat Kernel Formation and Morphology of Optimum Harvest Period,” Journal of Henan Agricultural University, Vol. 30, No. 4, 1996, pp. 324-328.
- Q. L. Zhang, D. Q. Dong, X. Y. Guo and H. Z. Wei, “The Best Harvest for Crops,” Chinese Seed Industry, Vol. 10, 2002, p. 41.
- Y. G. Liu, D. S. Zhang and H. M. Zhou, “Research on the Best Harvest for Summer Corn in Henan,” China Agricultural Technology Extension, Vol. 26, No. 2, 2010, p. 22.
- Q. D. Liu, “The Effect of Sever Weather during the Harvest on the Seed Quality,” Henan Agriculture, Vol. 1, No. 4, 2010, p. 1.
- M. S. Jiang, Z. T. Shang, S. C. Tian, S. L. Cai, Y. P. Wang and R. S. Li, “Analys Is and Forecast on Hothouse Inbound Date of Female Prawn in Coastlands of Jiangsu,” Journal of Nanjing Institute of Meteorology, Vol. 23, No. 3, 2000, pp. 440-444.
- J. S. Duan, “Effect of Climate Warming on Mature Date of Winter Wheat and Forecast of Harvest in Eastern Gansu Province,” Agricultural Research in the Arid Areas, Vol. 25, No. 1, 2007, pp. 158-161.
- Z. Q. Yang, W. H. Luo, f. D. Chen, J. J. Gu, X. M. Li, Q. F. Ding, C. B. Zhao and Y. F. Lu, “A Simulation Model for Predicting the Development Stage and Harvesting Date of Standard Cut Chrysanthemum in Greenhouse,” Scientia Agricultura Sinica, Vol. 40, No. 6, 2007, pp. 1229-1235.
- Y. Gu, “The Analysis of EOF in 500hPa in July during 1948-2005,” Inner Mongolia Meteorology, Vol. 1, 2010, pp. 4-6.
- Z. T. Shang, M. S. Jiang and H. B. Tang, “Aquaculture and Meteorology,” Meteorology Press, Beijing, 2008, p. 45.
- C. L. Ji and G. H. Chen, “New Technology on Chinese Prawn Breeding,” Jin Zhi Press, Beijing, 1989, p. 148.
NOTES
*Corresponding author.