Open Journal of Anesthesiology
Vol.3 No.5(2013), Article ID:34946,5 pages DOI:10.4236/ojanes.2013.35062
A Survey of Non-Monetary Institutional Infrastructural Support of Academic Anesthesia Departments in the United States
![]()
1Department of Anesthesia, UMDNJ-Robert Wood Johnson Medical School, New Brunswick, USA; 2Department of Anesthesia, SUNY at Stony Brook, School of Medicine, Stony Brook, New York, USA; 3Department of Statistics & Biostatistics, Institute for Health, Health Care Policy, and Aging Research, Rutgers University, New Brunswick, USA.
Email: *stevenginz@gmail.com
Copyright © 2013 Steven H. Ginsberg et al. This is an open access article distributed under the Creative Commons Attribution License, which permits unrestricted use, distribution, and reproduction in any medium, provided the original work is properly cited.
Received March 1st, 2013; revised May 16th, 2013; accepted July 1st, 2013
Keywords: Non Monetary Support; Infrastructural Support; Anesthesia Sites
ABSTRACT
Financial pressure of multifactorial etiology promises to create new obstacles for academic anesthesia departments. Integrating the priorities of the academic and clinical mission of the anesthesia department, the medical school, and the university hospital will require that anesthesia departments operate with maximal operational efficiency. Maintenance or expansion of institutional infrastructural support of the university anesthesia department will be necessary to achieve operational efficiencies, and to ensure that the safety of our patients is in no way compromised by financial concerns. Previous studies have documented increasing need for monetary institutional supports of academic anesthesia departments [1]. The purpose of this study is to delineate non-monetary institutional support afforded to academic anesthesia departments by their University Hospitals. After IRB approval, we electronically solicited the response to a 63 question survey (43 of which were used for the present study) from all 133 chairpersons of academic anesthesia departments in the United States. The remaining 20 questions were unrelated to the topics presented in this manuscript. 62 responded electronically, for an overall response rate of 46.6%. This study establishes the current state of infrastructural support afforded to academic anesthesia departments in the United States.
1. Introduction
A confluence of negative economic events has recently challenged the global economy and the healthcare industry. The present recession is the worst one since the great depression of the 1930s. Previous studies have documented an increased requirement for financial support of academic anesthesia departments from their Medical Schools and University Hospitals [1].
The safe clinical management and operational efficiency of an academic anesthesia department is greatly influenced by the non-monetary support that it receives from the University Hospital with which it is affiliated. As continued financial pressure is exerted on academic institutions and University Hospitals, it will be increasing important for academic anesthesia departments to receive adequate infrastructural support to ensure both the safety of our patients and an operational efficiency that is necessary to ensure financial solvency.
The purpose of this survey is to delineate the current standard of non-monetary infrastructural support afforded to academic anesthesia departments by their University Hospitals. We believe that the results of this survey will serve as a reference for institutional comparison and help to establish normative data.
2. Methods
After Institutional Review Board approval at Robert Wood Johnson Medical School, an electronic emailmediated request to participate in our survey was sent to all 133 Chairpersons of academic anesthesia departments in the United States. The survey was sent out electronically seven times between June and November of 2010. The survey and its results were tabulated in an anonymous fashion using the Google TM survey tool. The email invitation provided a link to a survey web page. The survey consisted of 63 questions, 43 of which are included in the present period study. The remaining 20 questions were unrelated to the topics presented in this manuscript.
Questions were answered electronically on-line. Survey responders were instructed to answer the survey only for their main University Hospital clinical campus. The data analysis was done using SAS 9.3. The data was skewed, with the mean frequently substantially larger than the great majority of observations, for many variables. In particular, ratios with low denominator values (such as the ratio of cases divided by the number of transport personnel after 3 pm) can easily skew the data. Therefore to be consistent, the median, lower 25th quartile, upper 75th quartile and the range were reported for all variables.
3. Results
The survey was sent to 133 institutions. 62 institutions replied with completed surveys, yielding an overall response rate of 46.6%.
Table 1 summarizes caseload data. The median total number of cases that were performed per academic center was 18,200, with the vast majority of cases being done in the main operating room suite (median = 87%). The median number of anesthetizing locations in the main operating room was 22, with a median of 1.83 cases per main OR location being performed per day. While offsite locations represented nearly 25% of anesthetizing locations, they accounted for only 13% of the total cases done.
Table 2 presents data pertinent to ancillary technical support personnel. The median ratio of total anesthesia sites to dedicated anesthesia technicians during the daytime was 5.46, while the ratio increased to 14.5 after 3 pm. The median ratio of anesthesia technicians after 3 pm to daytime anesthesia technicians was 0.41.The median ratio of total number of cases per dedicated anesthesia technician was 9.8. The percentage of surveyed sites reporting that they had dedicated cardiac anesthesia technicians was 26.2%. The percentage of institutions indicating that they had dedicated anesthesia technicians for off site locations was 45.9%. Almost 72% of responding institutions indicated that the main OR was better stocked by the anesthesia technicians than the off site locations.
Table 3 summarizes data concerning patient transport, biomedical technical support, and pharmaceutical support. The median number of main OR (operating room) sites to dedicated transport personnel during daytime hours was 6.33, while that ratio increased to 27.38 after 3 pm. 5 hospitals or 11% of hospitals responding to that question did not have dedicated transport services. A full 12 hospitals or 25% did not have dedicated transport services after 3 pm. This is why the range is represented by XX; there is a zero in the denominator. Over 74% of institutions indicated that inefficient patient transport affected OR efficiency on a regular basis. The percentage of institutions that indicated that the hospital pharmacy or a third party vendor provide prepared medication syringes, vasoactive drip solutions, and medication labels, which indicate drug concentration, was 79%, 97%, and 69% respectively. Almost 79% of responding institutions indicated that pharmacy or a third party vendor provided prepared medication syringes, while 97% were supplied with vasoactive medication solutions, and 69% were provided medication labels which indicated medication concentration. The median number of times per week that Biomedical personnel checked the anesthesia machine was 0.89, with 23 institutions indicating that biomedical personnel do not check their anesthesia machines at all.
Table 4 summarizes data regarding anesthesia-related equipment. The median number of main OR locations per ultrasound machine (machines that are specifically used for vascular access or regional techniques and not for TEE) was 8. The median number of main OR locations per glidescope was 7.67, and 3 institutions reported having no glidescopes at all. 28% of institutions reported that not having immediate access to a glidescope engendered safety issues. The median number of main OR locations per fiberoptic intubating scope was 6.33. The median number of cardiac operating rooms to TEE machines was 1, while the median number of daily cardiac cases per dedicated TEE machine was 0.55. There were 3 surveyed hospitals that do cardiac surgery and do not have TEE machines. This is why the range is represented by XX; there is a zero in the denominator. The median number of years that TEE machines, OR monitors, and anesthesia machines, are used before replacement was 8, 10, and 10 years, respectively.
Table 5 summarizes data pertaining to the preoperative holding area. The median umber of operating rooms per holding area spots was 1.45. The median number of daily operating room cases per holding area spot was 2.74. The median number of main holding area spots per holding area RN (registered nurse) was 3.5. There were 3 hospitals reporting that they did not staff their holding area with an RN which is why the range is represented by XX; there is a zero in the denominator. The median ratio of main holding area RNs to ancillary holding area helpers (e.g., Certified Care Technician) was 2.5. A full 16 hospitals or 28% did not have any ancillary help for the holding area; which also resulted in a zero in the denominator of the range (XX).
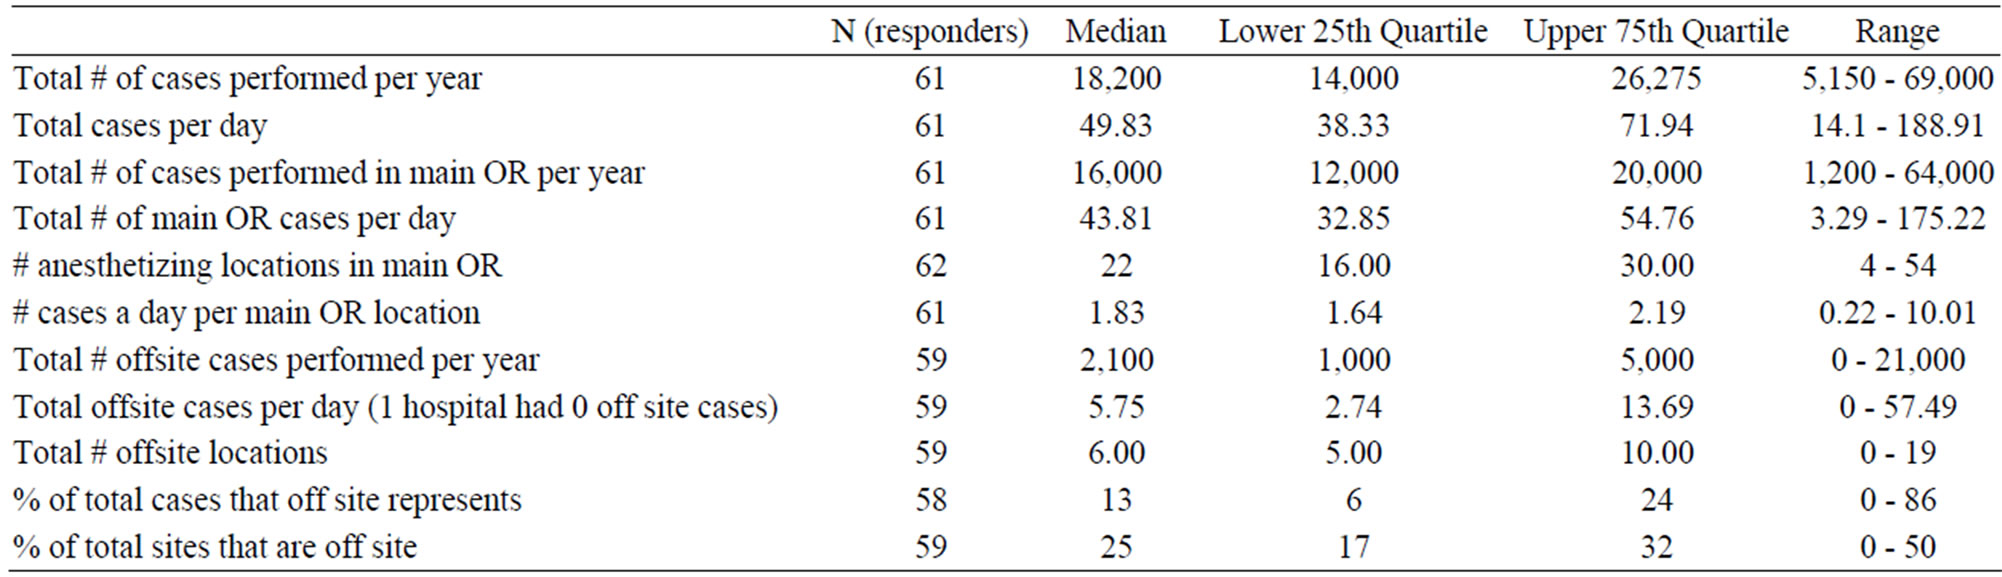
Table 1. Case load.
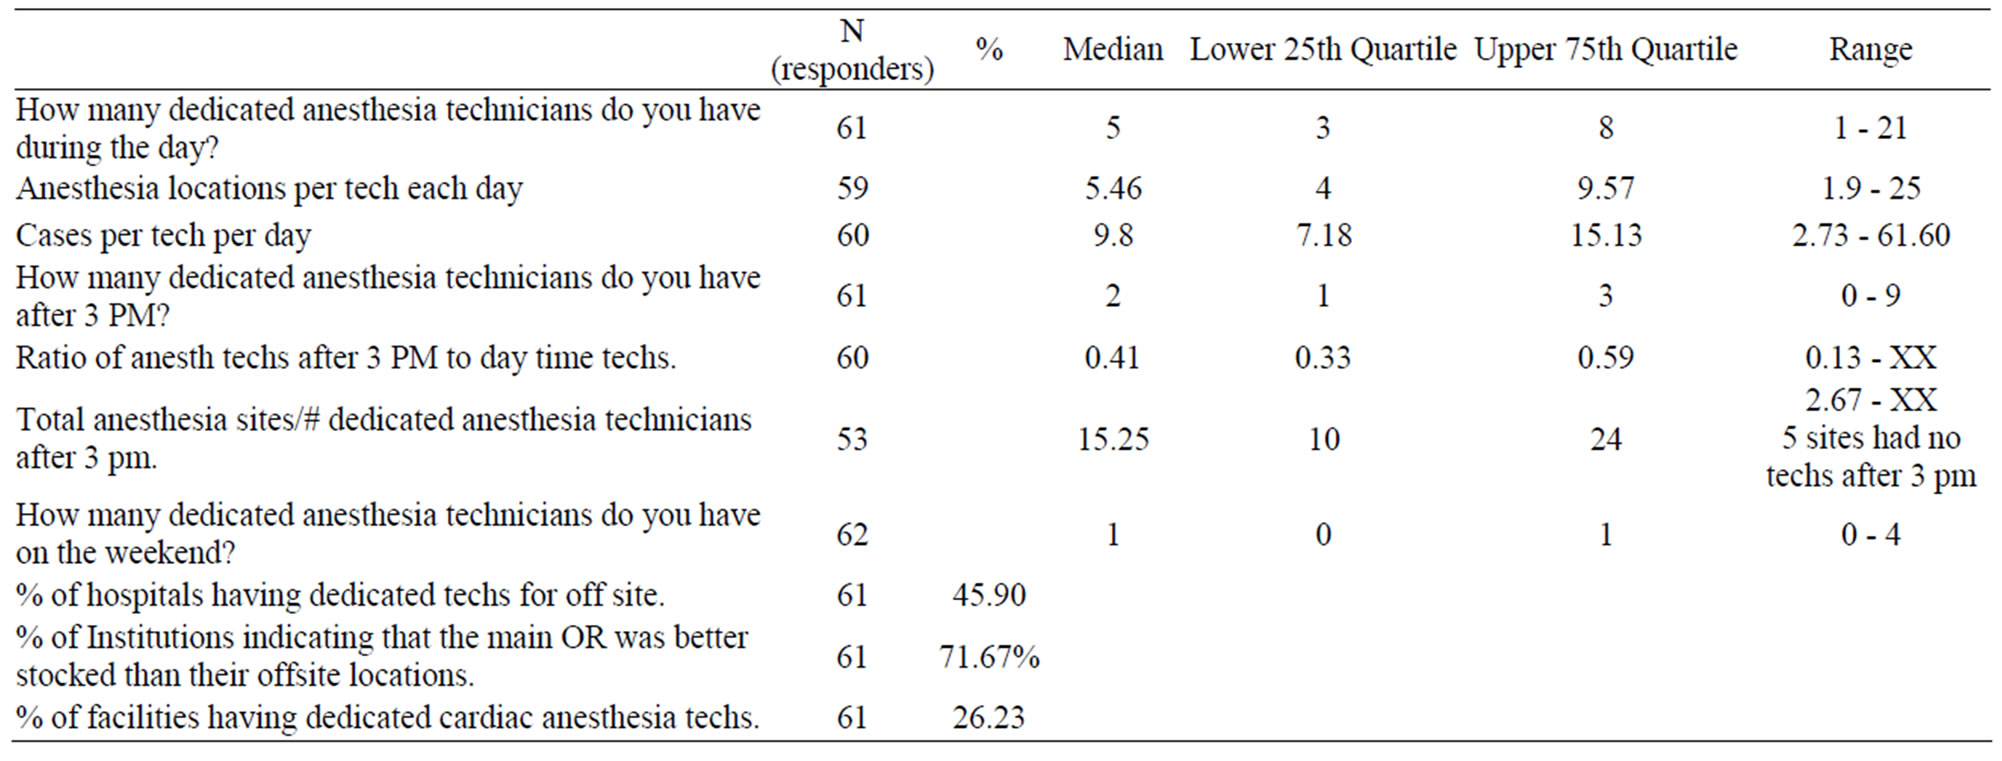
Table 2. ancillary support: tech.
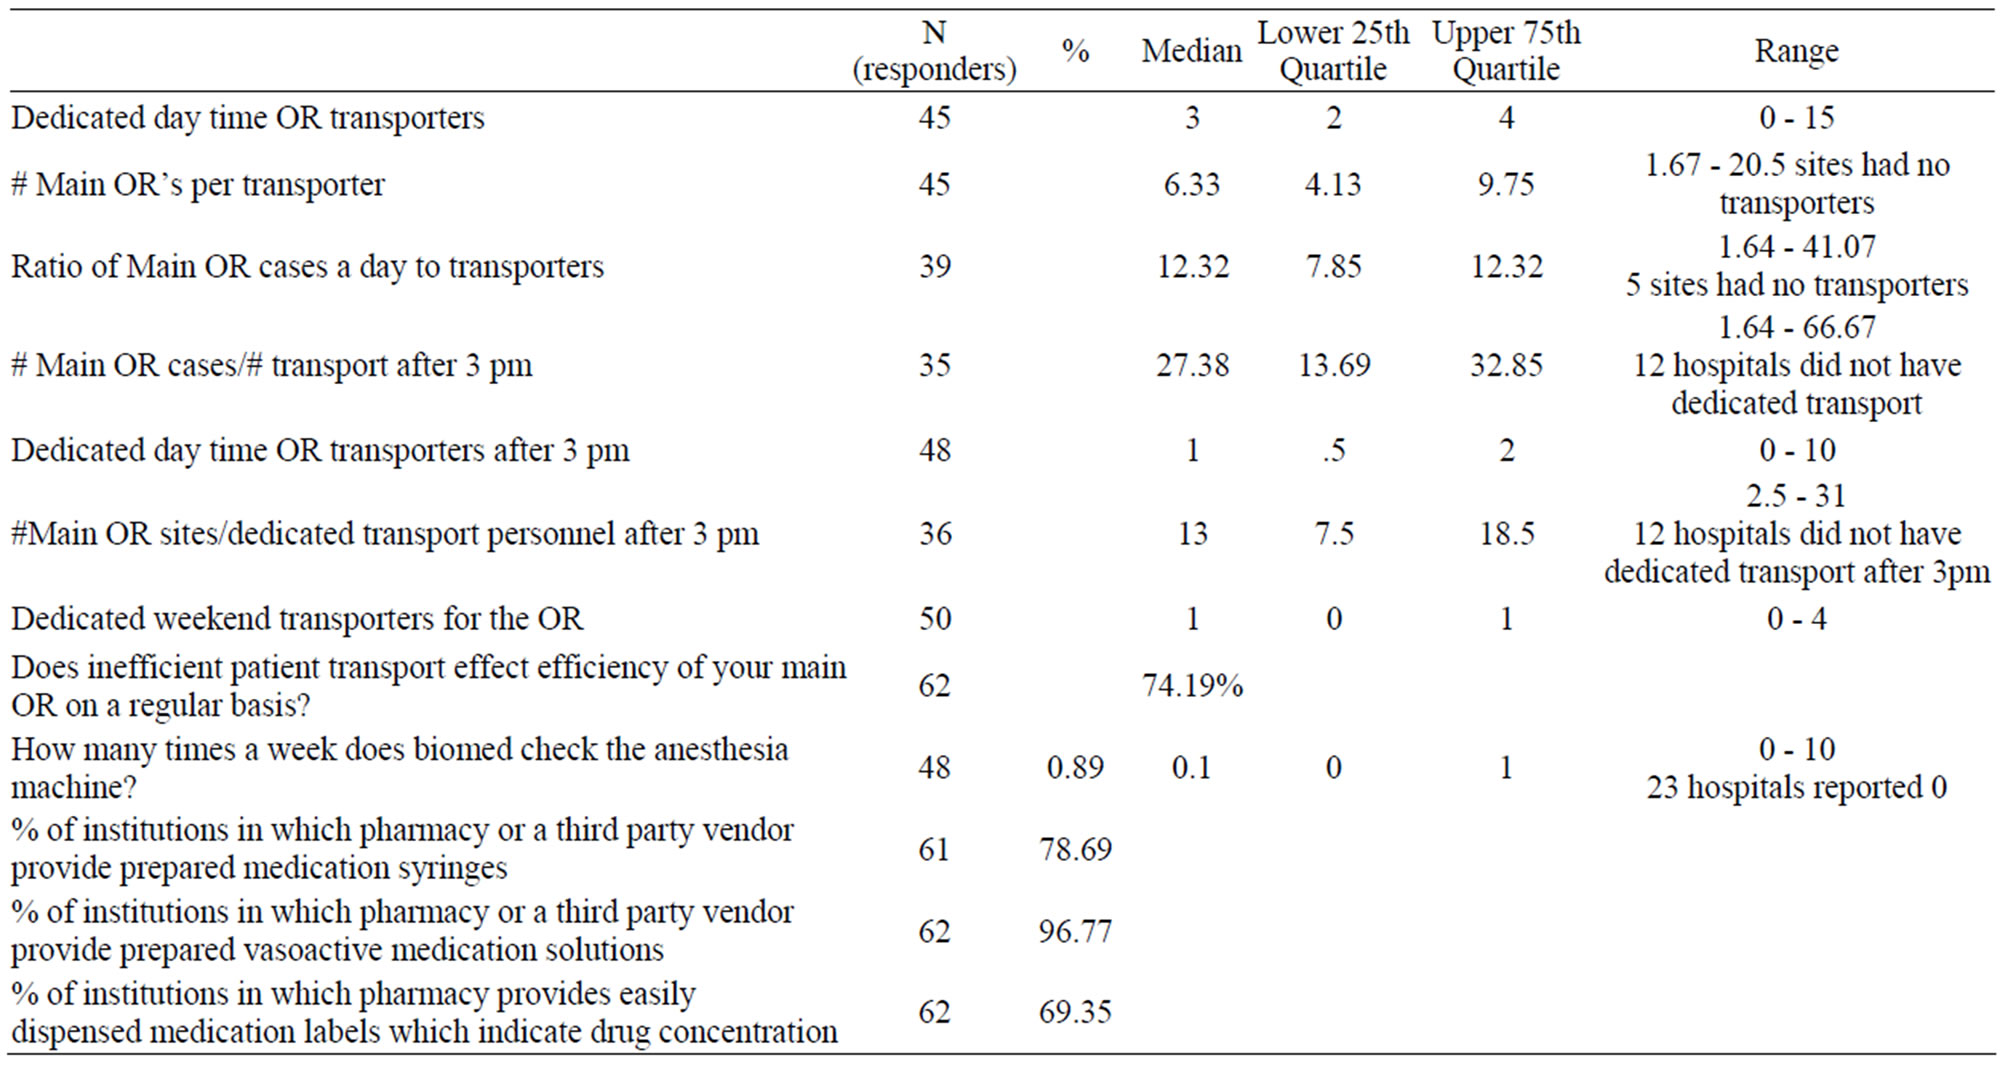
Table 3. Ancillary support: transporters, biomed, pharmacy.
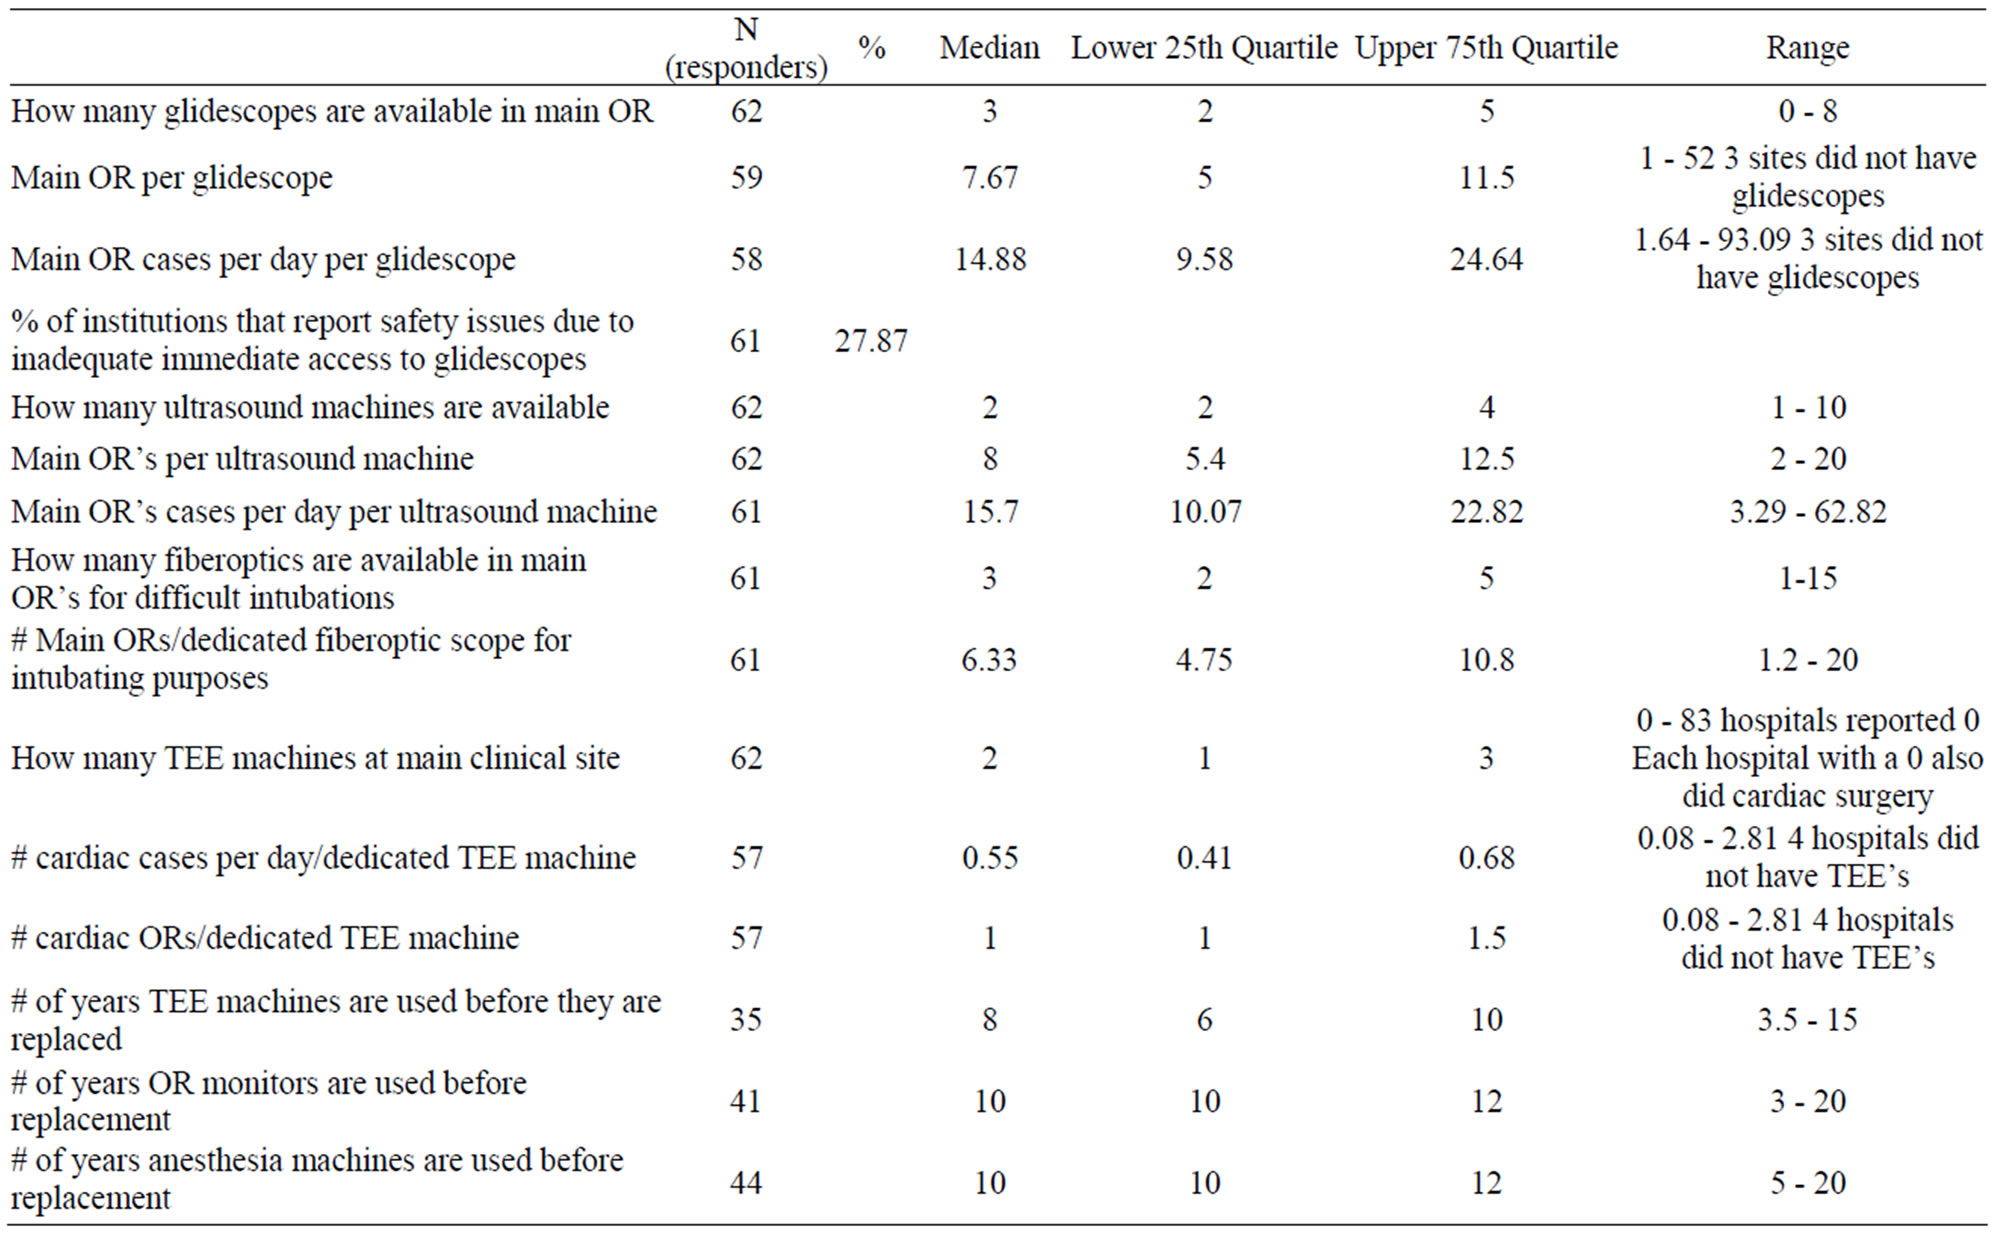
Table 4. Equipment availability/lifespan.
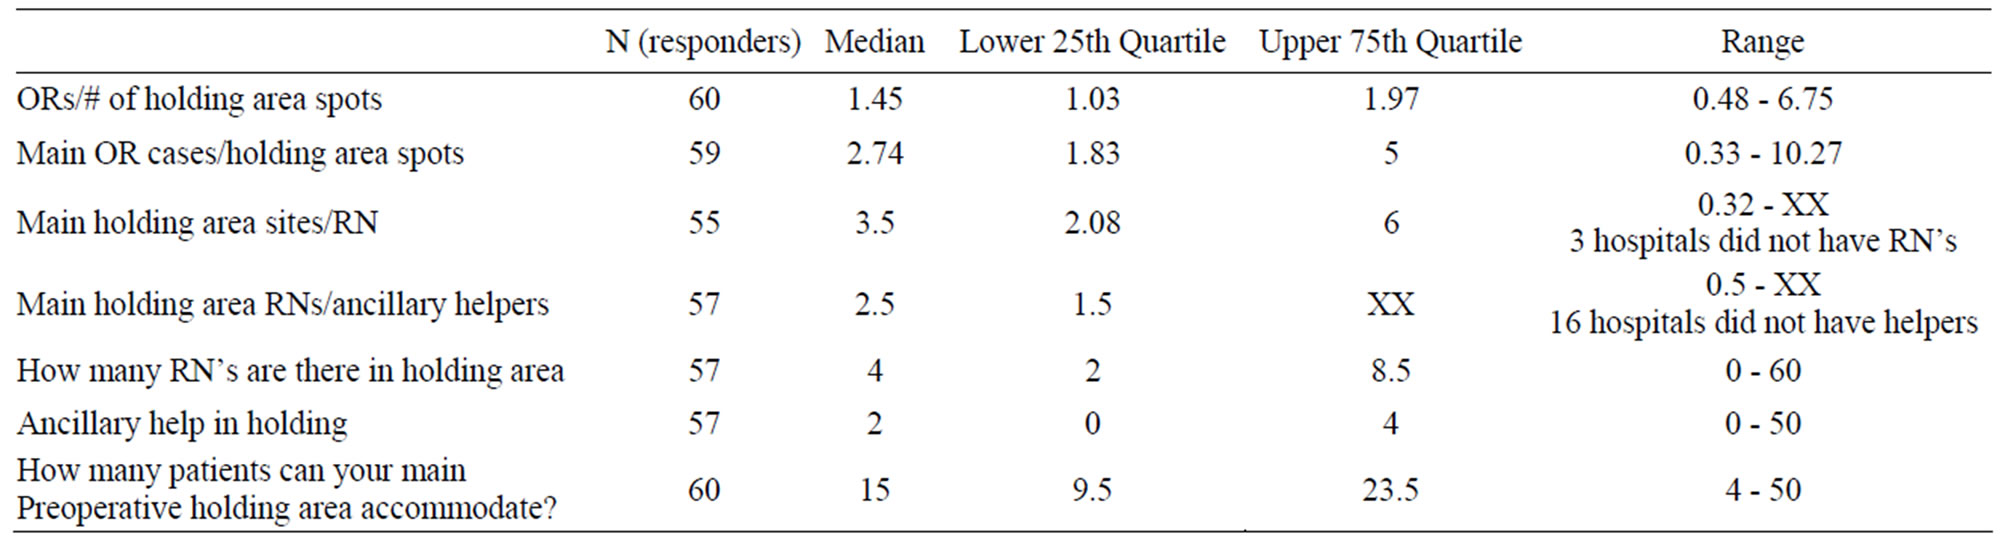
Table 5. Holding area.
Table 6 summarizes data pertaining to revenue cycle. Slightly more than half of the institutions reported to have anesthesia specific coding and billing services. 44% have anesthesia specific collection services. 11% are using PDA (personal digital assistant) type of devices for real time billing and 45% report the use of automated record keepers.
4. Discussion
As financial pressure taxes the ability of academic anesthesia departments to aintain their academic identity while preserving the priority of patient safety, efficient resource utilization, and maximization of institutional support (both monetary and nonmonetary) will become critically important. Previous surveys have provided information pertaining to the monetary support of academic anesthesia departments [1]. The present observational survey focused on non-monetary support afforded to academic anesthesia departments and their faculty.
Non-monetary measures of support and the nature of staffing patterns in academic anesthesia departments help describe important issues and limitations currently faced by these departments. It is important for operational managers (Chairpersons and Business Managers) to appreciate how their department’s practice fits in with that of academic anesthesia throughout the country. It is also important to realize that there are certain practice and
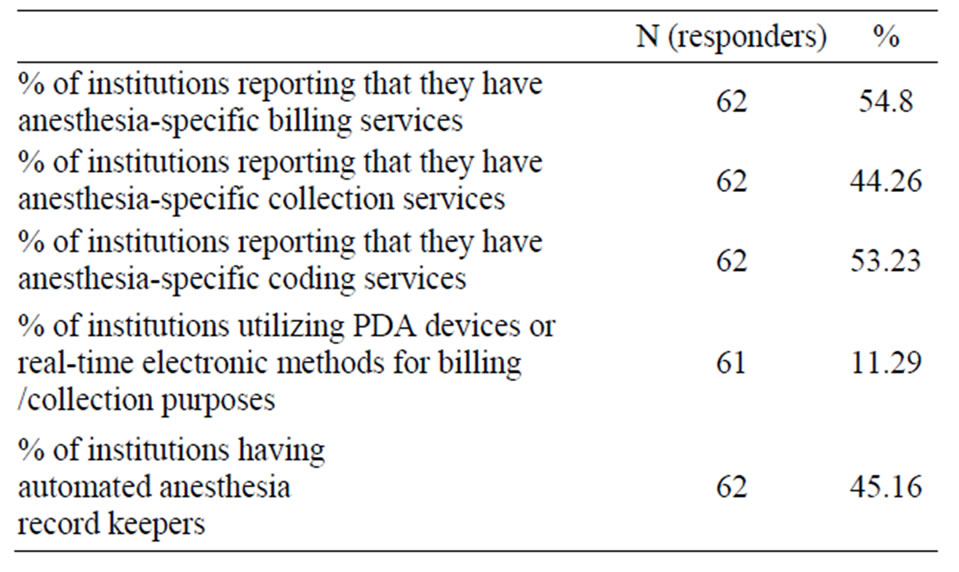
Table 6. Revenue cycle issues.
staffing issues that need further thought, and perhaps corrective action.
Academic anesthesia departments need to maintain a level of non-monetary institutional infrastructural support that maximizes both operational efficiency (e.g., transport services, anesthesia technician staffing, pharmaceutical support services) and patient safety (e.g., equipment availability, equipment replacement, biomed equipment surveillance, pharmaceutical support services, etc.). Nearly 3/4 of respondents indicated that inefficient patient transport engenders clinical delays in their main operating room suite, while almost 72% indicated that the main operating room is better stocked than their off-site locations. It was felt by over 25% of Chairs that inadequate immediate access to Glidescopes has lead to patient safety issues.
The American Society of Anesthesia Technologists and Technicians (ASATT) has established safety standards concerning the staffing ratios for how many operating rooms can be covered by anesthesia technicians [2]. For general operating rooms, it is recommended that you have one technician cover no more than 4 rooms. For both cardiac operating room and off-site locations, the ratio is one anesthesia technician for 2 sites. A level one trauma center should have technician coverage at all times. We found that the median technician coverage is 5.46 rooms (table 5), instead of the recommended 4. Only 29% of surveyed institutions were in compliance with ASATT recommendations for technician coverage of the main operating room facility. We did not specifically ask for the number of technicians per offsite location but only whether or not you had technicians. 54% of responding institutions indicated that they did not have anesthesia technicians dedicated to off-site locations, which is in violation of ASATT standards. 74% if institutions indicated that they do not have anesthesia technicians for their cardiac operating rooms.
There is a confluence of economic events and trends that will challenge the ability of academic anesthesia departments to maintain their academic identity and provide safe clinical care for our patients. We hope that this survey will help to identify some of the specific issues that we currently face, and help us to prepare for future challenges. Finally, we hope that this survey will serve as a framework for future observational inquiries into the clinical practice issues that face academic anesthesia departments. The response rate of 46% maybe because of the complexities of the many questions asked and the research that would be needed to arrive at those results, the lack of time to complete such a survey, or because the survey was not sent via a nationally known organization.
REFERENCES
- K. K. Tremper, S. J. Barker, S. Gelman, J. G. Reves, A. J. Saubermann, A. M. Shanks, M. L. V. H. Greenfield and S. T. Anderson, “A Demographic, Service, and Financial Survey of Anesthesia Training Programs in the United States,” Anesthesia & Analgesia, Vol. 96, No. 5, 2003, pp. 1432-1446.
- American Society of Anesthesia Technologists & Technicians, “Position Statement for Anesthesia Technical Coverage,” 2006.
NOTES
*Corresponding author.