World Journal of Cardiovascular Diseases
Vol.3 No.2(2013), Article ID:30266,5 pages DOI:10.4236/wjcd.2013.32030
Refinement of total 12-lead QRS voltage criteria for diagnosing left ventricular hypertrophy
![]()
1Department of Cardiovascular Medicine, Saint Vincent Hospital, University of Massachusetts Medical School, Worcester, USA
2Department of Internal Medicine, Saint Vincent Hospital, University of Massachusetts Medical School, Worcester, USA
Email: *lovids@hotmail.com
Copyright © 2013 Deepti Kumar et al. This is an open access article distributed under the Creative Commons Attribution License, which permits unrestricted use, distribution, and reproduction in any medium, provided the original work is properly cited.
Received 14 January 2013; revised 6 March 2013; accepted 10 April 2013
Keywords: ECG; QRS Voltage; Left Ventricular Hypertrophy; Echocardiography; Interventricular Septum
ABSTRACT
Objective: We sought to test the hypothesis that the total QRS voltage without either set of the limb leads (I, II, III) or (R, L, F) may be a better indicator of LVH as compared to the total QRS voltage. Background: The total 12 lead QRS voltage has been a validated electrocardiographic criterion for left ventricular hypertrophy (LVH), with an upper limit of 175 mm. However, there is some redundancy in this measurement as the output of the limb leads is repeated because leads I, II, III, and R, L, F use the same three electrodes. Methods: 43 unselected, consecutive echocardiograms were examined for evidence of LVH by wall thickness. Electrocardiogram (ECG) of these patients within a week of the echocardiogram were then examined for the total 12 leads QRS voltage, minus I, II, III and total minus R, L, F voltages. ECG findings were then compared with corresponding echocardiographic dimensions. Results: A total QRS voltage of 123 mm on ECG yielded a sensitivity of 73% and specificity of 67% for diagnosing LVH with 95% CI = 0.59 - 0.89, p = 0.007. Total minus (R, L and F) value of 110 mm on ECG appears to give the best sensitivity (73%), specificity (72%), and accuracy (64% negative predictive value and 82% positive predictive value) for LVH. Conclusion: It appears that total QRS voltage minus either set of the limb leads, especially the total minus R, L and F is a better criterion, with 110 mm being the best specific, sensitive and accurate index for diagnosing LVH.
1. INTRODUCTION
There are many electrocardiographic (ECG) criteria for diagnosing left ventricular hypertrophy (LVH), nearly all voltage based. The total 12 lead QRS voltage has been validated as a criterion in different disease states [1-8], most of these have been necropsy studies. The normal upper limit for total QRS amplitude of 175 mm was first determined by Roberts and Day [3] and later validated by Odom et al. [4] in their study of men free of cardiopulmonary disease. Odom et al. [4] found that the upper limit of 175 mm yielded specificity of 100% for diagnosing LVH in subjects with heart weight less than 400 g.
Their study established that a total QRS voltage of 127 ± 29 mm as an average range on autopsied men free of cardiopulmonary disease. In another study, Rodriguez established that a total 12-lead QRS voltage >120 mm is a good ECG criterion for LVH among patients with essential hypertension [7].
In measuring total QRS voltage, the output of the limb lead electrodes (bipolar plus unipolar leads) is repeated because leads I, II, III, R, L and F use the same three electrodes. Hence, there may be some redundancy in this measurement. We sought to test the hypothesis that the total QRS voltage without either set of the limb leads is a more accurate indicator of LVH as compared to total QRS voltage.
2. MATERIALS AND METHODS
Electrocardiograms and comprehensive 2D and doppler echocardiograms of 70 unselected, consecutive patients admitted at Saint Vincent Hospital over one month period were reviewed. ECGs with artifacts, paced rhythms, technically unsatisfactory or poor quality tracings, complete left or right bundle branch block and Wolf-Parkinson-White syndrome were excluded. Patients with ischemic heart disease and any inconclusive echocardiograms were also excluded. In all, 27 patients were thus excluded. Echocardiographic and electrocardiographic data in the remaining 43 patients were studied.
Echocardiographic dimensions including intervenetricular septum (IVS) and posterior wall thickness (PWT) were noted. LVH was characterized by IVS and PWT > 11 mm or no LVH by IVS and PWT of ≤11 mm (Figure 1). All measurements were made at the end-diastole.
Technically satisfactory ECGs of these patients, obtained within a week period of the echocardiogram were then examined. The QRS amplitude from each lead was then measured from the peak of the R wave to the nadir of either the Q or S whichever was deeper, according to the method of Siegel and Roberts [1-3]. Further, the sum of leads I, II and III was subtracted from the total voltage. Similarly, the sum of leads R, L and F was also subtracted from the total voltage. Total QRS voltage, total minus I, II, III and total minus R, L, F voltages were then compared with corresponding echocardiographic dimensions for the wall thickness.
Out of the total forty-three echocardiograms, twentytwo were classified in the LVH group and twenty-one in the no LVH group based on the IVS and PWT thickness. Differences between groups were assessed using Chisquare analysis for categorical variables and analysis of variance for continuous variables. A p-value (2-tailed) of <0.05 was considered to represent statistical significance. Statistical analysis was performed by using the SPSS software, version 15.0.
3. RESULTS
Table 1 summarizes the baseline characteristics of 43 patients included in the study. Their mean age group was 68 ± 18.3 years (range 28 - 98) and 20 (46.5%) were males. Mean total voltage was 137.2 ± 49 mV (range 44 - 256), mean IVS was 13 ± 4 mm, and mean PWT was 13 ± 3 mm. Table 2 shows the comparison between patients with and without LVH. 22 patients had LVH and
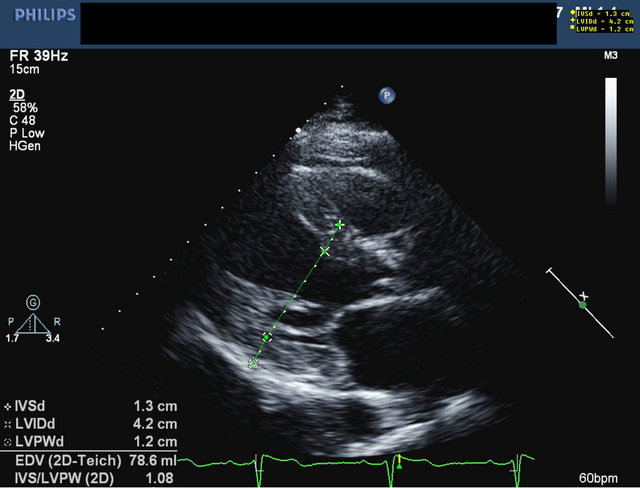
Figure 1. 2-dimensional transthoracic echocardiogram with signs of LVH (Interventricular septum (IVS) thickness of 13 mm and posterior wall thickness (PWT) of 12 mm).
Table 1. Baseline characteristics of the study population and ECG data.
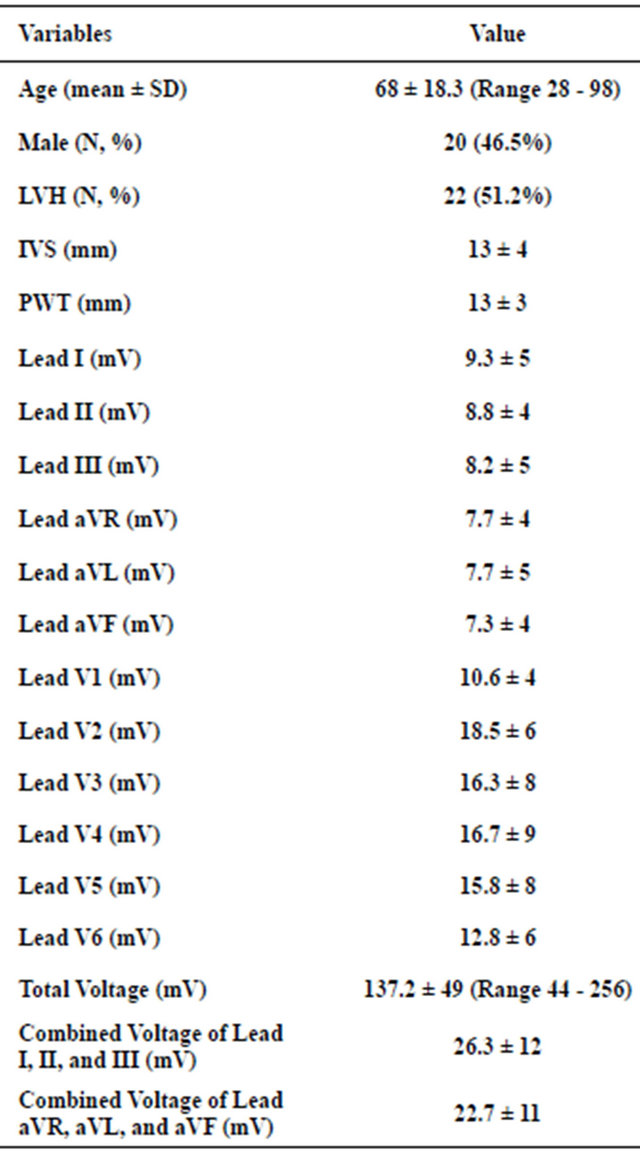
Data are presented as n, n (%) or mean ± standard deviation.
Table 2. Comparison of IVS, PWT total voltage, total minus I, II, III and total minus R, L, F voltage in LVH and no LVH groups.

Data are presented as mean ± standard deviation.
21 patients had no LVH based on IVS and PWT. Mean IVS and PWT were 16 ± 2 mm and 15.7 ± 2 mm respectively in LVH group, whereas mean IVS and PWT were 9.7 ± 1 mm and 9.6 ± 1 respectively in no LVH group. Clearly, the group with LVH had higher IVS and PWT than the group with no LVH (p < 0.0001). Mean total voltage was 157.5 ± 57 in LVH group and 116 ± 27 in no LVH group (p = 0.004). Mean total voltage minus I,II,III was 128.9 ± 44 in LVH group and 95.6 ± 23 in no LVH group (p = 0.001). Mean total voltage minus R,L,F was 132.3 ± 46 in LVH group and 95.6 ± 23 in no LVH group (p = 0.002).
Table 3 generated on the basis of receiver operating characteristic (ROC) curve shows the sensitivity and specificity cutoff points of the total QRS voltage. A total voltage of 123 mm yielded a sensitivity of 73% and a specificity of 67% for diagnosing LVH (95% CI = 0.59 - 0.89; p = 0.007). Figure 2 shows the corresponding ROC curve for LVH versus total voltage (p = 0.007). Table 4 generated on the basis of the ROC curve shows the sensitivity and specificity cutoff points of total minus (R, L and F) voltage. A voltage of 104 mm had the best sensitivity (73%) and specificity (72%) for diagnosing LVH (95% CI = 0.62 - 0.91; p = 0.003). Figure 3 shows the corresponding area under the curve (AUC) for the total minus (R, L and F) voltage (p = 0.003).
Table 5 generated on the basis of ROC curve shows the sensitivity and specificity cutoff points for total minus (I, II and III). A voltage of 101 mm had the best sensitivity (73%) and specificity (69%) for diagnosing LVH (95% CI = 0.62 - 0.91; p = 0.003). Figure 4 shows the corresponding area under the curve (AUC) for the total minus (I, II and III) voltage (p = 0.003). From the results represented in Tables 3-5, it becomes apparent that the total minus R, L and F voltage has the best sensitivity and specificity for diagnosing LVH.
Table 6 generated on the basis of ROC curve represents the sensitivity, specificity, positive predictive value (PPV), negative predictive value (NPV) and accuracy for
Table 3. Sensitivity and specificity cutoff point studied in the total QRS voltage.
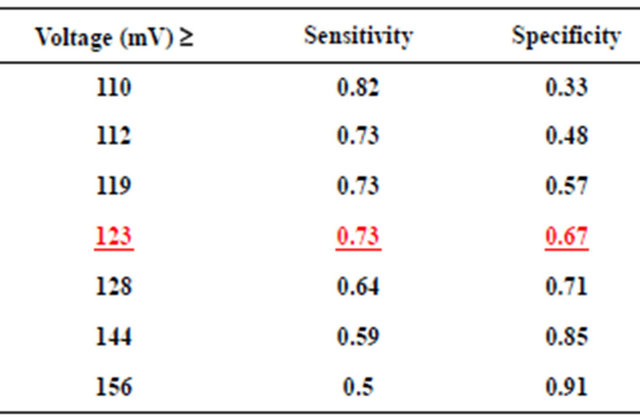
Data are presented as fraction.
ROC Curve. LVH vs. Total Vlotage.
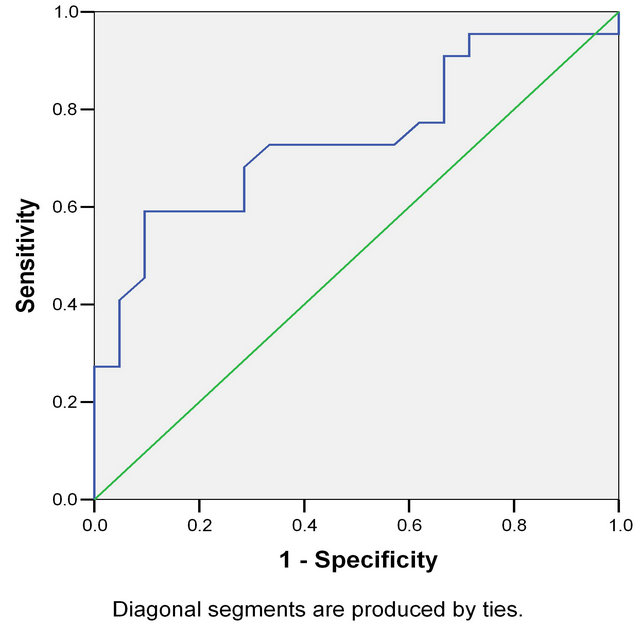
Figure 2. ROC curve showing LVH versus total voltage. Area under the curve (AUC) = 0.74 (95% confidence interval (CI) = 0.59 - 0.89), p = 0.007).
Table 4. Sensitivity and specificity cutoff point for total QRS voltage minus R, L and F.

Data are presented as fraction.
various values of the total minus (R, L and F) voltage in cases of LVH. A total minus (R, L and F) value of 110 mm appears to give the best accuracy, sensitivity and specificity for LVH diagnosed by wall thickness on echocardiogram.
Figure 5 shows the area under the curve of the total voltage, total minus R, L and F voltage and total minus I, II and III voltage together in cases of LVH. It is evident that for LVH, all three criteria are excellent but the total voltage minus R, L and F with a value above 110 mm seems to be the best indicator (p-value = 0.017).
4. DISCUSSION
The electrocardiogram is an accessible and inexpensive method for the diagnosis of left ventricular hypertrophy
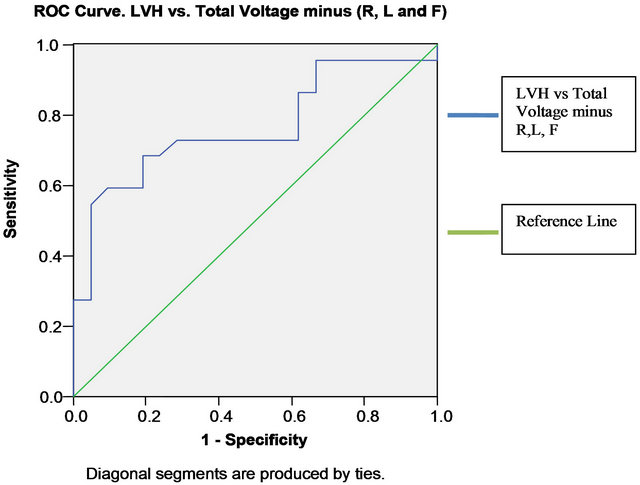
Figure 3. Corresponding AUC for the total voltage minus (R, L and F). AUC = 0.76 (95% CI = 0.62 - 0.91), p = 0.003.
Table 5. Sensitivity and specificity cutoff point for total QRS voltage minus I, II and III.
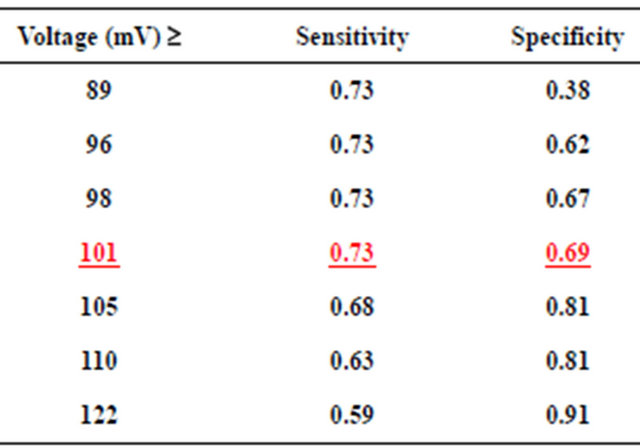
Data are presented as fraction.

Figure 4. Corresponding AUC for the total voltage minus (I, II and II). AUC = 0.76 (95% CI = 0.62 - 0.91), p = 0.003.
(Figure 6). Since left ventricular hypertrophy is associated with an increase in the risk of cardiovascular morbidity and mortality [9]; we decided to find the most
Table 6. Sensitivity, specificity, positive predictive value (PPV) and negative predictive value (NPV) for various values of the total minus (R, L and F) in cases of LVH.
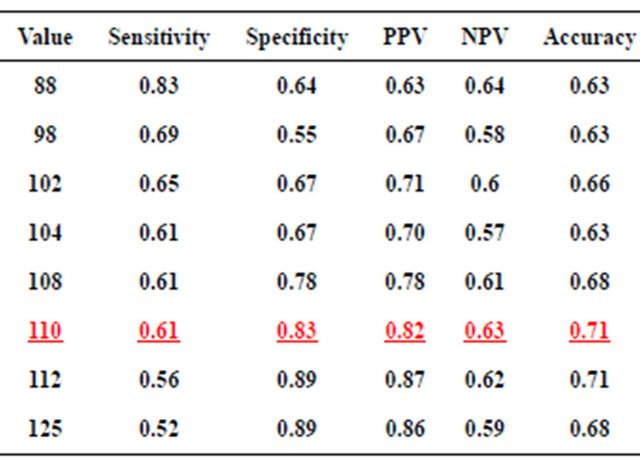
Data are presented as fraction.

Figure 5. Area under the curve of the total voltage, total minus R, L and F and total minus I, II and III together in cases of LVH.

Figure 6. ECG of a patient illustrating typical changes of left ventricular hypertrophy.
accurate index to diagnose left ventricular hypertrophy on the ECG. In a study done by Dollar et al. [10], the Sokolow-Lyon index had a sensitivity of only 39%; the Romhilt-Estes voltage criteria of 37%; the Romhilt-Estes point score system of 49%; and the criterion of RV6 more than RV5 of 39%. Various other studies such as the one by Pewsner et al. [11] have also shown low diagnosetic value of these electrocardiographic criteria to interpret left ventricular hypertrophy.
Our study clearly indicates that 12 lead ECG criteria have a better sensitivity than the above stated criteria. Moreover, this study is the first to compare total 12-lead voltage with total minus each set of limb leads as the criteria for predicting LVH. From this study, though it appears that a total 12 lead QRS voltage of >123 mm (73% sensitivity and 67% specificity) is a good electrocardiographic criterion for LVH; it is associated with redundancy given the duplication of the limb lead output because leads I, II, III, R, L and F use the same three electrodes. Thus, the total QRS voltage minus either set of the limb leads, especially total voltage minus (R, L, F voltage) is an even better criterion, with ≥110 mm cutoff serving as the most accurate index (i.e. best sensitivity, specificity, NPV and PPV) when LVH is diagnosed by wall thickness on echocardiography.
REFERENCES
- Siegel, R.J. and Roberts, W.C. (1982) Electrocardiographic observations in severe aortic valve stenosis: Correlative necropsy study to clinical, hemodynamic, and ECG variables demonstrating relation of 12-lead QRS amplitude to peak systolic trans-aortic pressure gradient. American Heart Journal, 103, 210-221. doi:10.1016/0002-8703(82)90494-X
- Roberts, W.C. and Waller, B.F. (1983) Cardiac amyloidosis causing cardiac dysfunction: Analysis of 54 necropsy patients. The American Journal of Cardiology, 52, 137-146. doi:10.1016/0002-9149(83)90084-X
- Roberts, W.C. and Day, P.J. (1985) Electrocardiographic observations in clinically isolated, pure, chronic, severe aortic regurgitation: Analysis of 30 necropsy patients aged 19 - 65 years. The American Journal of Cardiology, 55, 432-438. doi:10.1016/0002-9149(85)90389-3
- Odom, H. II, Davis, J.L., Dinh, H., Baker, B.J., Roberts, W.C. and Murphy, M.L. (1986) QRS voltage measurements in autopsied men free of cardiopulmonary disease: A basis for evaluating total QRS voltage as an index of left ventricular hypertrophy. The American Journal of Cardiology, 58, 801-804. doi:10.1016/0002-9149(86)90357-7
- Roberts, W.C., Siegel, R.J. and McManus, B.M. (1987) Idiopathic dilated cardiomyopathy: Analysis of 152 necropsy patients. The American Journal of Cardiology, 60, 1340-1355. doi:10.1016/0002-9149(87)90618-7
- Dollar, A.L. and Roberts, W.C. (1989) Usefulness of total 12-lead QRS voltage compared with other criteria for determining left ventricular hypertrophy in hypertrophic cardiomyopathy: Analysis of 57 patients studied at necropsy. The American Journal of Medicine, 87, 377-381. doi:10.1016/S0002-9343(89)80817-4
- Rodríguez Padial, L. (1991) Usefulness of total 12-lead QRS voltage for determining the presence of left ventricular hypertrophy in systemic hypertension. The American Journal of Cardiology, 68, 261-262. doi:10.1016/0002-9149(91)90758-D
- Pelliccia, F., Critelli, G., Cianfrocca, C., Nigri, A. and Reale, A. (1991) Electrocardiographic correlates with left ventricular morphology in idiopathic dilated cardiomyopathy. The American Journal of Cardiology, 68, 642-647. doi:10.1016/0002-9149(91)90358-R
- Gupta, S., Berry, J.D., Ayers, C.R., Peshock, R.M., Khera, A., de Lemos, J.A., Patel, P.C., Markham, D.W. and Drazner, M.H. (2010) Left ventricular hypertrophy, aortic wall thickness, and lifetime predicted risk of cardiovascular disease: The Dallas heart study. JACC: Cardiovascular Imaging, 3, 605-613. doi:10.1016/j.jcmg.2010.03.005
- Dollar, A.L. and Roberts, W.C. (1989) Usefulness of total 12-lead QRS voltage compared with other criteria for determining left ventricular hypertrophy in hypertrophic cardiomyopathy: Analysis of 57 patients studied at necropsy. The American Journal of Medicine, 87, 377-381. doi:10.1016/S0002-9343(89)80817-4
- Pewsner, D., Jüni, P., Egger, M., Battaglia, M., Sundström, J. and Bachmann, L.M. (2007) Accuracy of electrocardiography in diagnosis of left ventricular hypertrophy in arterial hypertension: Systematic review. British Medical Journal, 335, 711.
NOTES
*Corresponding author.