Open Journal of Biophysics
Vol.3 No.2(2013), Article ID:30787,7 pages DOI:10.4236/ojbiphy.2013.32019
A Spectrophotometric Analysis of Human Osteoarthritic Cartilage Explants Subjected to Specific Capacitively Coupled Electric Fields
1Department of Orthopaedic Surgery, Perelman School of Medicine at the University of Pennsylvania, Philadelphia, USA
2Department of Epidemiology and Biostatistics, Perelman School of Medicine at the University of Pennsylvania, Philadelphia, USA
Email: ctb@upenn.edu
Copyright © 2013 Carl T. Brighton et al. This is an open access article distributed under the Creative Commons Attribution License, which permits unrestricted use, distribution, and reproduction in any medium, provided the original work is properly cited.
Received January 30, 2013; revised March 5, 2013; accepted March 20, 2013
Keywords: Osteoarthritis; Cartilage Explants; Capacitive Coupling; Spectrophotometry; Disease Modification
ABSTRACT
We have previously shown that capacitively coupled electrical stimulation of either normal bovine articular chondrocytes or osteoarthritic human articular cartilage explants resulted in up-regulation of cartilage matrix gene expression and down-regulation of metalloproteinase gene expression. In addition, collagen and proteoglycan protein levels were also elevated. To determine visually the effect of specific electric fields on modifying cartilage structure, freshly harvested human full-thickness osteoarthritic cartilage explants were stimulated in the absence or presence of interleukin-1β, an inflammatory cytokine, and were examined photographically and spectrophotometrically. Hexosamine and hydroxyproline contents were also determined. Spectrophotometric analysis was used to quantify any changes in the depth of defects in the cartilage ranging from surface level (red-colored) to the deepest affected layer (blue-colored). Interleukin-1β treatment alone caused significant additional cartilage erosion. Electrical stimulation alone resulted in significant decreases in the cartilage defects. Electrical stimulation in the presence of interleukin-1β resulted in a small, but significant, surface improvement. Meta-analysis also confirmed a significant increase in the hexosamine and hydroxyproline contents (indicating matrix deposition). It was concluded that an appropriate electric field could modify osteoarthritic lesions in full-thickness cartilage plugs by increasing matrix production and/or by decreasing matrix destruction. Furthermore, it appears that spectrophotometric analysis is a relatively easy method for quantifying the “filling in” or healing of articular cartilage defects.
1. Introduction
The physical forces that arise in articular cartilage during weight bearing are both mechanical and electrical. The mechanical deformation that occurs in cartilage produces streaming potentials [1,2]. These mechanically-induced electrical potentials in articular cartilage seemingly play a role in the chondrocyte’s response to physical loading [3,4]. For instance, Wang et al. [5] developed a triphasic mixture model in bovine articular cartilage. Using it, they were able to measure the electrical potentials in articular cartilage in a confined compression loading of 10%. At the moment of release of the compression, a 2 mV potential was measured on the surface of the cartilage that decreased rapidly with time and with increasing cartilage depth.
The role that such electrical potentials play in articular cartilage homeostasis has intrigued us over the past several years. In initial studies, we found that a specific capacitively coupled electric field up-regulated aggrecan and type II collagen mRNA expression as well as cartilage matrix protein production in both fetal bovine articular chondrocytes [6] and adult bovine articular cartilage explants [7]. These studies were extended using osteoarthritic (OA) human full-thickness articular cartilage explants cultured ex vivo, and the same results were obtained. Moreover, with the addition of a slightly different signal, the expression of matrix metalloproteinases (MMPs)-1, -3 and -13 as well as aggrecanases-1 and -2 were significantly down-regulated, even in the presence of interleukin-1β (IL-1β) [8]. Finally, it was demonstrated that signal transduction in electrically-stimulated articular cartilage chondrocytes involves translocation of calcium through voltage-gated calcium channels [9].
From the above studies, it was apparent that electrical stimulation was modifying cartilage matrix metabolism. One of the hallmarks of OA is the loss of cartilage matrix and the subsequent impairment of structural integrity seen by surface pitting and fissuring [8]. These defects, viewed from above through a dissecting microscope, vary greatly in depth and in area. Histologic analysis of cartilage, while qualitatively useful, does not provide quantifiable data. This led us to choose a reflectance spectrophotometric procedure to help quantify the structural changes that were observed when OA cartilage was subjected to electrical stimulation. This nondestructive procedure permitted an analysis of surface defects of different depths by monitoring their capacity to absorb/reflect light of various wavelengths (colors). By comparing the area that each color occupied at the beginning of each experiment to that after seven days of electrical stimulation, it was possible to obtain quantitative information about the area and relative depth of defects from each explant, as well as monitor any changes that occurred during the course of a 7-day experiment.
2. Materials and Methods
2.1. Cartilage Isolation and Culture
Human articular cartilage explants were obtained from patients undergoing total knee replacement for stage II OA (Kellgren and Lawrence [10]) at the Penn Presbyterian Medical Center, Philadelphia, Pennsylvania. Surgical samples were obtained anonymously in compliance with the Declaration of Helsinki and were approved by the Office of Regulatory Affairs of the University of Pennsylvania. Tissue was obtained on the same day from the cartilage surfaces of one knee (femur, tibia and patella) of each of two female patients (ages 62 and 74) and placed into sterile phosphate-buffered saline. A total of 44 full-thickness plugs were removed with a sterile cork borer with an inside diameter of 4 mm. The subchondral bone was removed from each explant such that the size of the cultured cartilage was 4 mm in diameter and 2 - 3 mm in height. Portions of cartilage with less thickness were excluded.
Each explant was cultured separately in a modified Cooper dish as previously described [8]. It was placed on a quartz glass coverslip at the bottom of each dish, and the dish was completely filled with Dulbecco’s Modified Eagle Medium (Invitrogen) supplemented with 1% antibiotics and 50 μg/ml L-ascorbate (Sigma-Aldrich, St. Louis, Missouri). The medium was in contact with a second quartz glass coverslip incorporated in the dish lid with no air gap between the medium and the coverslip. Electrodes were placed in contact with the glass coverslips, and a uniform capacitively coupled electric field was generated between the electrodes. Capacitive coupling occurs when two conductors, (e.g., the metal electrodes on the top and the bottom of the quartz glass coverslips) are separated by a conductive medium, in this instance, the culture medium plus explant. When the circuit is turned on, stimulation occurs by means of a transfer of electric energy from the capacitor plates to the targeted tissue (coupling) through the induced electrical field [11].
2.2. Spectrophotometric Analysis
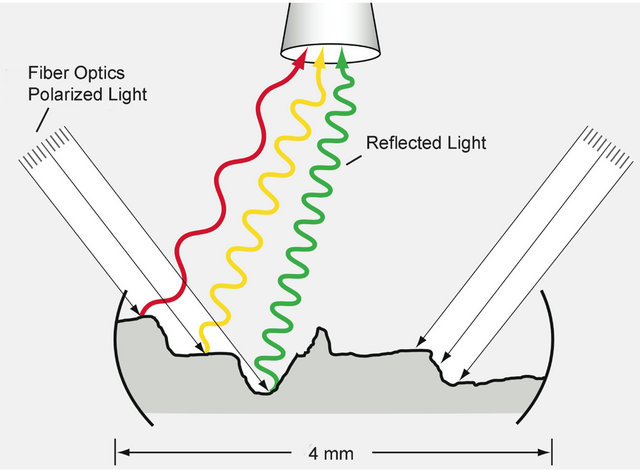
At the beginning of the experiment, the explants were selected at random, and each was viewed at a final magnification of 16× through a dissecting microscope (Stemi 2000-c, Zeiss, Thornwood, NY) firmly attached to the laboratory desktop. Two polarized fiber optic cold light beams were delivered via dual gooseneck fiber optics mounted on each side of the microscope stand at 45˚ angles such that the beams overlapped the center of the microscope field (Schott-Fostec, LLC, Auburn, NY). Before analyzing each explant, a piece of white paper was used to calibrate/normalize the reflected light (white balance). The incident beams of light from each side of the specimen struck the explant at a 45˚ angle, bounced off the surface of the explant, and broke into a spectrum of colored light that was reflected back up into the objective lens of the microscope (Figure 1). Colors were as signed to a gray scale spectrum such that dark blue represented 1 - 51, light blue 52 - 102, green 103 - 153, yellow 154 - 204 and red 205 - 256 (see Figures 2(c) and (d)). The images were fed into a computer and analyzed using Image-Pro Plus software (Media Cybernetics, Inc., Bethesda, MD). Each explant was analyzed spectrophotometrically on Days 0, 3, and 10. Three spectrophotometric images were recorded for each explant at 90˚ intervals (0˚, 90˚, 180˚) by rotating the specimen clock wise, and the average percent that each color occupied in the spectrophotometric image for each explant for each time period was calculated. This enabled us to quantify accurately the color spectrum in each explant. Importantly, this also allowed each explant to serve as its own control; that is, the spectrophotometric image on Day 3 (before stimulation) in a given explant was compared with that of the same explant on Day 10 (after stimulation).
2.3. Capacitively Coupled Electrical Stimulation
The experimental protocol is the same as that used in our previous human cartilage explant study [8]. The explants were divided into five groups with eight to nine explants
 (a)
(a)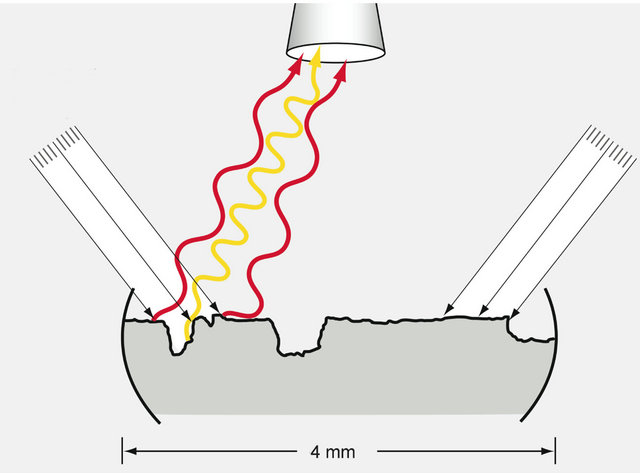 (b)
(b)
Figure 1. Schematic diagram depicting the apparatus for the spectrophotometric analysis of (a) untreated and (b) treated OA articular cartilage explants. (a) Polarized light is directed to the surface of an explant from each side (parallel arrows), and a digital imaging camera mounted on a microscope located directly above the explant captures the spectrum of reflected light (wavy colored lines). The colors reflecting from the cartilage depend upon the depth of the surface defects—red being the color reflected from the most superficial areas of erosion; and the succeeding colors of yellow, green, light blue and dark blue being reflected from ever deeper areas of destruction. Data from the spectrum of reflected light are transmitted to a computer program that calculates the percent of the total reflected light represented by each color; (b) After electrical stimulation, the reflected light is shifted toward the longer wavelengths indicating a lessening of the depths of defects.
per group. One group was harvested at Day 3 to serve as a baseline, and the other four were divided into experimental groups: Untreated (-IL -S), Stimulated (-IL +S), Interleukin Treated (100 ng/ml human recombinant IL-1β (R & D Systems, Minneapolis, Minnesota) (+IL -S), and Interleukin Treated plus Stimulated (+IL +S). The relevant groups were stimulated for seven days beginning at Day 3; the media was changed every two days
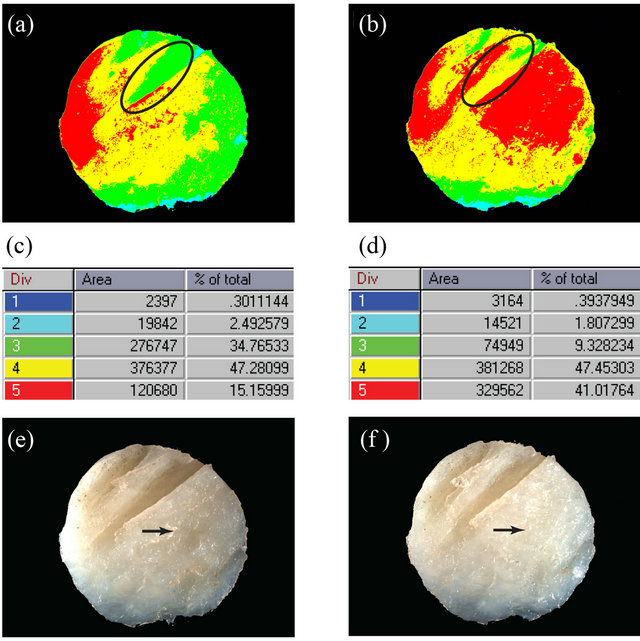
Figure 2. Spectrophotomicrographs (a), (b) and bright light photomicrographs (e), (f) of a single representative OA articular cartilage explant are shown before (a), (e) and after (b), (f) electrical stimulation. The tabular data (c), (d) show the numerical spectral data (Start and End) for each color, the pixel number for the total area of each color, and the percent of the total area represented by that color for the unstimulated (c) and stimulated (d) explants. An area of particular interest is circled in the upper spectrophotomicrographs (a), (b) indicating that the surface area is being restored. In the lower micrographs (e), (f), a different area indicated by an arrow is being restored. Final magnification for all micrographs = 16×.
and explants harvested at Day 10. For this study, the same compound signal was used for stimulation as reported previously [8] a capacitively coupled electric field of 20 mV/cm with a sine wave configuration at a frequency of 60 kHz was applied to the explant in each dish for thirty minutes at a 100% duty-cycle (to downregulate metalloproteinases); this was followed by a pulsed 50% duty cycle (one minute on/one minute off) that was on one hour and off five hours, four times per day (to up-regulate aggrecan and collagen type II mRNAs).
2.4. Biochemical Analysis
After the spectrophotomicrographs were taken, individual explants from the various Day 10 groups were washed with phosphate-buffered saline, cut into smaller pieces with a sharp blade, and digested with papain (Sigma-Aldrich) [12]. Each explant digest was analyzed for total DNA [13] (as an index of cell number), hydroxyproline [14] (as an index of collagen content), and hexosamine [15] (as an index of proteoglycan content). The biochemical values for each explant were normalized to the DNA content of that explant.
2.5. Statistical Analysis
The spectrophotometric data were analyzed several different ways. First, as an exploratory analysis, non-parametric Kruskal-Wallis tests were performed to test the overall association between treatment groups and the change in the area of each of the colors occurring over the seven days of the experiment. Second, an analysis of variance (ANOVA) was performed to compare the change in the individual color measurements from Day 3 to Day 10, taking into account the replication introduced by taking three photographs per explant. A separate ANOVA model was fit for each color, each including effects for day, treatment group, and the interaction between day and treatment group. Third, the Student t-test for unpaired data was used to compare the percent change of each colored area at Day 10 compared to the corresponding baseline value at Day 3. Finally, a meta analysis was performed using the hexosamine and hydroxyproline data obtained from this experiment and similar data obtained from four patient knees (one knee each from two females aged 61 and 73, and two knees from a male aged 73) from our previously reported experiment [8] to determine whether or not the two sets of data were comparable. A significant level of =0.05 was used for all statistical tests.
3. Results
There were negligible changes discernable either visibly or spectroscopically in the explants during the first three days of culture (not shown). Figure 2 shows data from a representative explant both before and after electric stimulation. Between Days 3 and 10 in culture, some structural changes occurring in electrically-stimulated cartilage explants could be seen by low power light microscopy. Before stimulation (Figure 2(e)), for instance, the surface of the cartilage showed two deep clefts in the upper portion of the explant, as well as a pit (arrow). After seven days of electrical stimulation (Figure 2(f)), these surface clefts were less distinct and the previously observed pit (arrow) could not be seen. On the other hand, these same changes viewed spectrophotometrically were quite dramatic (Figures 2(a) and (b), respectively). Note that in the light spectrum analysis (Figures 2(c) and (d)), the red (the longest wave length) area was on the surface, whereas the yellow, green, and blues (the shorter wave lengths) were on successively deeper levels. The percent of the total surface area each color represents was shown in the far right column in each rectangular box. Thus, in the explant shown, red represented 15% of the surface area before stimulation and 41% after stimulation—a 170% increase; whereas green, at the bottom of the two clefts, represented 34.7% of the area of the total cartilage before stimulation and only 9.3% after stimulation—a 73% decrease (Figures 2(c) and (d)). In other words, the defects were filling in from below; green areas became yellow and yellow areas became red.
The percent contribution of red-, yellow-, green-, light blue-, and dark blue-colored areas after seven days of stimulation (Days 3-10) for all explants is displayed graphically in Figure 3. Explants grown without IL-1β and without electric stimulation (-IL -S) showed nonsignificant changes at the end of these seven days of culture. When IL-1β was added to the medium but no electrical stimulation was applied to the culture dishes (+IL -S), there was a highly significant decrease in the red-colored area at the surface and a corresponding increase in the green-colored area deep in the explants. This signifies structurally that cartilage was removed from the surface of the explants (red-colored area decreased) exposing the deeper layers; the green and yellow areas correspondingly increased. The opposite happened to those explants exposed to the electric field only (-IL +S); specifically, the portion representing deep areas decreased significantly (both yellow and green) and the surface area (red) increased significantly. In the group of explants exposed
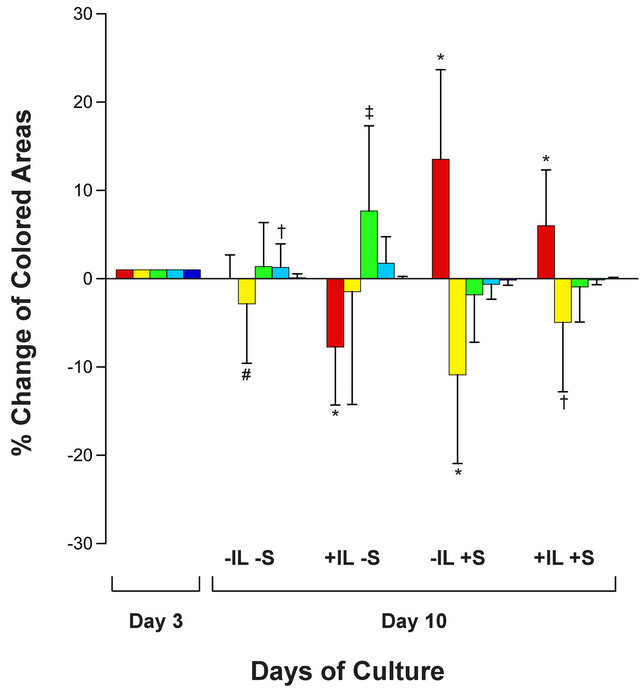
Figure 3. A bar graph shows the percent of the total area occupied by the red, green, yellow, light blue, and dark blue colors after 3 days (baseline) and after another 7 days of electrical stimulation for each of the four experimental groups: no interleukin-1β and no electrical stimulation (-IL -S); the presence of interleukin-1β with no electrical stimulation (+IL -S); no interleukin -1b plus 7-days electrical stimulation (-IL +S); and presence of interleukin-1β plus 7-days of electrical stimulation (+IL +S). Error bars represent the standard deviation. Unpaired Student’s t-tests were used to compare stimulated values to the corresponding baseline value for each color: *p ≤ 0.0001; ‡p < 0.0003; †p < 0.005; #p < 0.05.
to both IL-1β and electrical stimulation (+IL +S), the same phenomenon occurred (decrease in deep areas and increase in surface area), only to a lesser extent than when stimulation alone was present. It was concluded that electrical stimulation was attenuating the detrimental effects of IL-1β. Thus, Figure 3 graphically displays to what extent cartilage was being destroyed or reconstructed.
In addition to spectrophotometric data, the hydroxyproline and hexosamine contents of the cartilage explants were obtained. Meta analysis was performed by analyzing data obtained from the present study (2 knees, 2 patients) combined with corresponding data obtained from a larger study (4 knees, 3 patients) following the same experimental protocol [8]. The results (Figure 4) showed that during the seven days of treatment there was an increase in the hexosamine and hydroxyproline contents in the explants with the electric field alone that was highly significant (p ≤ 0.0002) as compared to the control explants without electric stimulation and in the absence of IL-1β (-IL -S vs. -IL +S). Stimulation in the presence of IL-1β (-IL -S vs. +IL +S) had an attenuating effect compared to the presence of IL-1β without electrical stimulation (-IL -S vs. +IL -S), but the results were not yet significant.
4. Discussion
This study showed that OA human explants cultured ex vivo undergo structural changes that can be detected quantitatively by means of spectrophotometric analysis over a short seven-day time period. In the untreated group, very little change occurred; but in the treated groups, the changes were dramatic. In the group subjected to the electric field alone, the filling in of both surface and deeper defects in the articulate cartilage was highly significant. In the group subjected to both the electric field and IL-1β, the filling in of both surface and deeper defects was also significant but, of course, not as significant as with the electric field alone. In the group subjected to IL-1β alone, there was a highly significant decrease in the surface area (red color) and increases in the deeper zones that were not quite significant, but, nevertheless, indicated that the cartilage architecture was being destroyed.
Thus, from spectrophotometric analysis alone, it appeared that structural changes can be seen and quantified in the OA human cartilage explant model employed in this study. The fact that there was also a significant increase in hexosamine (i.e., proteoglycan) and hydroxyproline (i.e., collagen) in the meta-analysis study in these same explants subjected to the electric field and to the electric field plus IL-1β is consistent with cartilage matrix filling in the defects and gaps.
What advantage does spectrophotometric analysis of
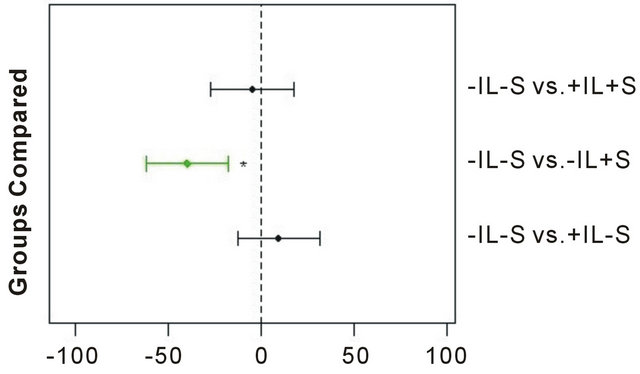 (a)
(a)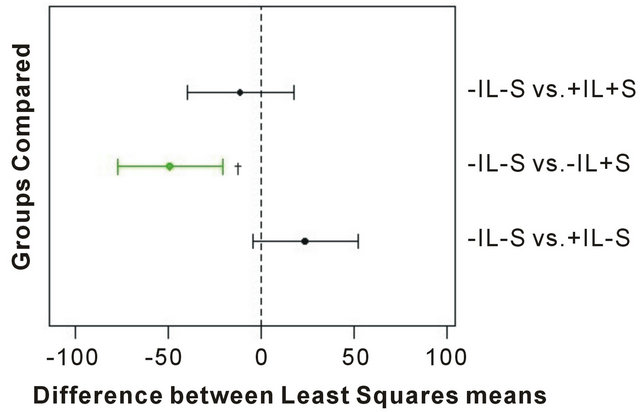 (b)
(b)
Figure 4. Meta analysis of biochemical results from treated OA cartilage explants. A total of 144 explants were analyzed for (a) hexosamine and (b) hydroxyproline, respectively, from three separate experiments. The numbers on the abscissa represent the difference between the least squares means between the two groups being compared, with the dashed vertical line indicating no difference. The horizontal error bars represent the confidence level for each difference; bars crossing the dashed line indicate that the difference is not significant. Statistically significant group comparisons are shown in green. *p < 0.0001; †p = 0.0002.
articular cartilage in studies such as ours confer over that of using routine histology? The main problem with histology is that one can never directly compare specific areas before stimulation with that same area after stimulation. Histology is inherently a destructive process whereby the tissue area of interest must be fixed, sectioned and stained before observation. Conversely, the spectrophotometric method was nondestructive and permitted direct comparison between untreated and treated areas within the same specimen.
To our knowledge this is the first published article to use reflectance spectrophotometric analysis to demonstrate visually the structural modification of OA in human articular cartilage explants. A morphological study [16] using histology, histochemical grading, and immunohistochemistry shows preservation of the articular cartilage and retardation of the development of OA lesions in Hartley guinea pigs exposed to a specific pulsed electromagnetic field beginning at twelve months of age and continuing daily for six months. This article does not discuss what the electric field would do in restoring or “modifying” OA in guinea pigs that already had OA at the start of the experiment. Also, it is difficult to determine from their study whether or not structural changes are actually being effected by the electric field. The pulsed electromagnetic signal that they used apparently preserves the morphology of the articular cartilage and retards the development of OA lesions, but does not restore structural morphology in cartilage that has already been partially destroyed. Finally, the six-month duration of stimulation in their guinea pigs is in sharp contrast to the seven days of capacitively coupled electrical treatment in the present study utilizing human OA cartilage plugs.
Several other studies report the use of various forms of electrical stimulation for relieving pain and improving function in patients with OA of the knee [17-22]. However, none of the studies cited show any evidence of actual healing of the OA or of structurally modifying the cartilage to a more normal configuration. It remains to be determined if the same cartilage modifications observed in the ex vivo explants exposed to capacitively coupled electric fields can be replicated in vivo in OA patients.
5. Acknowledgements
This work was funded from patent royalties paid to the Department of Orthopaedic Surgery and by a Sponsored Research Agreement between BioniCare Medical Technologies, Inc. (Sparks, MD) and the University of Pennsylvania. C.T.B., W.W and C.C.C. have received funding from BioniCare Medical Technologies, Inc., but BioniCare had no role in the study design, data collection, analysis or interpretation, or manuscript preparation. We thank Mary Leonard for the preparation of Figure 1.
REFERENCES
- W. M. Lai, D. D. Sun, G. A. Ateshian, X. E. Guo and V. C. Mow, “Electrical Signals for Chondrocytes in Cartilage,” Biorheology Vol. 39, 2002, pp. 39-45.
- V. C. Mow, C. C. Wang and C. T. Hung, “The Extracellular Matrix, Interstitial Fluid and Ions as a Mechanical Signal Transducer in Articular Cartilage,” Osteoarthritis and Cartilage, Vol. 7, No. 1, 1999, pp. 41-58. doi:10.1053/joca.1998.0161
- M. L. Gray, A. M. Pizzanelli, A. J. Grodzinsky and R. C. Lee, “Mechanical and Physicochemical Determinants of the Chondrocyte Biosynthetic Response,” Journal of Orthopaedic Research, Vol. 6, No. 6, 1988, pp. 777-792. doi:10.1002/jor.1100060602
- B. Schmidt-Rohlfing, U. Schneider, H. Goost and J. Silny, “Mechanically Induced Electrical Potentials of Articular Cartilage,” Journal of Biomechanics, Vol. 35, No. 4, 2002, pp. 475-482. doi:10.1016/S0021-9290(01)00232-9
- C. C.-B. Wang, X. E. Guo, D. Sun, V. C. Mow, G. A. Ateshian and C. T. Hung, “The Functional Environment of Chondrocytes within Cartilage Subjected to Compressive Loading: A Theoretical and Experimental Approach,” Biorheology, Vol. 39, No. 1-2, 2002, pp. 11-25.
- W. Wang, Z. Wang, G. Zhang, C. C. Clark and C. T. Brighton, “Up-Regulation of Cartilage Matrix Genes and Products by Electric Fields,” Clinical Orthopaedics and Related Research, Vol. 427S, 2004, pp. S163-S173. doi:10.1097/01.blo.0000143837.53434.5c
- C. T. Brighton, W. Wang and C. C. Clark, “Up-Regulation of Matrix in Bovine Articular Cartilage Explants by Electric Fields,” Biochemical and Biophysical Research Communications, Vol. 342, No. 2, 2006, pp. 556-561. doi:10.1016/j.bbrc.2006.01.171
- C. T. Brighton, W. Wang and C. C. Clark, “The Effect of Electric Fields on Gene and Protein Expression in Human Osteoarthritic Cartilage Explants,” Journal of Bone & Joint Surgery, Vol. 90, No. 4, 2008, pp. 833-848. doi:10.2106/JBJS.F.01437
- J. Xu, W. Wang, C. C. Clark and C. T. Brighton, “Signal Transduction in Electrically Stimulated Articular Chondrocytes Involves Translocation of Extracellular Calcium through Voltage-Gated Channels,” Osteoarthritis and Cartilage, Vol. 17, No. 3, 2009, pp. 397-405. doi:10.1016/j.joca.2008.07.001
- J. H. Kellgren and J. S. Lawrence, “Radiological Assessment of Osteo-Arthritis,” Annals of the Rheumatic Diseases, Vol. 16, 1957, pp. 494-502. doi:10.1136/ard.16.4.494
- J. Black, “Electrical Stimulation. Its Role in Growth, Repair, and Remodeling of the Musculoskeletal System,” Praeger Publishers, Westport, 1987.
- K. S. Rostand, J. R. Baker, B. Caterson and J. E. Christner, “Articular Cartilage Proteoglycans from Normal and Osteoarthritic Mice,” Arthritis & Rheumatism, Vol. 29, No. 1, 1986, pp. 95-105. doi:10.1002/art.1780290113
- C. Labarca and K. Paigen, “A Simple, Rapid, and Sensitive DNA Assay Procedure,” Analytical Biochemistry, Vol. 102, No. 2, 1980, pp. 344-352. doi:10.1016/0003-2697(80)90165-7
- B. R. Switzer and G. K. Summer, “Improved Method for Hydroxyproline Analysis in Tissue Hydrolyzates,” Analytical Biochemistry, Vol. 39, No. 2, 1971, pp. 487-491. doi:10.1016/0003-2697(71)90438-6
- R. Gatt and E. R. Berman, “A Rapid Procedure for the Estimation of Amino Sugars on a Micro Scale,” Analytical Biochemistry, Vol. 15, No. 1, 1966, pp. 167-171. doi:10.1016/0003-2697(66)90262-4
- D. M. Ciombor, R. K. Aaron, S. Wang and B. Simon, “Modification of Osteoarthritis by Pulsed Electromagnetic Field—A Morphological Study,” Osteoarthritis and Cartilage, Vol. 11, No. 6, 2003, pp. 455-462. doi:10.1016/S1063-4584(03)00083-9
- T. M. Zizic, K. C. Hoffman, P. A. Holt, D. S. Hungerford, J. R. O’Dell, M. A. Jacobs, et al., “The Treatment of Osteoarthritis of the Knee with Pulsed Electrical Stimulation,” Journal of Rheumatology, Vol. 22, No. 9, 1995, pp. 1757-1761.
- J. Farr, M. A. Mont, D. Garland, J. R. Caldwell and T. M. Zicic, “Pulsed Electrical Stimulation in Patients with Osteoarthritis of the Knee: Followup in 288 Patients Who Had Failed Non-Operative Therapy,” Surgical Technology International, Vol. 15, 2006, pp. 227-233.
- M. A. Mont, D. S. Hungerford, J. R. Caldwell, P. S. Ragland, K. C. Hoffman, Y. D. He, et al., “The Use of Pulsed Electrical Stimulation to Defer TKA in Patients with Osteoarthritis of the Knee,” Orthopedics, Vol. 29, No. 10, 2006, pp. 887-892.
- D. H. Trock, A. J. Bollet, R. H. Dyer Jr., L. P. Fielding, W. K. Miner and R. Markoll, “A Double-Blind Trial of the Clinical Effects of Pulsed Electromagnetic Fields in Osteoarthritis,” Journal of Rheumatology, Vol. 20, No. 3, 1993, pp. 456-460.
- D. H. Trock, A. J. Bollet and R. Markoll, “The Effect of Pulsed Electromagnetic Fields in the Treatment of Osteoarthritis of the Knee and Cervical Spine. Report of Randomized, Double Blind, Placebo Controlled Trials,” Journal of Rheumatology, Vol. 21, No. 10, 1994, pp. 1903-1911.
- P. Nicolakis, J. Kollmitzer, R. Crevenna, C. Bittner, C. B. Erdogmus and J. Nicolakis, “Pulsed Magnetic Field Therapy for Osteoarthritis of the Knee—A Double-Blind Sham-Controlled Trial,” Wiener Klinische Wochenschrift, Vol. 114, No. 15-16, 2002, pp. 678-684.