Open Journal of Composite Materials
Vol.4 No.1(2014), Article ID:41983,6 pages DOI:10.4236/ojcm.2014.41005
Effects of Fiber Volume on Modal Response of Through-Thickness Angle Interlock Textile Composites
![]()
1mv2space, LLC, Boulder, USA; 2Department of Aerospace Engineering, University of Kansas, Lawrence, USA.
Email: mvillaaway@gmail.com, rhale@ku.edu, mewing@ku.edu
Copyright © 2014 Marco Villa et al. This is an open access article distributed under the Creative Commons Attribution License, which permits unrestricted use, distribution, and reproduction in any medium, provided the original work is properly cited. In accordance of the Creative Commons Attribution License all Copyrights © 2014 are reserved for SCIRP and the owner of the intellectual property Marco Villa et al. All Copyright © 2014 are guarded by law and by SCIRP as a guardian.
Three-Dimensionally; Woven; Textile; Interlaminar; Weaviness; Dynamic; Damping
Received July 30th, 2013; revised August 30th, 2013; accepted September 6th, 2013
KEYWORDS:
ABSTRACT
Prior static studies of three-dimensionally woven carbon/epoxy textile composites show that large interlaminar normal and shear strains occur as a result of layer waviness under static compression loading. This study addresses the dynamic response of 3D through-thickness angle interlock textile composites, and how interaction between different layer waviness influences the modal frequencies. The samples have common as-woven textile architecture, but they are cured at varying compaction pressures to achieve varying levels of fiber volume and fiber architecture distortion. Samples produced have varying final cured laminate thickness, which allows observations on the influence of increased fiber volume (generally believed to improve mechanical performance) weighed against the increased fiber distortion (generally believed to decrease mechanical performance). The results obtained from this study show that no added damping was developed in the as-woven identical panels. Furthermore, a linear relation exists between modal frequency and thickness (fiber volume).
1. Introduction
When considering how wavy layers interact with one another in a 3D textile composite, and how such layers might alter overall laminate mechanical properties, one can expect difficulties in studying the dynamic behavior of such textile composites. Waved layers will create interlaminar stresses and strains, which may vary the geometry of the unit cell of the laminate, increasing the damping and causing variations in the dynamic response. To obtain significant data, instead of fabricating and analyzing a costly series of samples, finite element models can be used to predict the behavior under different scenarios. The required number of degrees of freedom for models to accurately capture the possible geometry variations, fiber distortion and contact among adjacent fiber tows is unknown, and it will vary with assumptions for the tow geometry. As such, the analytical approach is also expensive in terms of required modeling time. Simpler analytical models will enable less expensive studies on dynamic behavior. In order to determine how detailed a model should be, experimental data and analytical data are compared.
Panels for experimental characterization have been supplied by Albany International Techniweave, Inc. The fiber architecture is a through thickness angle-interlock weave in which the fibers traverse completely through the thickness of the fiber perform. The through-the-thickness fiber angles were measured as approximately 40˚ in the central portion of the composite cross-section, and approximately 63˚ on the edges (Figure 1).
The three IM7/PR520 panels, identified as panel02, panel03 and panel04, had identical as-woven geometry but, due to different compaction and cure pressures, exhibit different fiber volumes and different thickness (Table 1).
Due to the most prominent assumption in micromechanics of composite materials, which formulates strain compatibility at the fiber-matrix interface, each stiffness parameter is directly related to the fiber volume [1] and
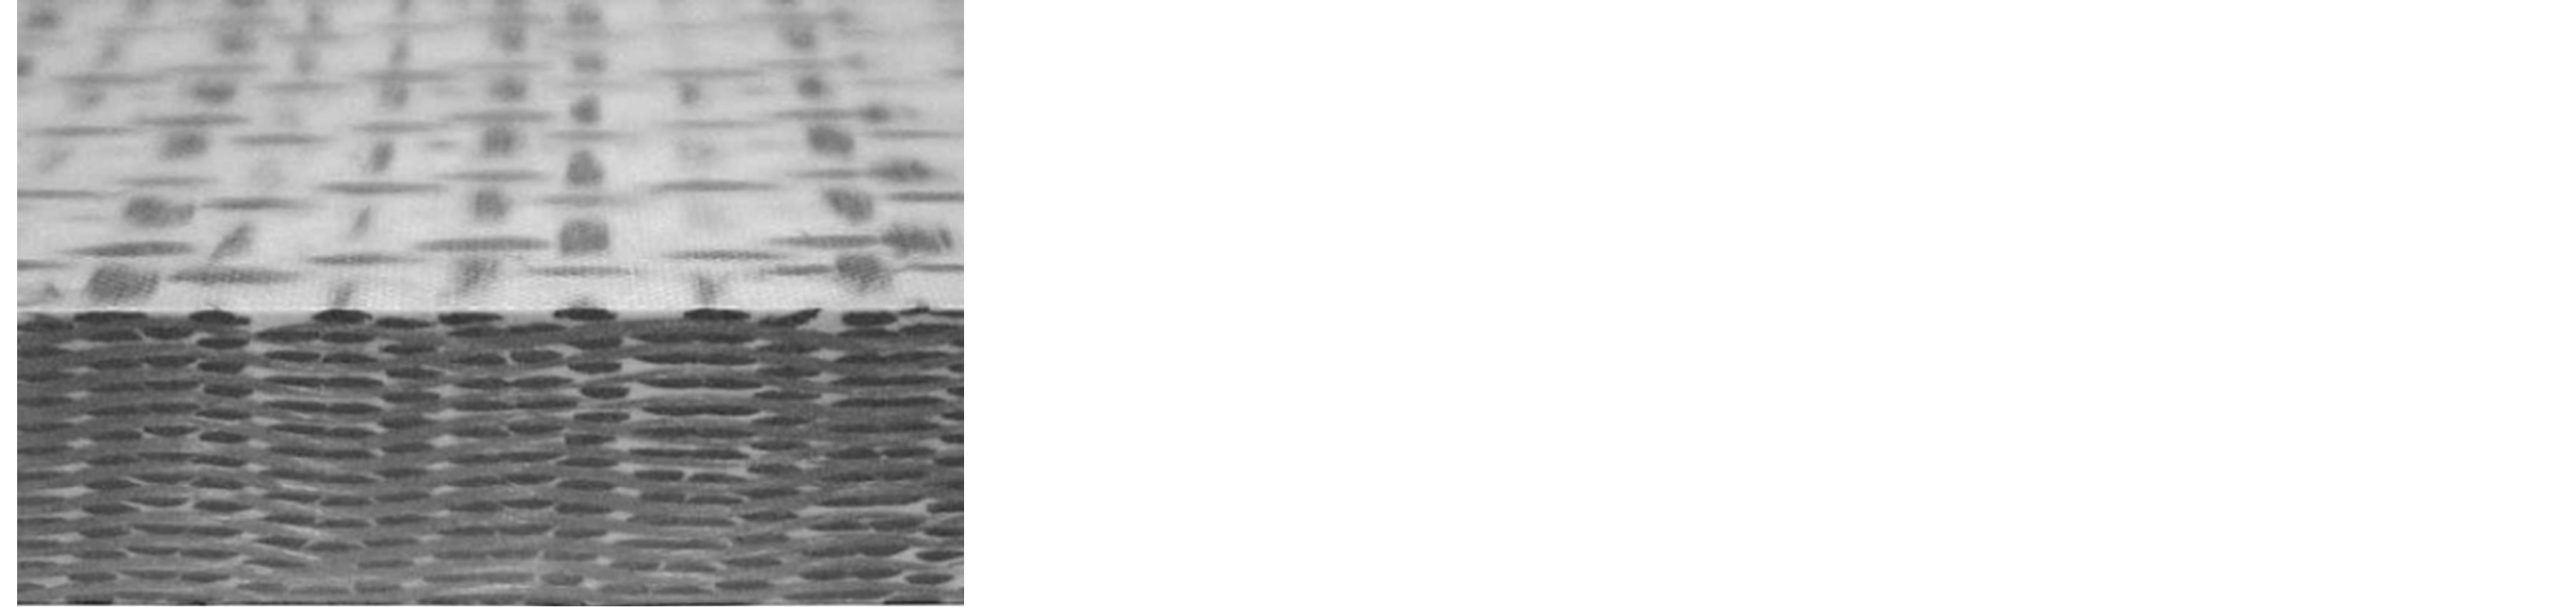
Figure 1. Section of panel02, through-thickness angle interlock.
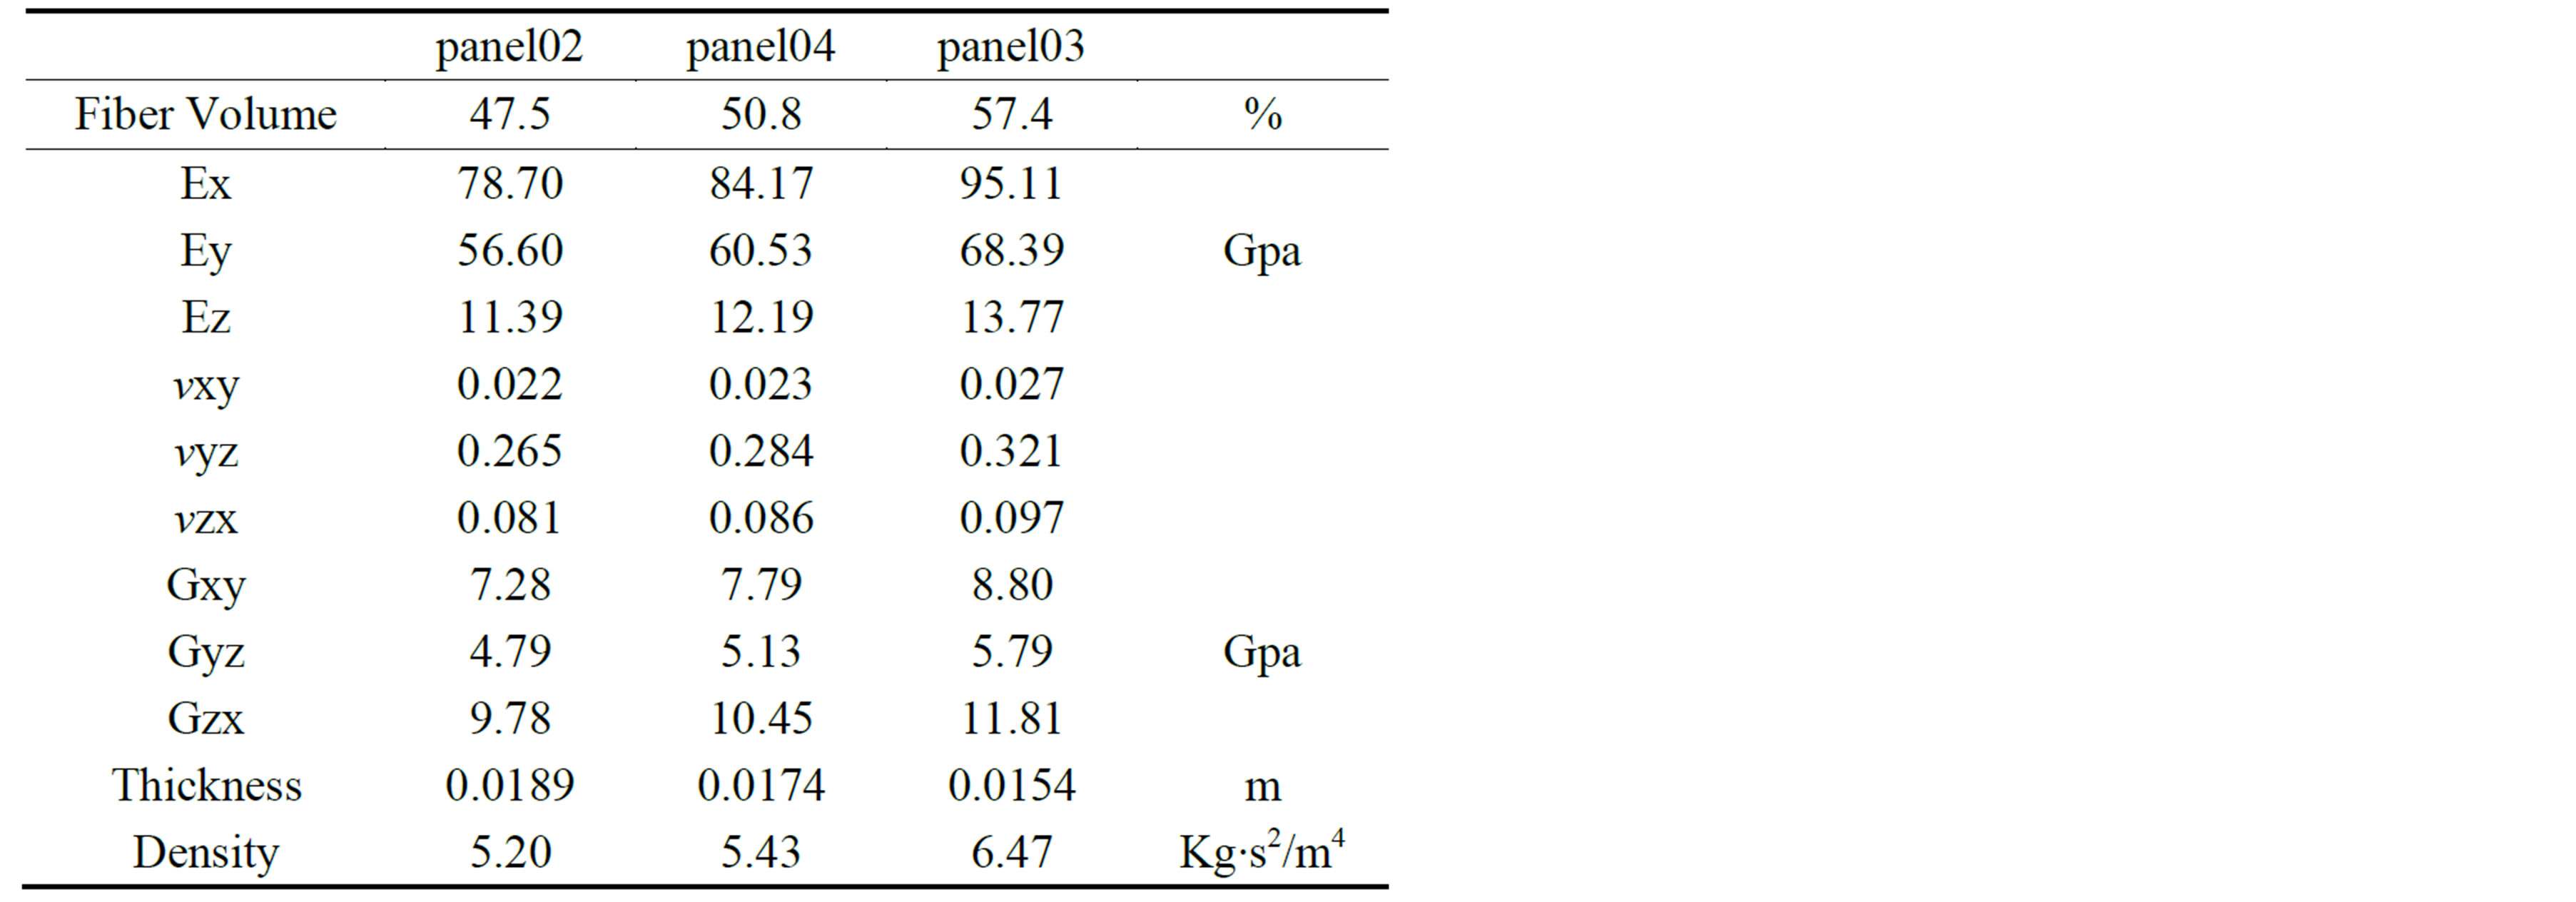
Table 1. IM7/PR520 predicted panel material properties [2].
so it is possible to determine the equivalent orthotropic properties.
Because of the known idealized as-woven geometry of the samples, it has been possible to focus the attention on understanding if the increased fiber (tow) distortion at higher cure pressure affects the dynamic response of the panels.
The study is divided in two different steps. Initially, based on a modal analysis, the accuracy of the analytical model is determined. As a second step, the main problem is addressed and the influence of the curing pressure (or fiber volume) is studied.
2. Experimental Analysis
2.1. Experiment Setup
The structural modes of the composite panels were found experimentally using a Scanning Laser Vibrometer (Figure 2), which gathers vibration information by detecting the laser Doppler shift and using it to measure the velocity of the object’s surface. The system consists of a scanning head and a control/processing computer (which controls the scanning head and evaluates the data retrieved). The measurement data is digitally recorded in the workstation where software controls the data acquisition and offers user-friendly functions to evaluate the measurement data.
The panel was suspended on two nylon strings to simulate unconstrained conditions (Figure 3). Under the panel was a noise source consisting of an insulated speaker box with a noise outlet tube. This allowed the generated sound pressure to be concentrated on a small area of the panel.
2.2. Procedure
The procedure for the initial step of the experiment consisted of identifying frequencies that produce a large response and then scanning the panel at those frequencies to individuate the modal shapes.
To identify the frequencies, a single point on the panel was scanned while a periodic chirp was generated. The periodic chirp was setup to sweep the frequencies from zero to four thousand Hertz. This range has been chosen to allow the determination of at least six modal frequencies, considered enough to qualify the dynamic response of the model. From this scan, the software was able to produce a digital Fourier transform (DFT). From this DFT the frequencies producing the largest responses were noted (Figure 4).
One scan of the entire panel was then made for each of the resonant frequencies noted. From this scan a collection of the first six vibration modes of the panel were identified (Figure 5). The above procedure was conducted for all three composite panels.
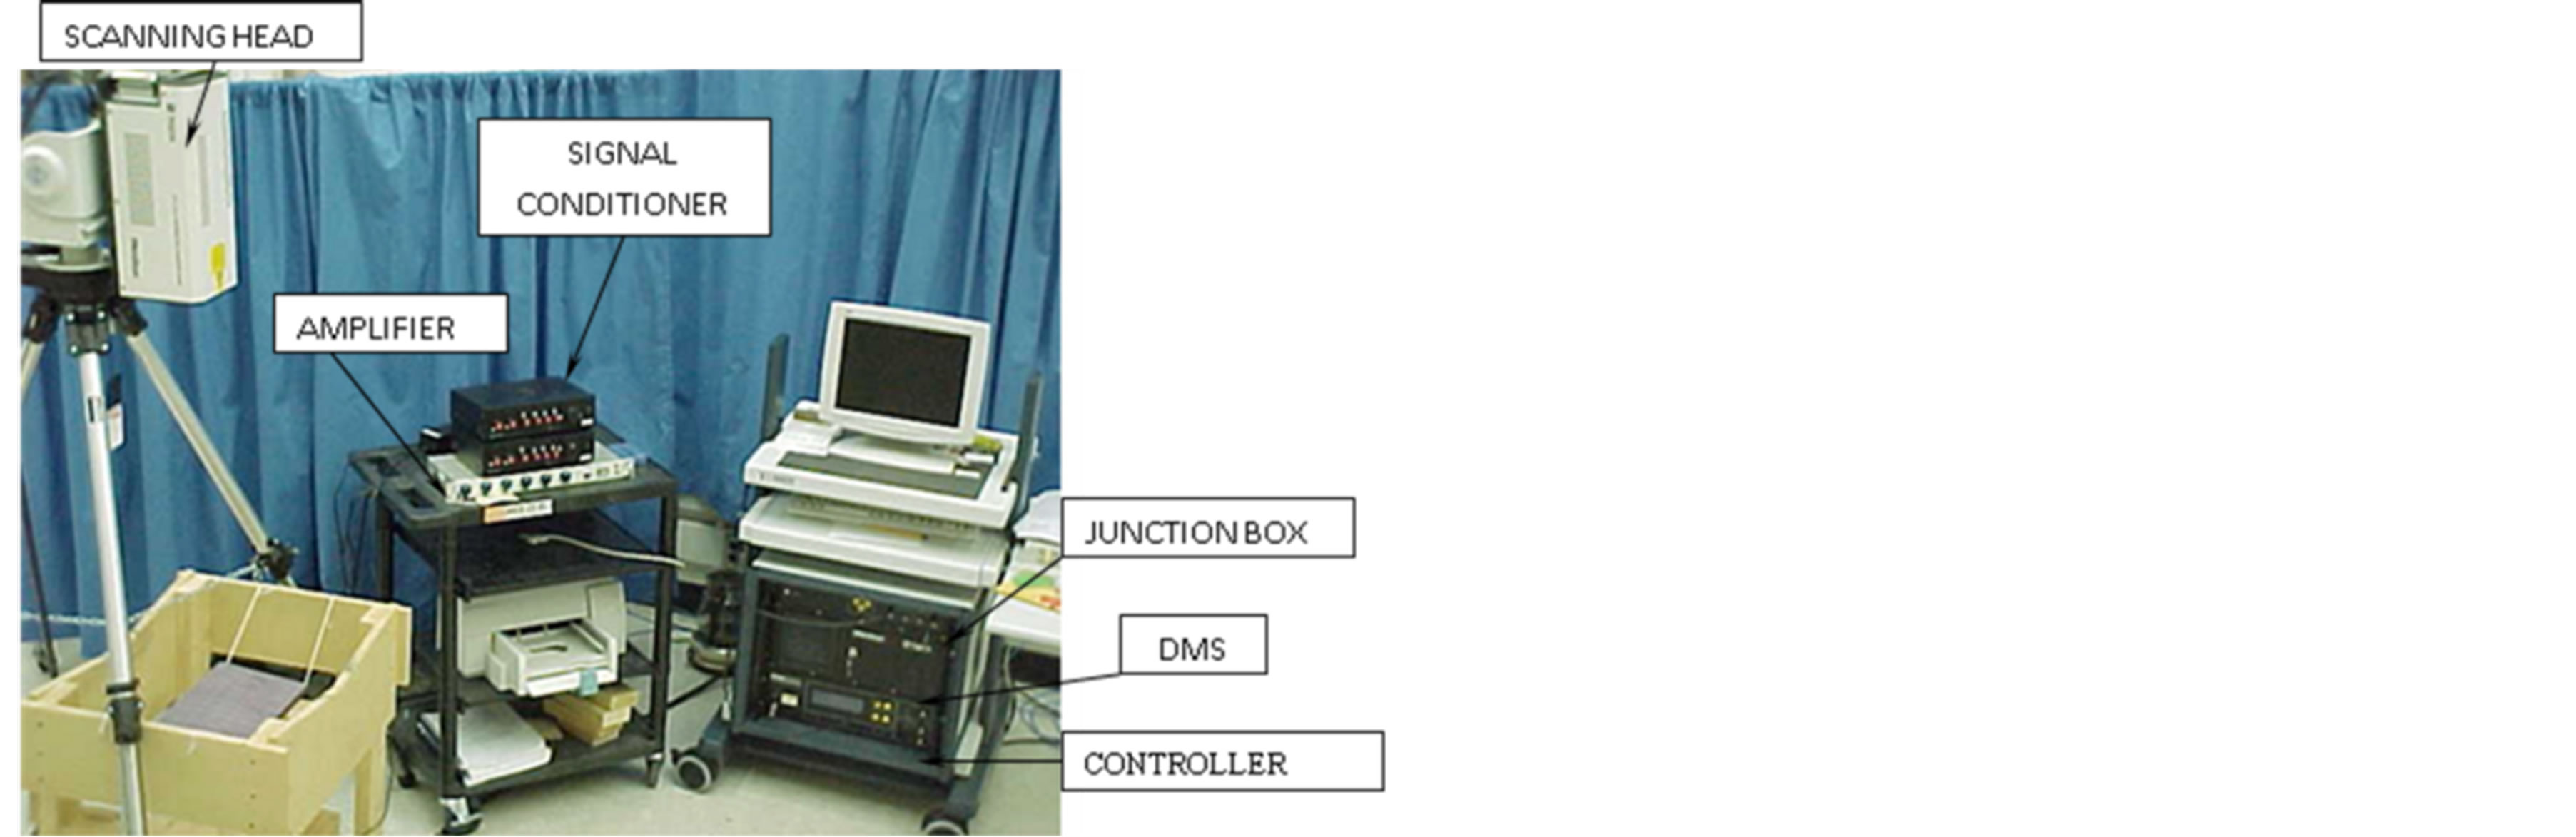
Figure 2. Experiment setup.
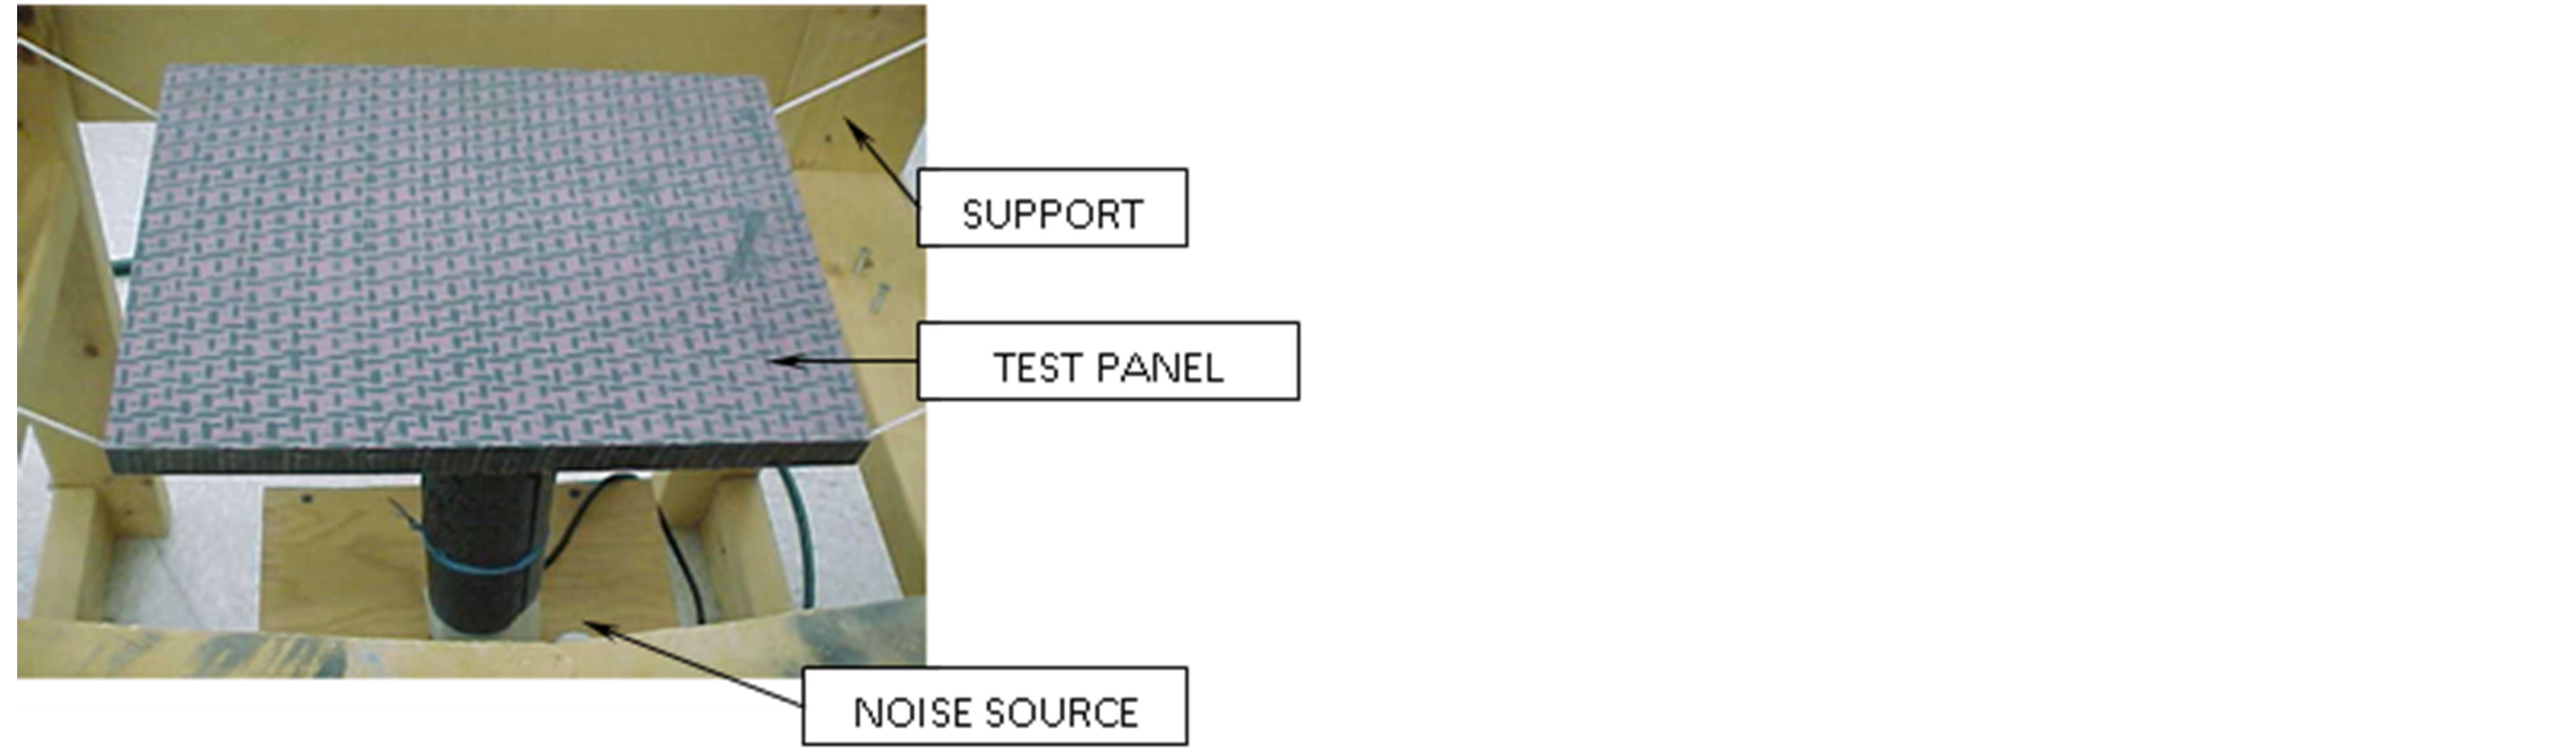
Figure 3. Panel support setup.
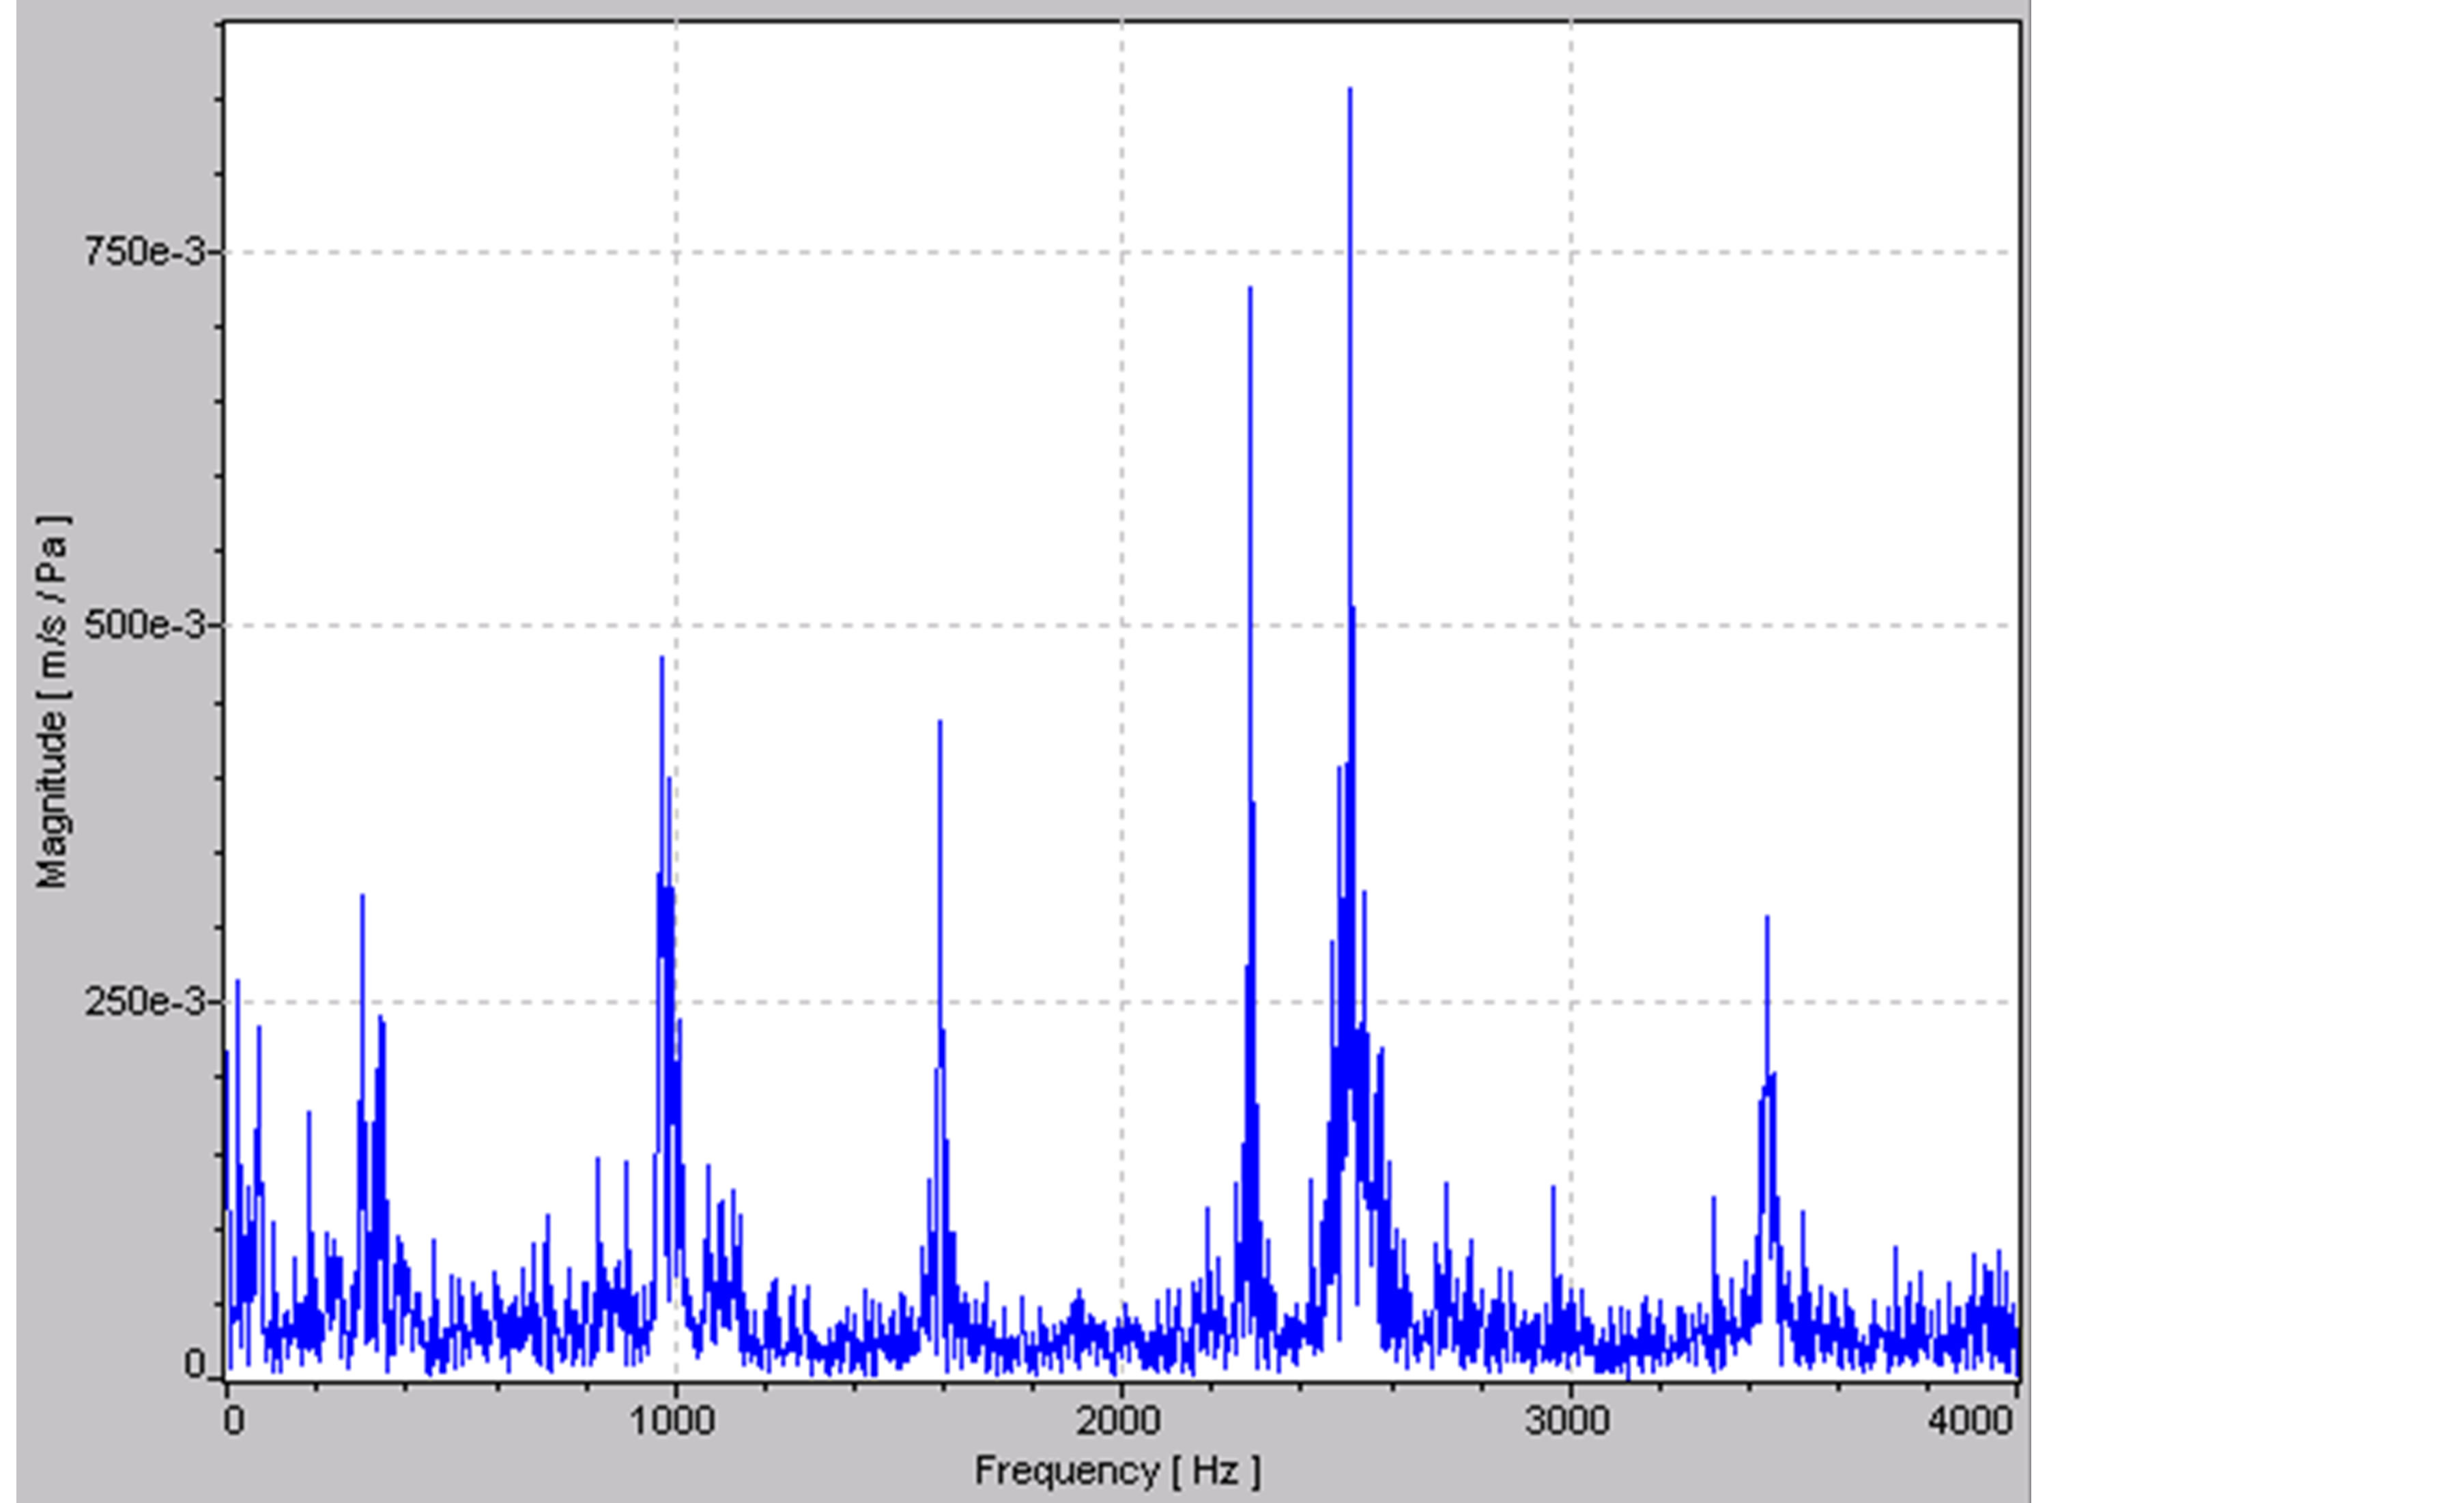
Figure 4. Digital Fourier transform for panel02.
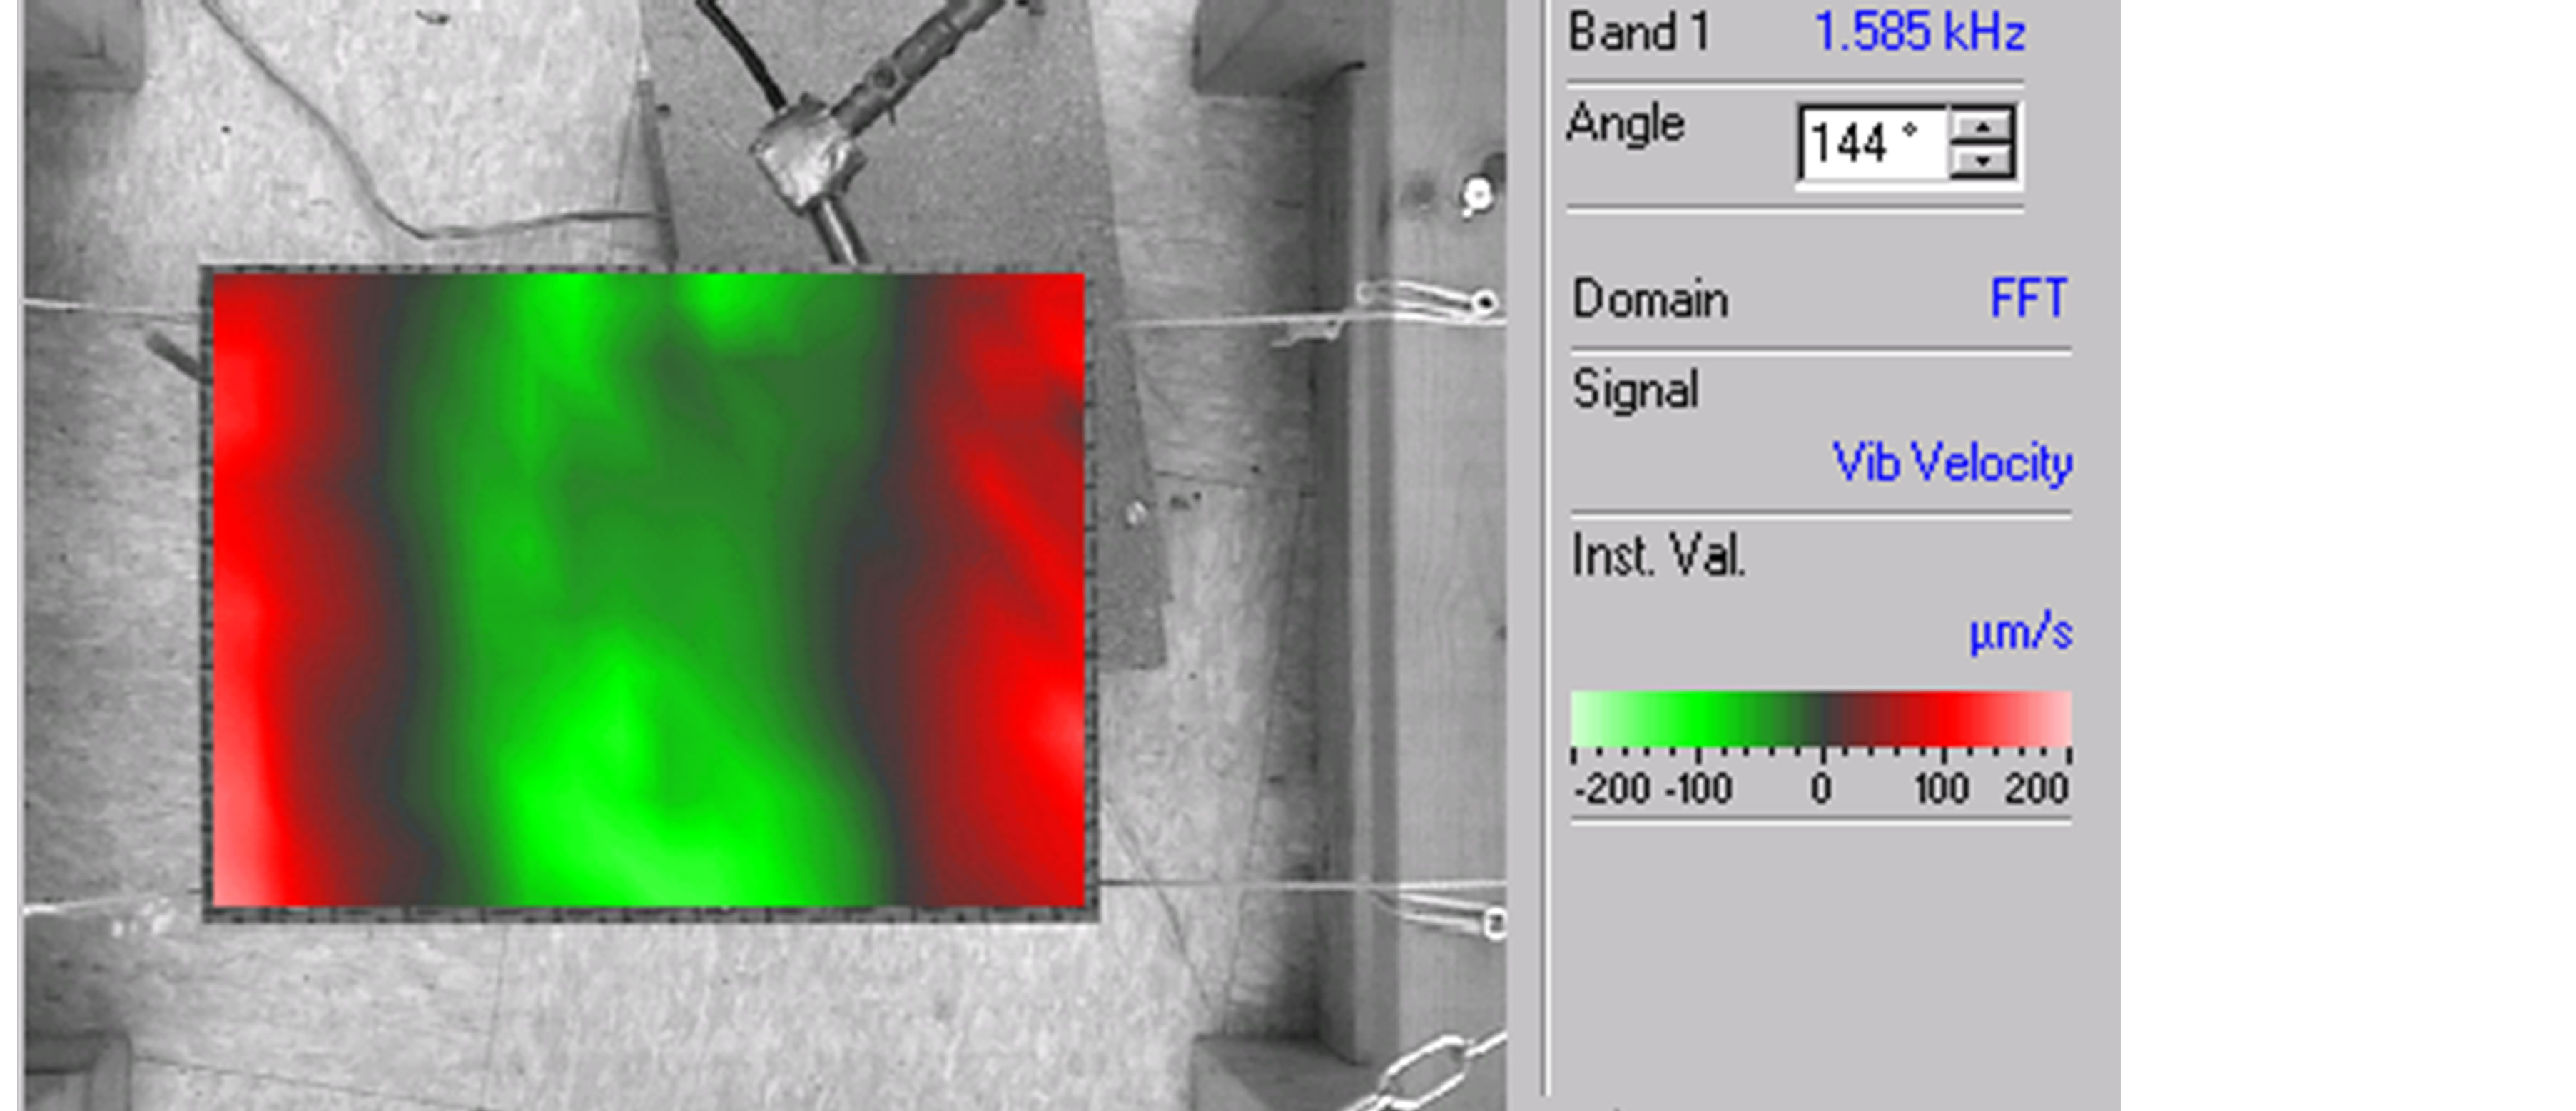
Figure 5. Instant vibration velocities for panel02 at 1585 Hz (third modal frequency).
3. Analytical Analysis
Finite Element Model
There are different possibilities to create a finite element model that is representative of a 3D textile composite laminate. Models range from 2D approximations neglecting through the thickness properties to full 3D models of individual tows in the as-cured configuration. The latter is a complex reproduction of the as-cured tow architecture that is neither random nor controlled.
Here we consider two possibilities for modeling the 3D textile (Figure 6):
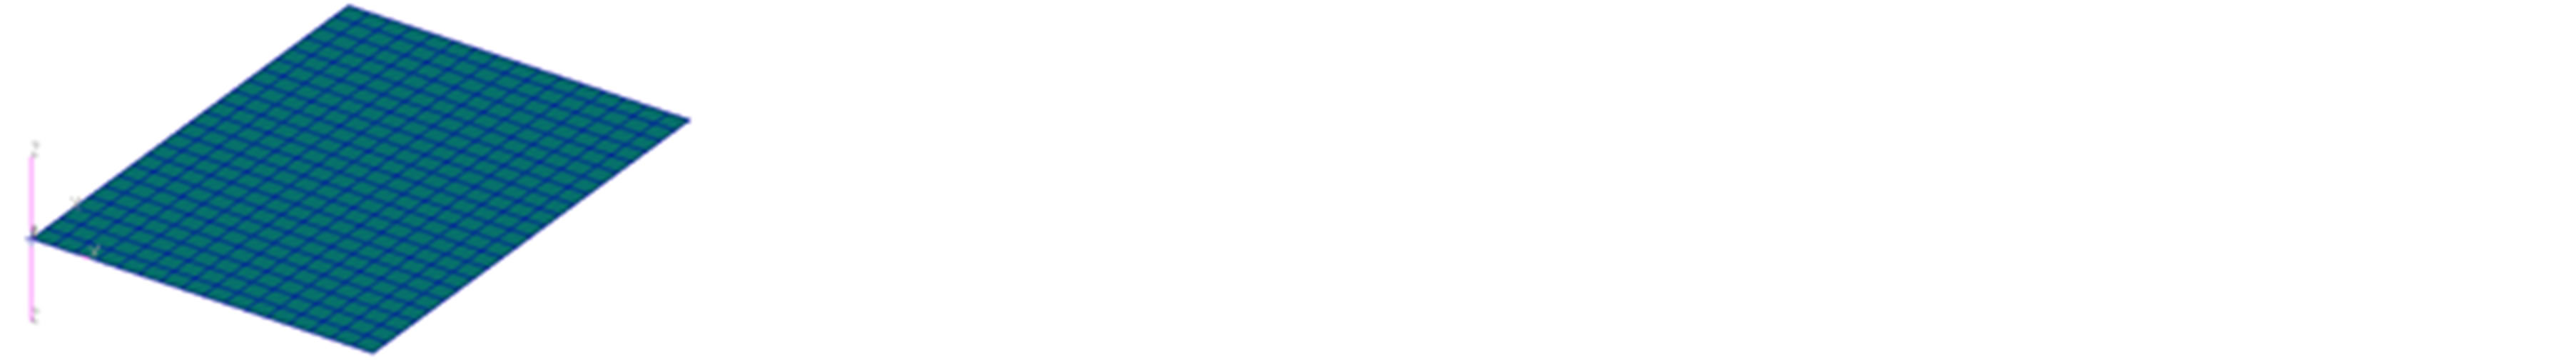
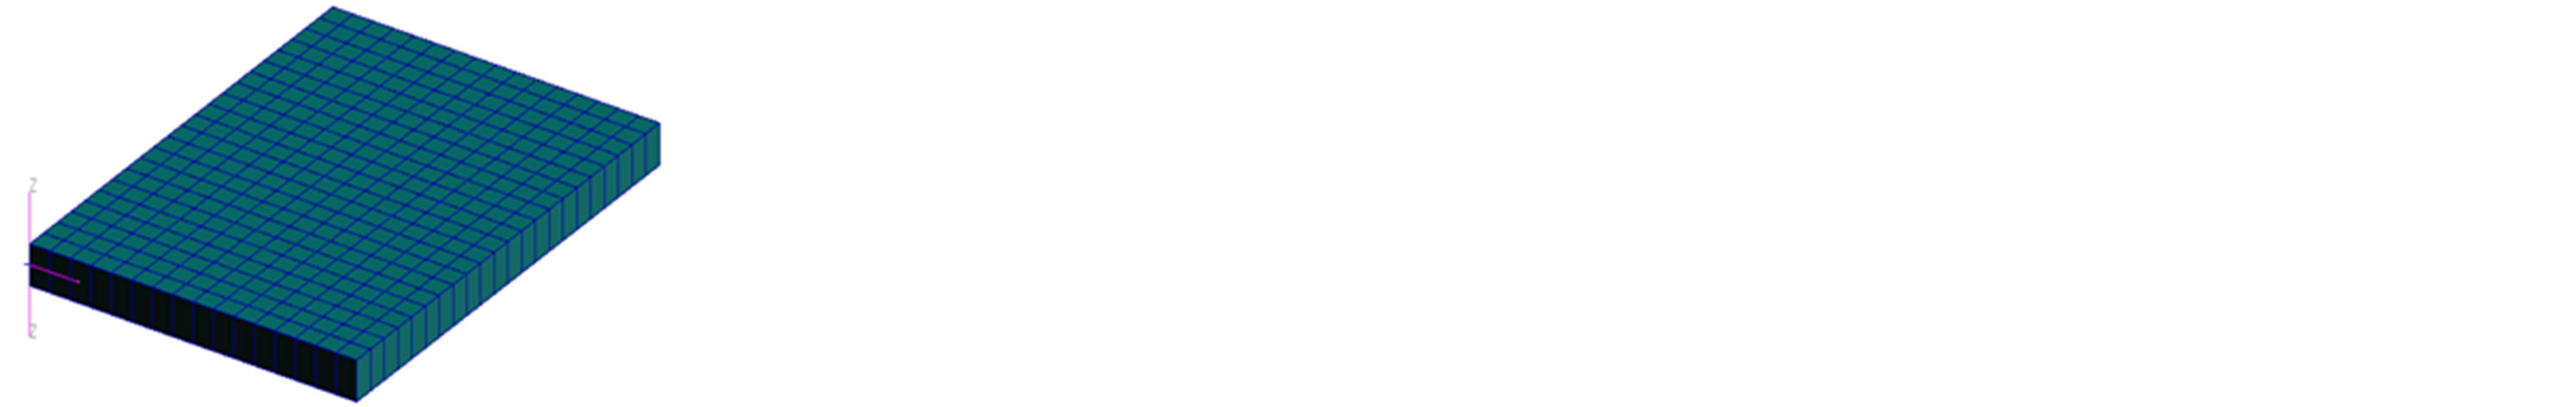
Figure 6. 2D and quasi-3D models.
• 2D model—the composite panels have been considered as a stacking sequence of 24 layers with effective 2D orthotropic properties. This is the simplest model where the through the thickness effects are considered to be negligible.
• Quasi-3D model—the panels have been considered as solid elements with effective 3D orthotropic properties.
Both models are 8 × 11 inches (20.32 × 27.94 cm), and there are 352 elements each with dimensions 0.5 × 0.5 inches, giving an adequate level of discretization (2400 and 19,000 degrees of freedom, respectively).
For each model, three panels have been created: Panel 02, 03 and 04, which differ in thickness, fiber volume and mechanical properties, as described in the introduction and as delineated in Table 1.
If neither of these two approaches showed a good relation to the experimental laminate, then a more complex model would need to be created, focusing on the reproduction of the contact regions between fiber tows and the related deformations in tow geometry. However, if there are not significant differences between the two models, we can assume that in first approximation the deformation effects, due to different fiber distortions, can be neglected for dynamic response.
4. Results
Initially, experimental results and finite element results have been compared to determine whether or not any relation can be found between the first six modes. All three panels are shown to respond with the same mode shapes, but at different frequencies. As an example, the sixth mode shapes of the experimental (3D presentation and scanning head camera), and both the 2D and quasi- 3D analytical models of panel02 are shown in Figure 7. Note that each representation describes the same modal shape.
When comparing the modal frequencies (Figures 8-10), it is possible to note that both 2D and Quasi-3D FEA models give a good approximation (+/− 10%) of the experimental results, although the Quasi-3D FEM is generally superior at higher frequencies. None of the models give a consistently higher or lower value of frequency, so the type of model to be used must be decided case by case.
On the basis of the above results, it has been determined that when the dynamic aspects of a 3D textile composite panel are under investigation, the geometry variations and the contact non-linearity can initially be neglected. As such, added damping from interaction of individual tows with further fiber architecture distortion is believed to be small for panel dynamic response.
Having proven that simplified analytical models may be used to give a good approximation of the modal response for the as-cured 3D textile panels, the relation between modal frequencies and fiber volume (thickness) is now shown.
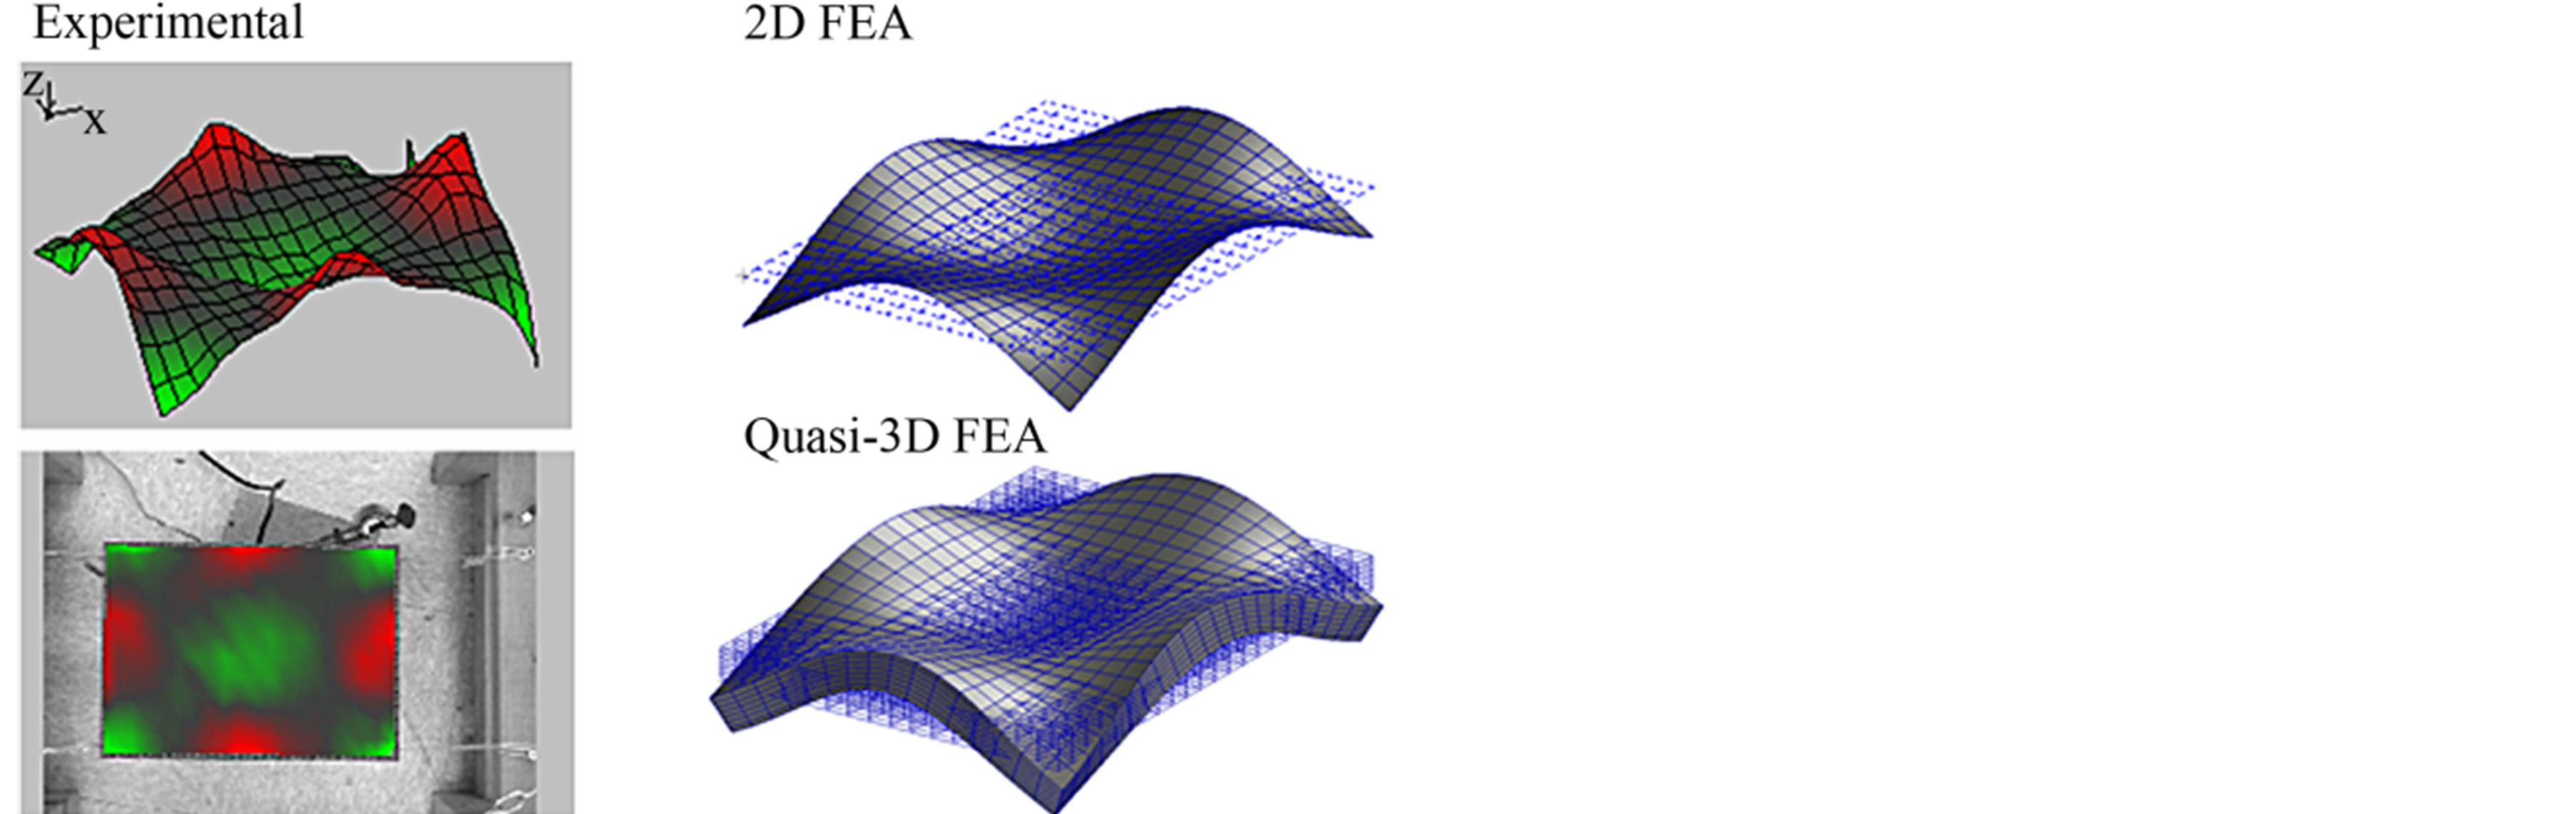
Figure 7. Panel02, sixth modal shape.
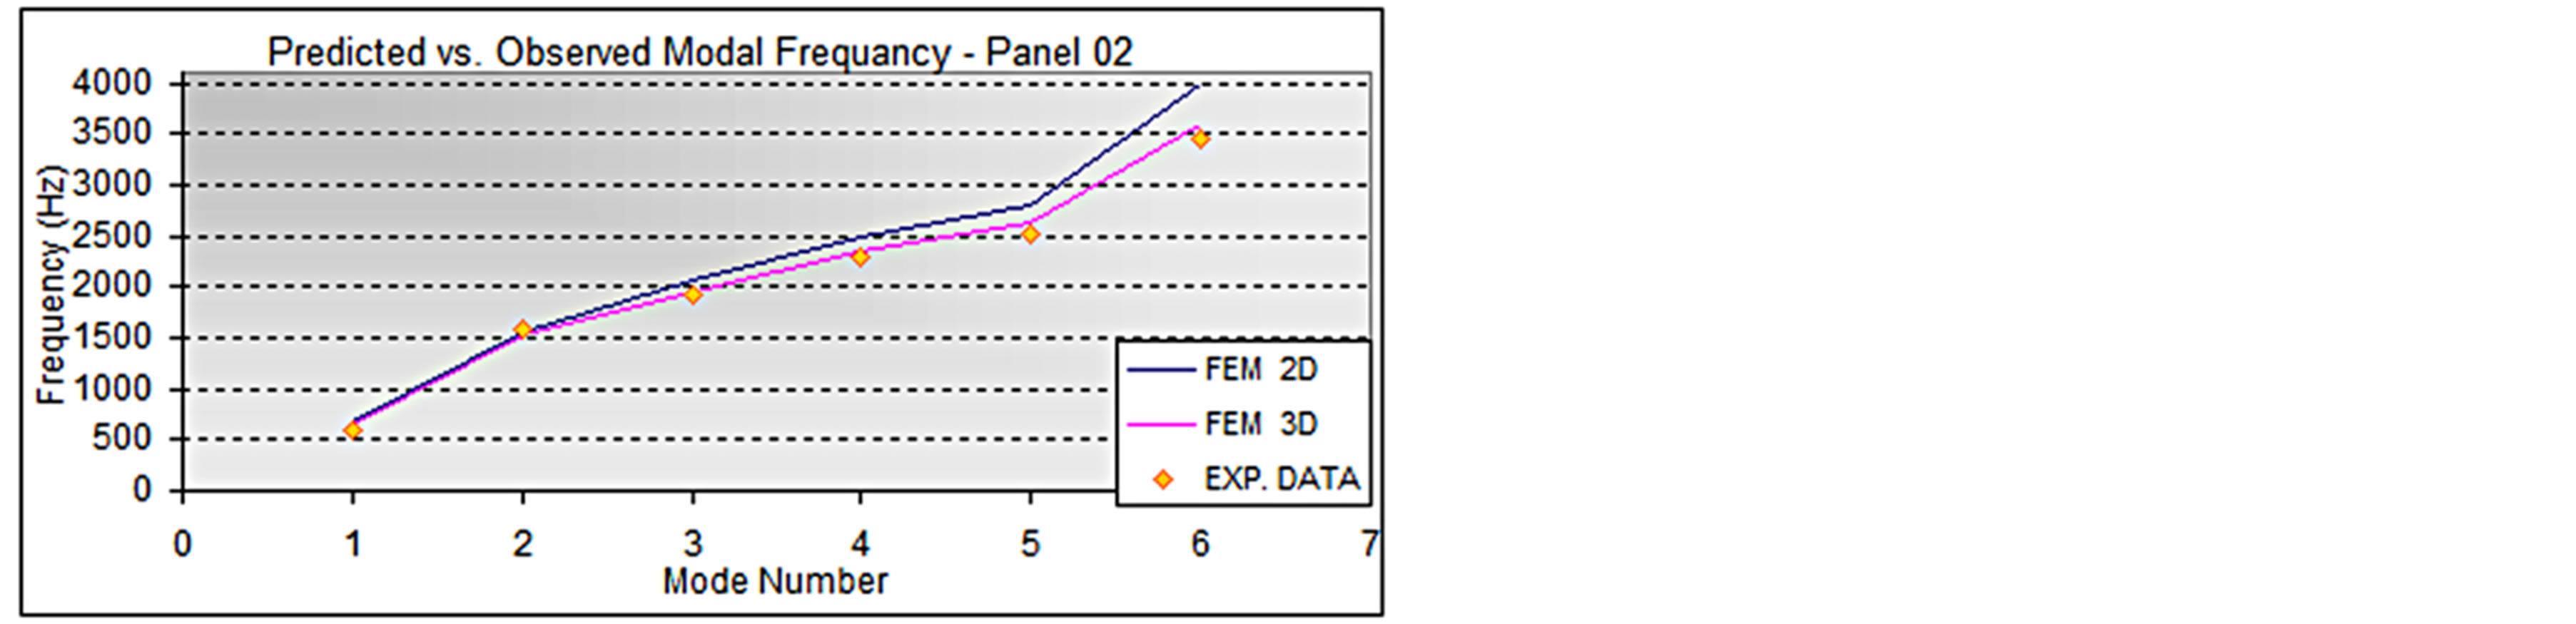
Figure 8. Predicted versus observed modal frequency, panel02.
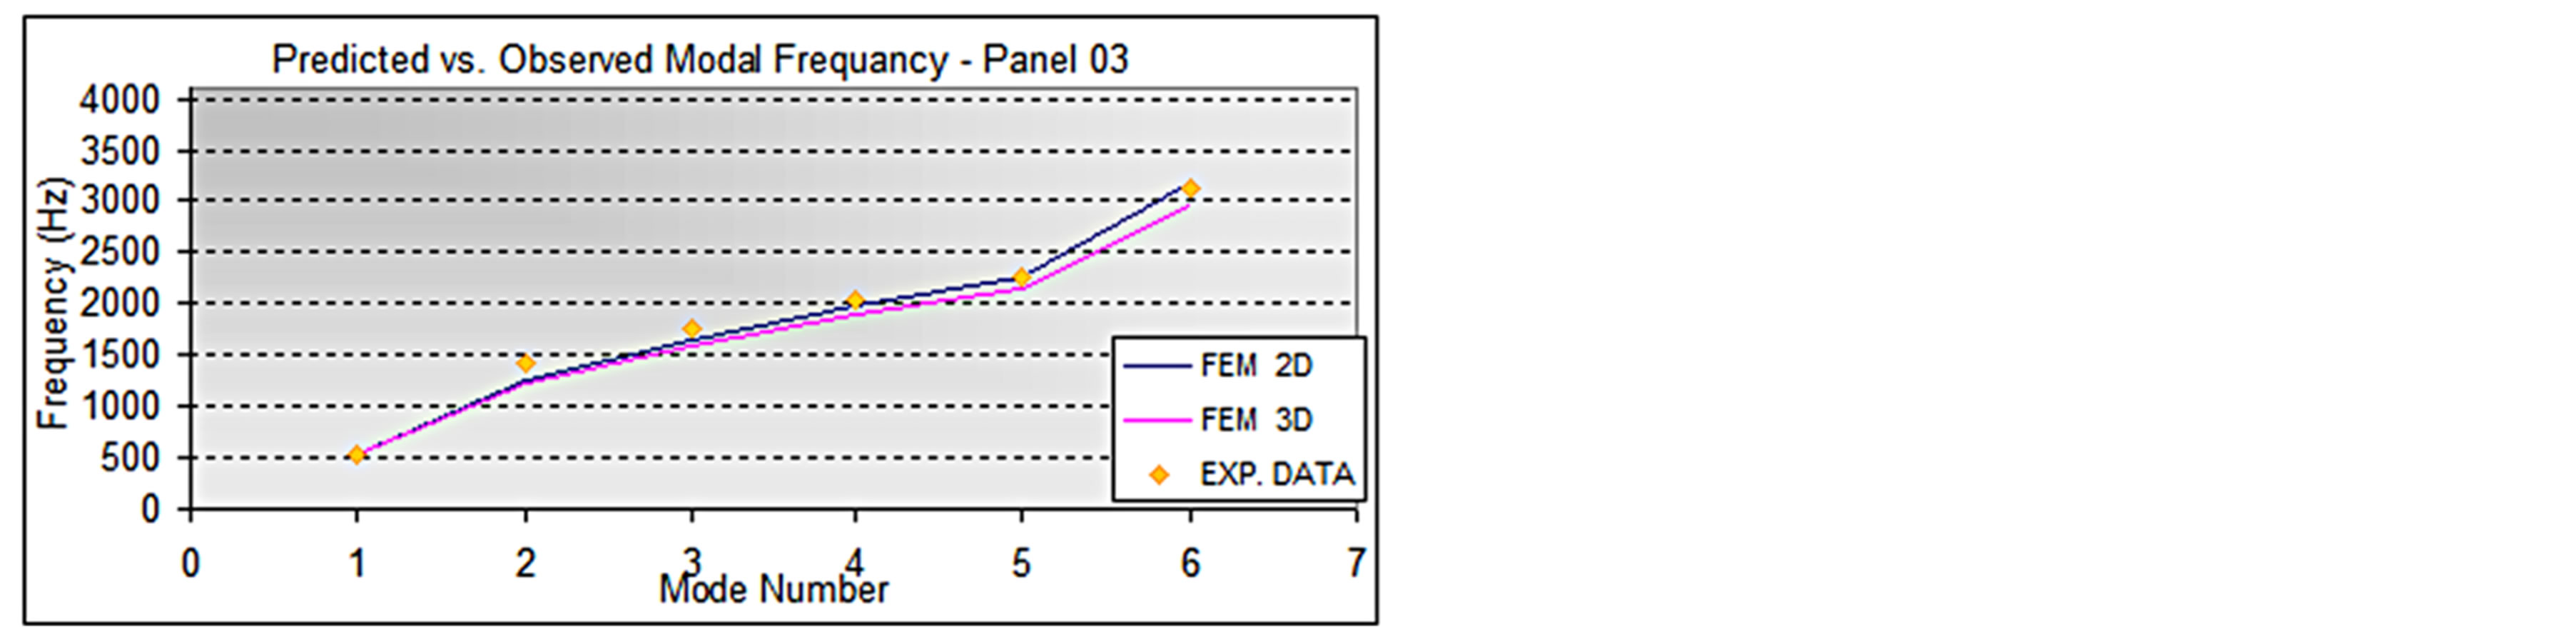
Figure 9. Predicted versus observed modal frequency, panel03.
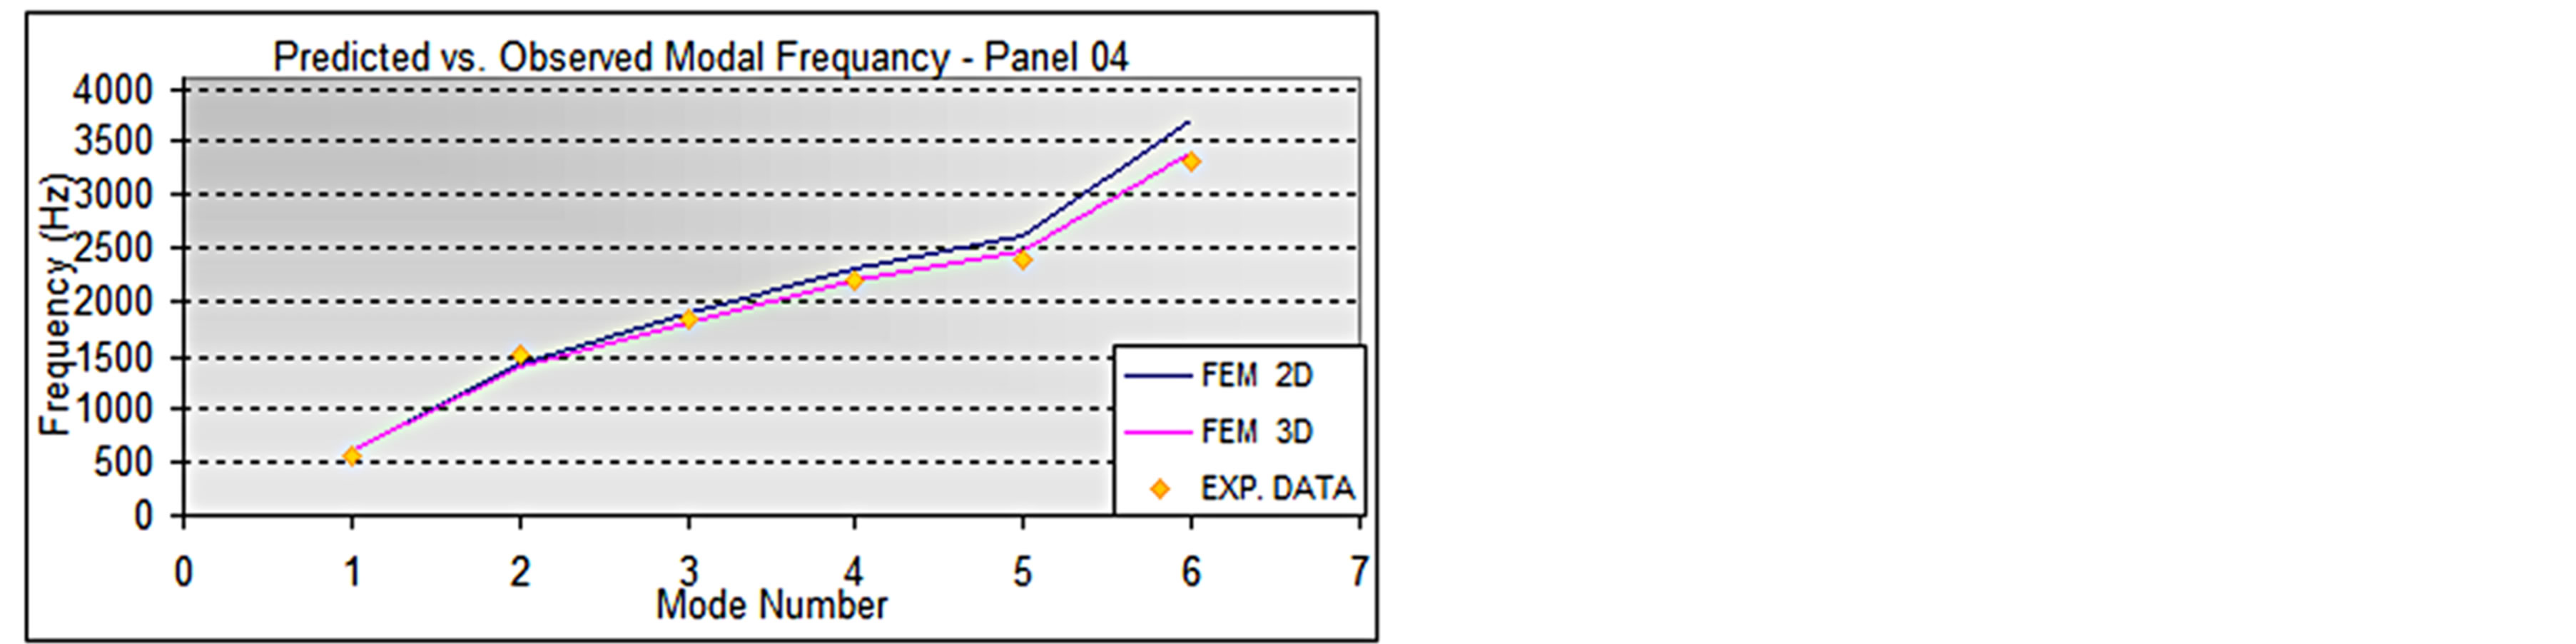
Figure 10. Predicted versus observed modal frequency, panel04.
When confronting the frequency values obtained from the experiment (Figure 11), a relationship between modal frequency and panel fiber volume is evident.
When approximated with a linear equation, all six curves in the figure above have a coefficient of determination value close to 1 (max 0.9991), so it is reasonable
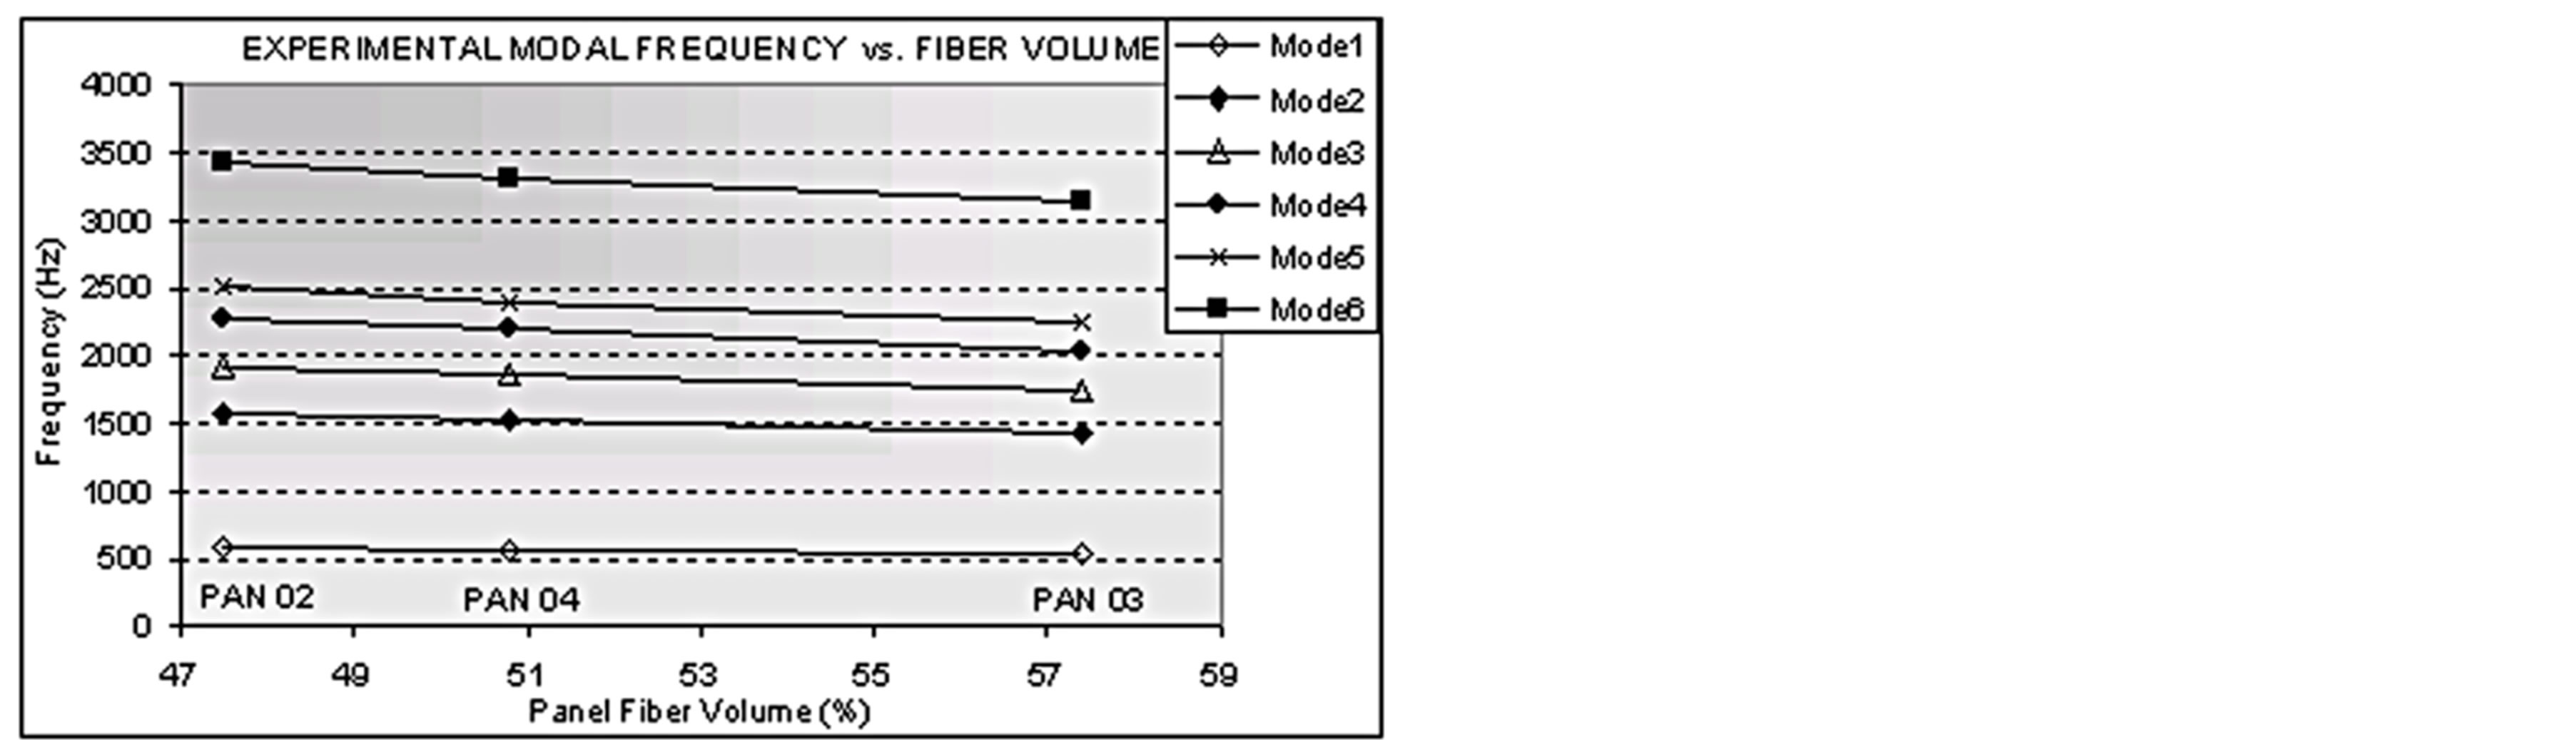
Figure 11. Experimental modal frequencies.
to state that, for the panels analyzed, the frequency is a linear function of the fiber volume.
Figures 12 and 13 show these relations for the analytical study with 2D and quasi-3D models.
As with the experimental data, the analytical data also show a linear relation between modal frequencies and fiber volume. For the first 8 modes, for both 2D and quasi-3D models, the coefficient of determination value for a linear approximation is always higher than 0.9994. At higher vibration modes, the relation varies, and further study should be performed to determine the causes for this.
This confirms that a first approximation dynamic study can be performed using simple analytical models to approximate more complicated as-cured geometry, since the fiber deformation does not have a high influence on the result. As such, simplified unit-cell analytical models, obtained using effective homogeneous properties, are appropriate for this analysis.
5. Discussion of Results
When analyzing the relation between fiber volume and thickness among the three panels, once again, there is a linear relation (R2 = 0.9884), as shown in Figure 14.
The following study is to determine if it is possible to reproduce the frequencies using an equation that considers thickness as the main variable. As a first approximation, the equation for isotropic material is [3]:
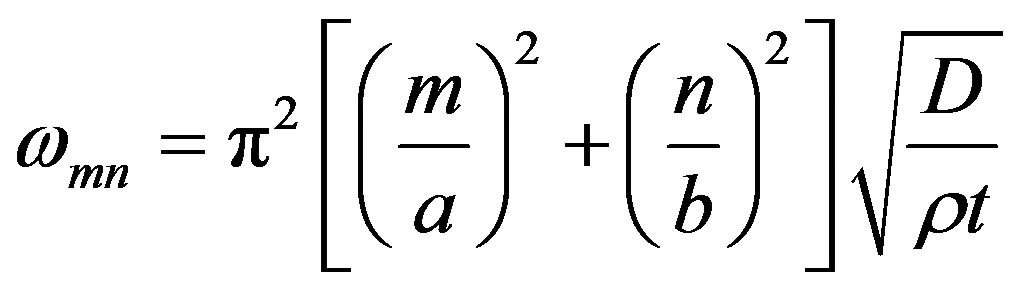 (1)
(1)
where:
o ωmn is the frequency related to the mode which is represented by m half-cosine waves in the x direction (of length a) and n half-cosine waves in the y direction (of length b).
o D is the flexural rigidity, equal to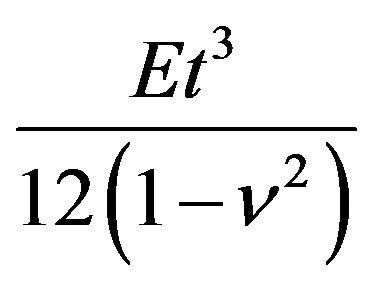 .
.
In order to consider the nature of the plate material, and to rewrite Equation (1) as a function of thickness
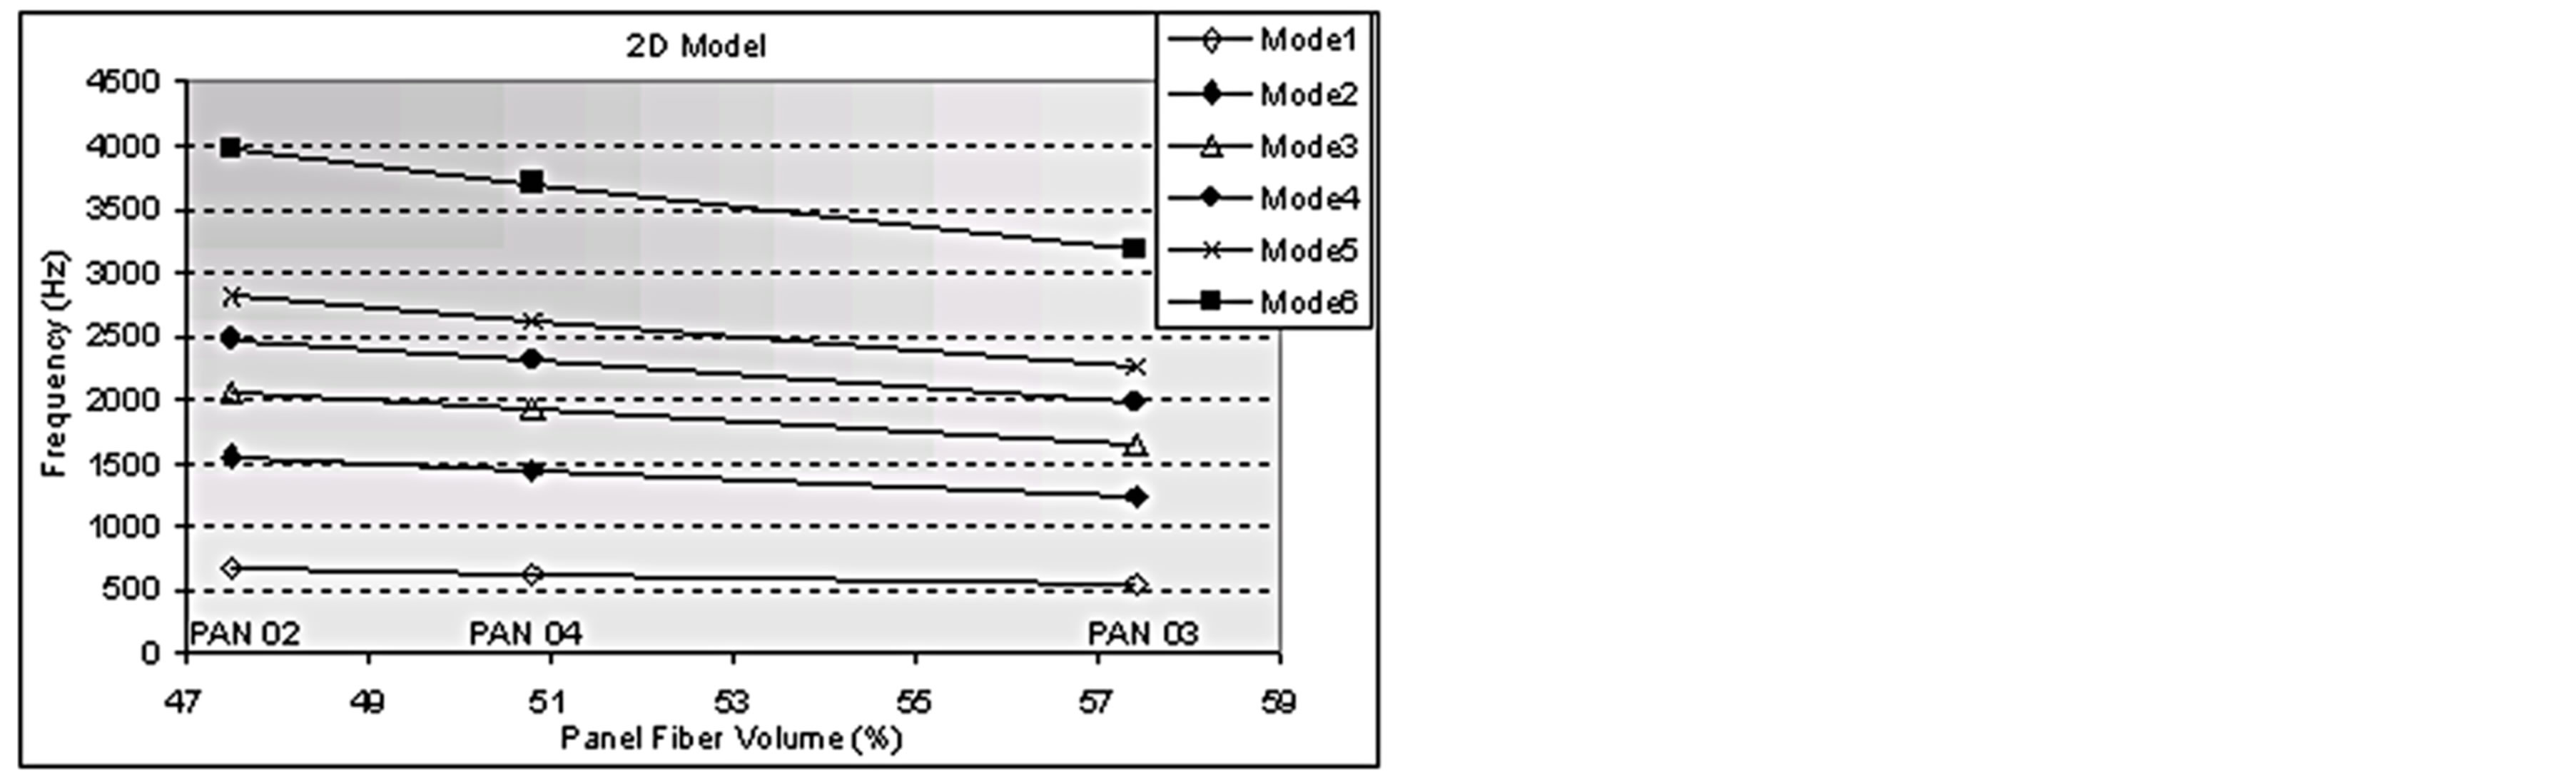
Figure 12. Analytical modal frequencies for 2D model.
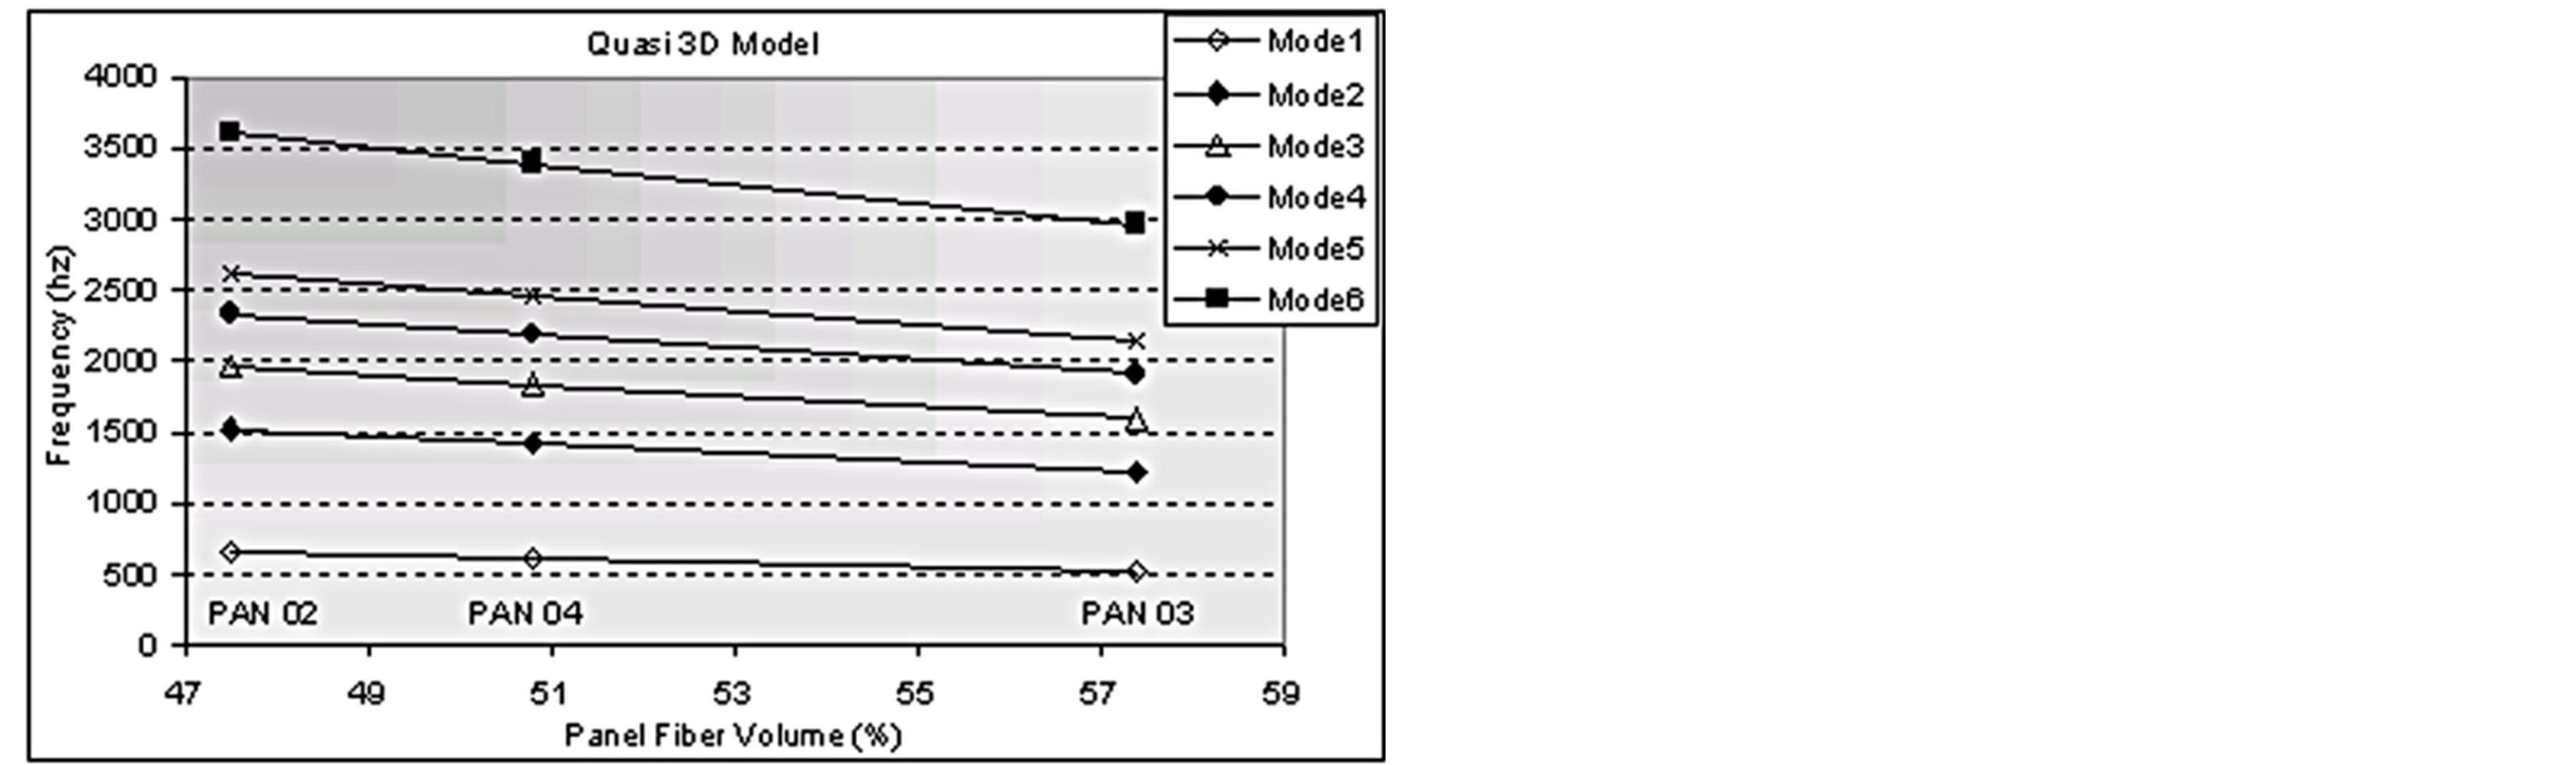
Figure 13. Analytical modal frequencies for quasi-3D model.
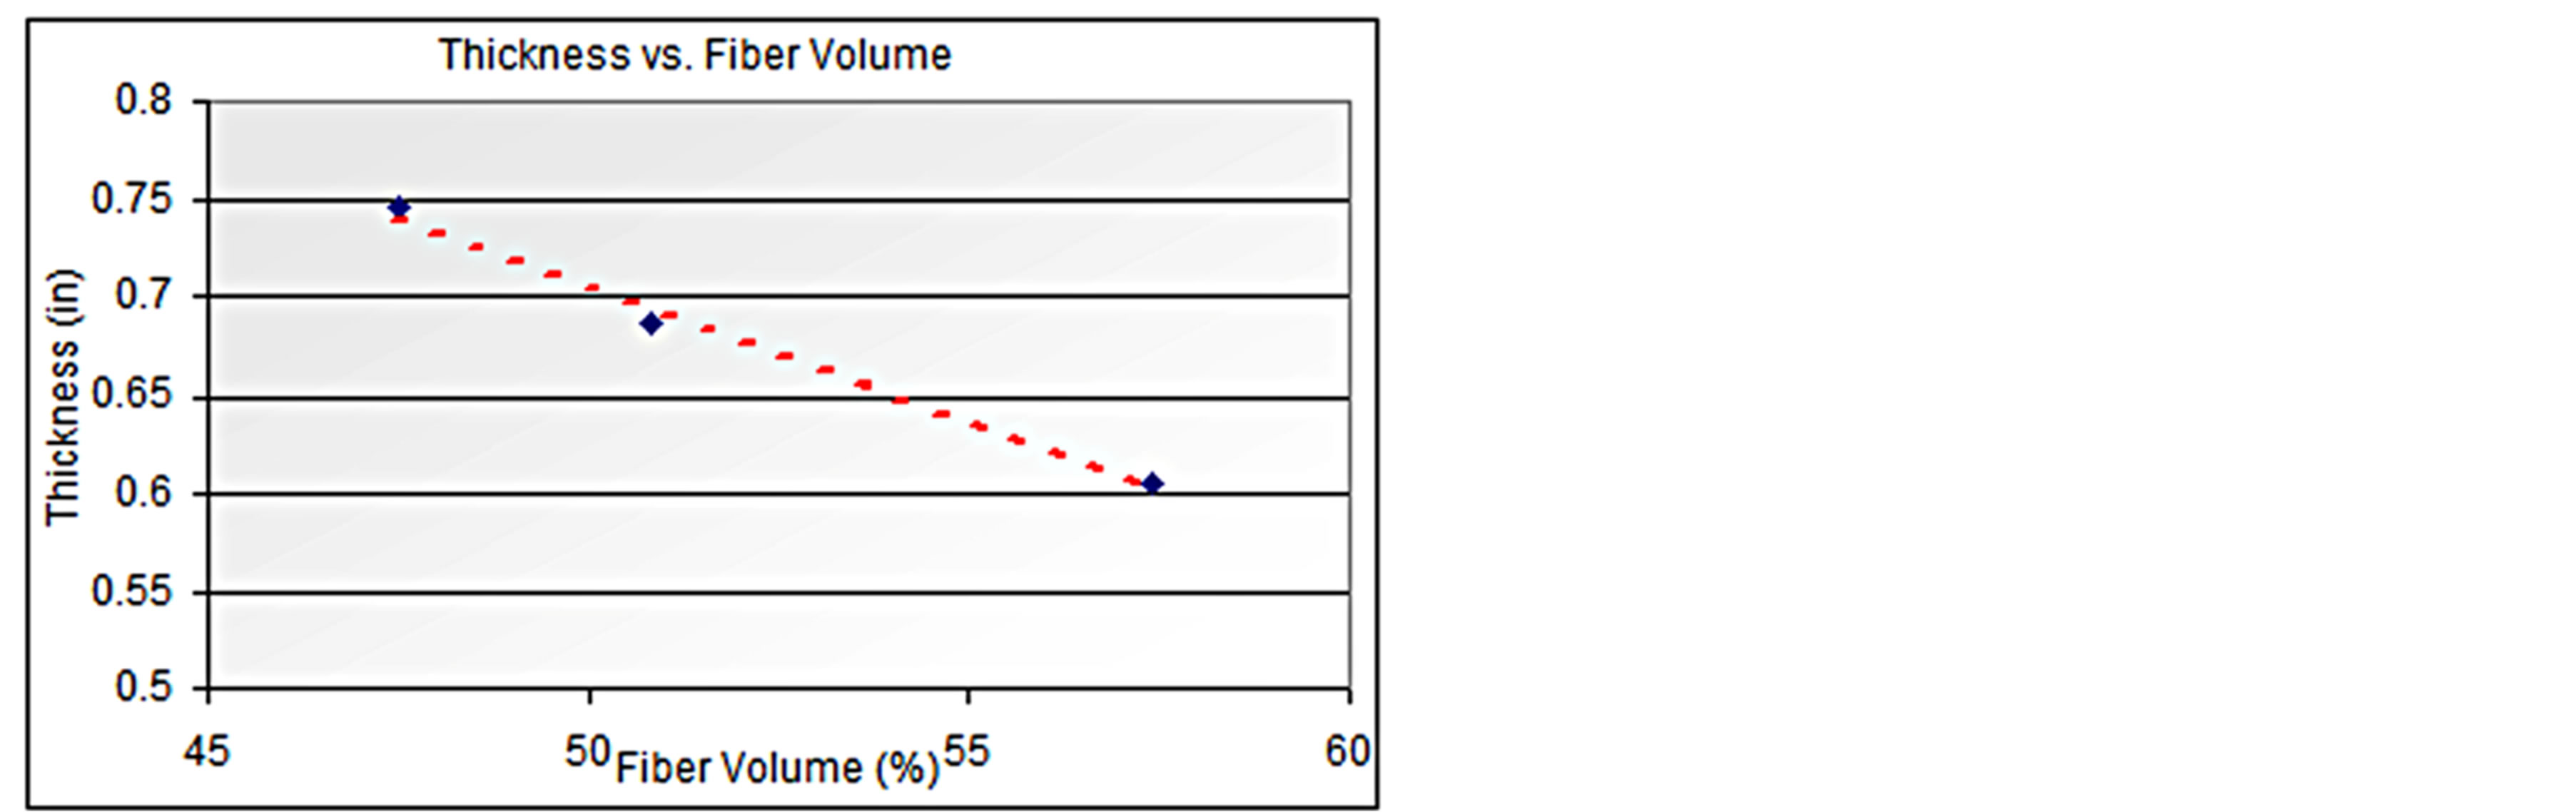
Figure 14. Relation between thickness and fiber volume.
consider the following parameters:
• Effective Young’s moduli, or axial stiffness (E*).
The effective homogeneous in-plane axial stiffness equation 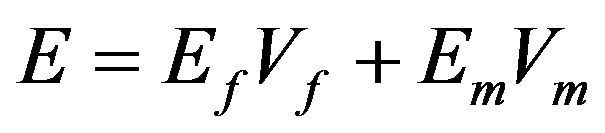 can be rewritten as:
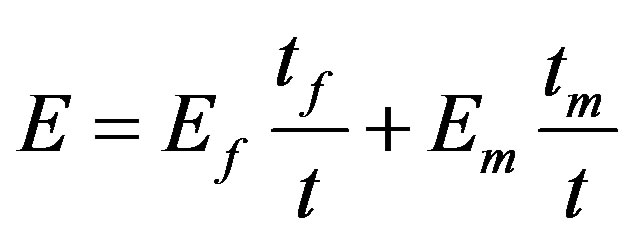 or
or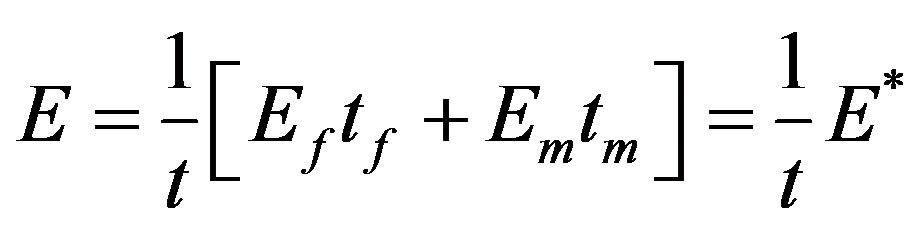 .
.
In these equations:
o Ef is the axial stiffness of the fiber;
o Em is the axial stiffness of the matrix;
o Vf and Vm are the fiber volumes of the fiber and matrix, respectively;
o tf and tm are the thickness of fiber and matrix layers, respectively;
It must be noted that the amount of fiber remains constant in the panels, since they have the same as-woven geometry. We approximate this as a constant fiber thickness. The matrix thickness variation between the panels is instead a consequence of the different pressures applied to obtain different cured panel thicknesses. When considering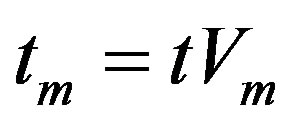 , remember that Em is two orders of magnitude lower than Ef, and thus the variation of the term Emtm, due to a variation in thickness (t) can be neglected.
Similarly:
• Effective Poisson’s ratio: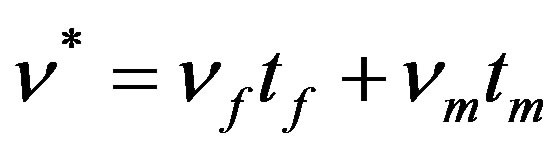 , that leads to
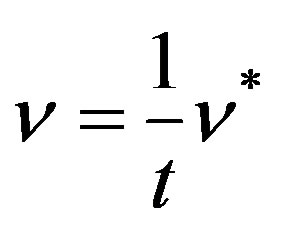 ;
;
• Effective density: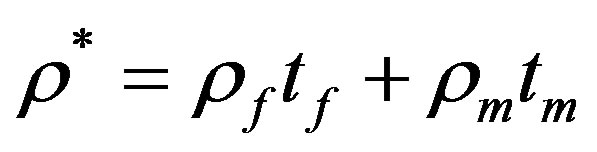 , that leads to
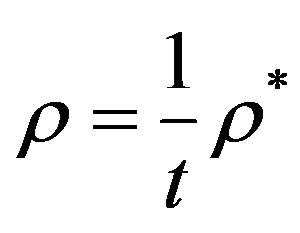 .
.
The flexural rigidity can now be written as:
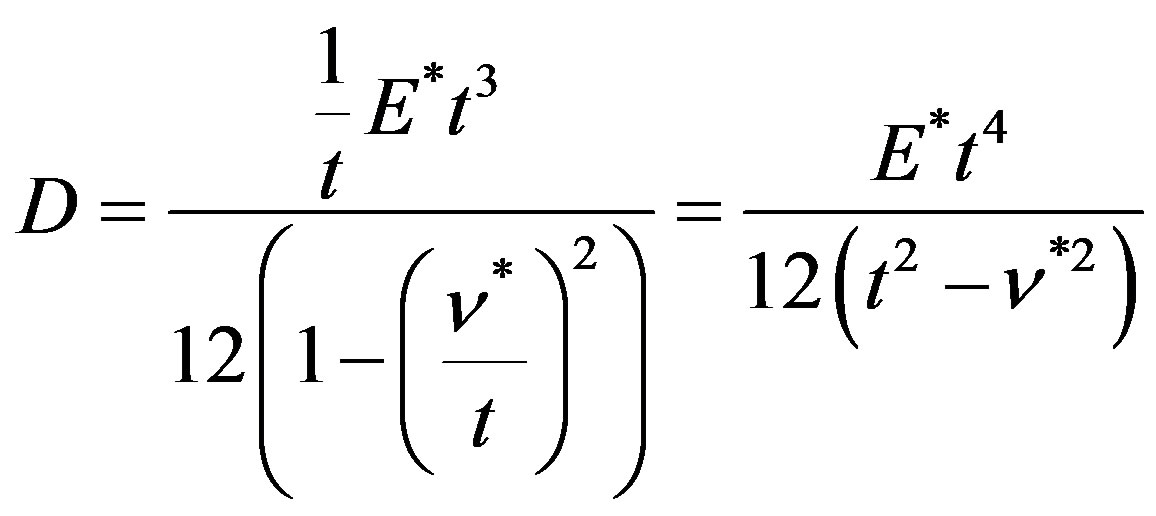 (2)
(2)
Substituting Equation (2) into (1):
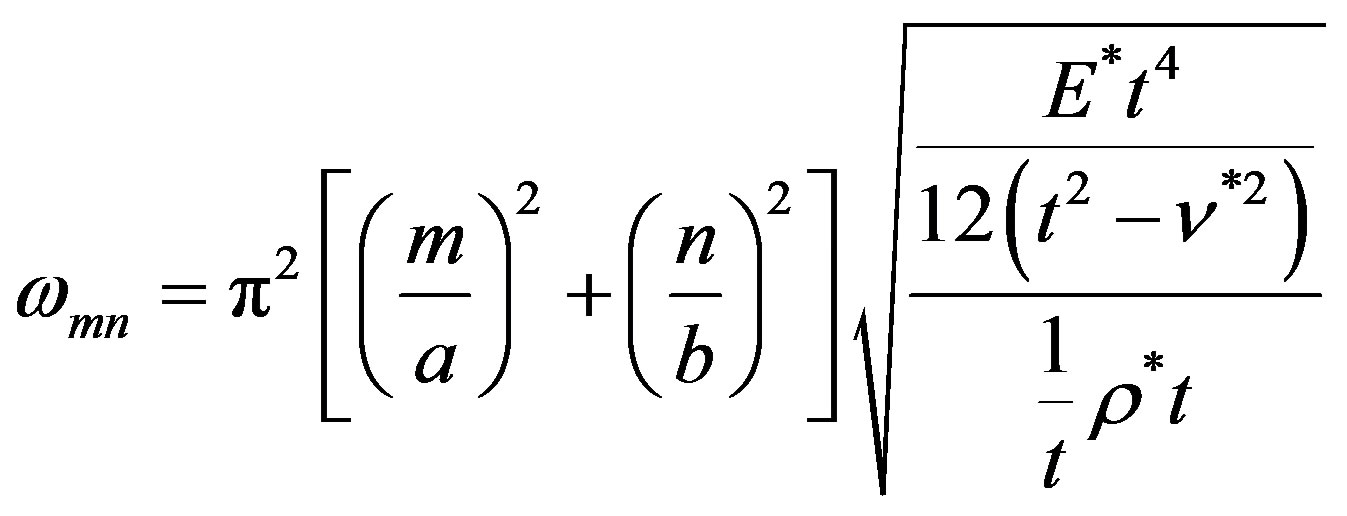 (3)
(3)
From (3) is possible to understand that the frequency is linearly related to the thickness in a first order approximation.
The error between analytical or experimental data and Equation (3) is influenced by different factors:
• Equation (1) is defined for thin plates; in fact the error increases from panel02 (thickness 0.606) to panel03 (thickness 0.746).
• Equation (1) is accurate only for a low number of modes (usually 1 to 8).
• Actual fiber and matrix properties are unknown.
• Actual fibers orientation and distortion are unknown.
• Interfacial properties and effects are neglected.
• Reduced stiffness due to interface bonding effects is neglected.
• Reduced stiffness of 3D reinforcement, which is not as effective as the assumption of 100% Vf in-plane, is not accounted for.
• Increasing in-plane effectiveness of 3D reinforcement at higher compaction (reduced inclination angle), is not accounted for.
Considering the thinner panel (panel02), based on the properties described in Table 2, the frequencies obtained from Equation (3) are compared to the ones obtained by the finite element model and the experiment (Table 3 and Figure 15). Table 4 and Figure 16 show the error as percentage of difference with respect to the test results.
Ef has been obtained from the original tape axial stiffness of the fiber IM7 (275.8 GPa) considering the two fiber directions of the cloth as a laminate with 0˚ and 90˚, with no through the thickness reinforcement. Em refers to PR520 Epoxy, the matrix used in the panels.

Table 2. Properties for panel02 used in Equation (3).
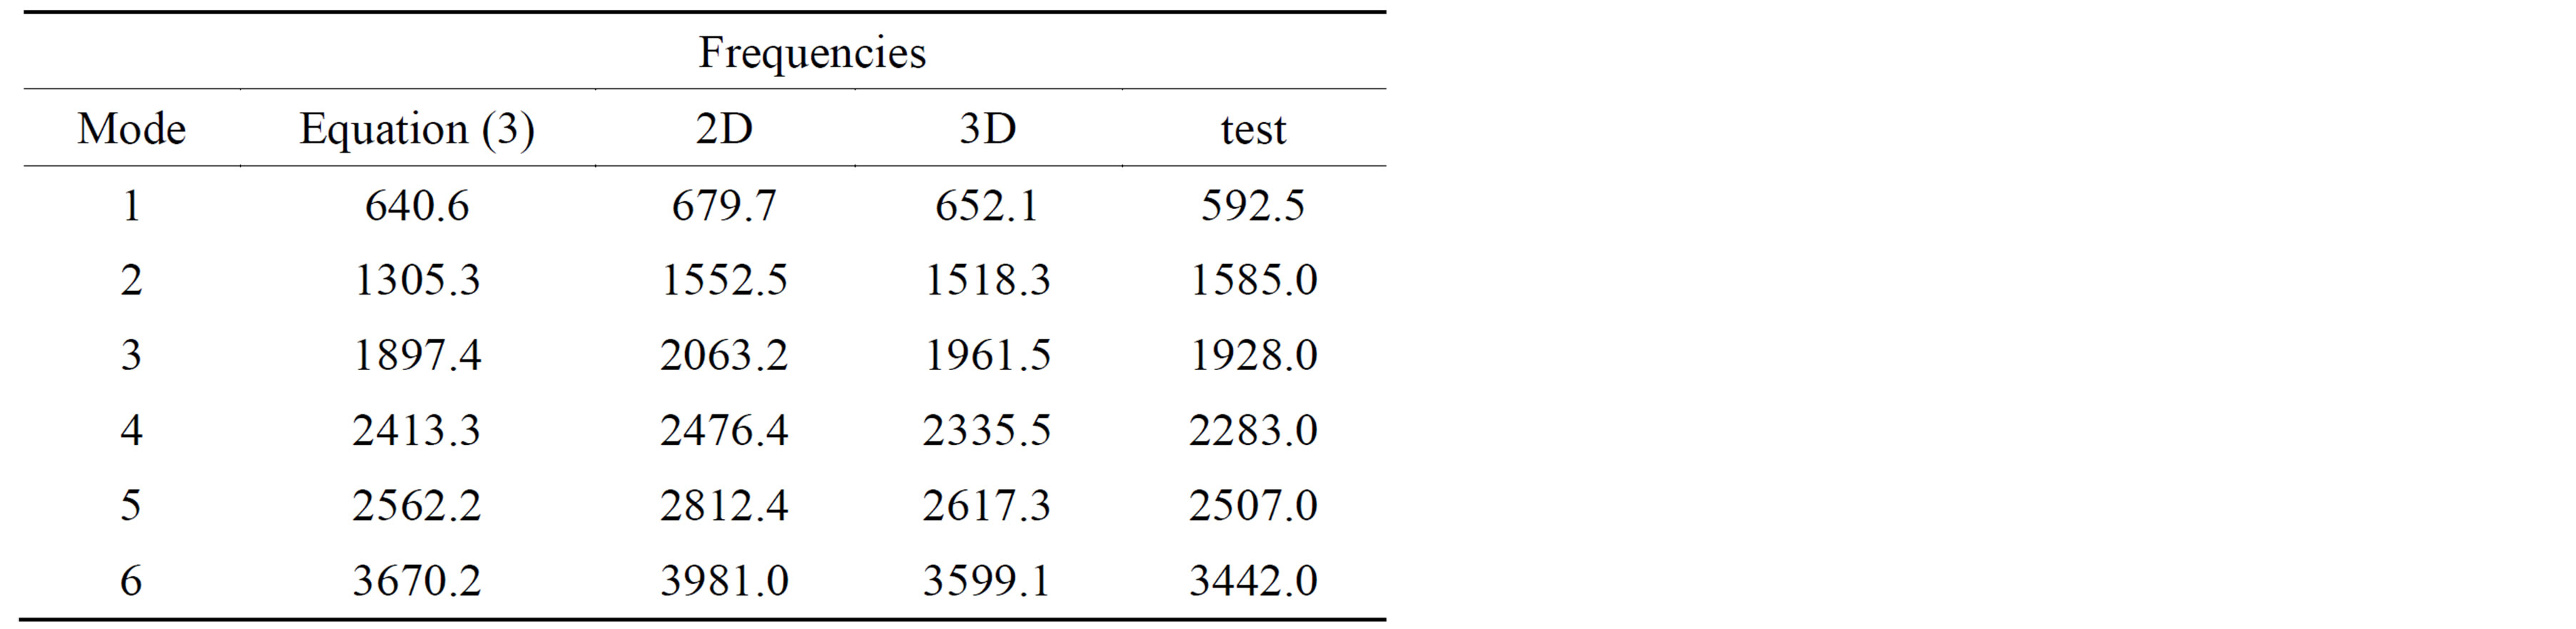
Table 3. Frequencies for the first 6 modes for panel02.
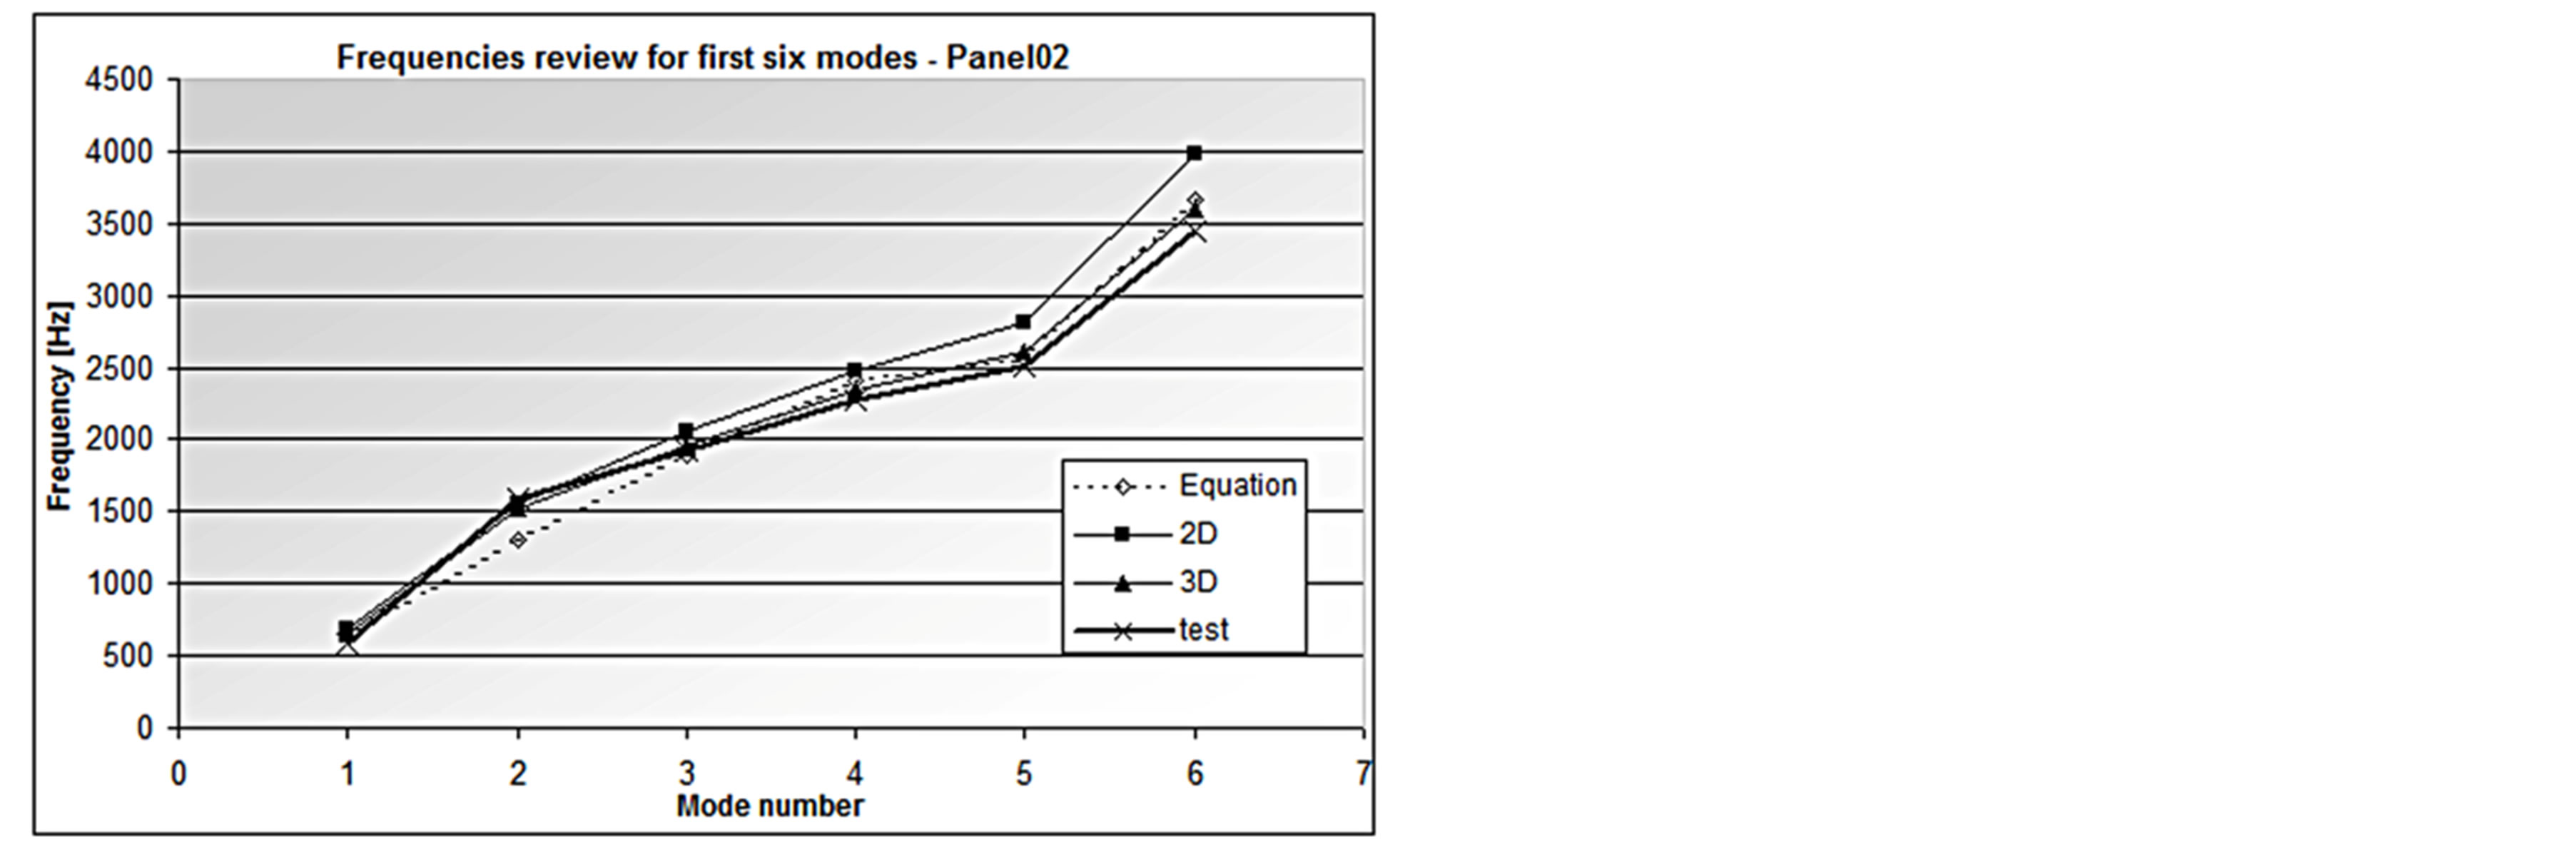
Figure 15. Frequencies review for the first 6 modes for panel02.
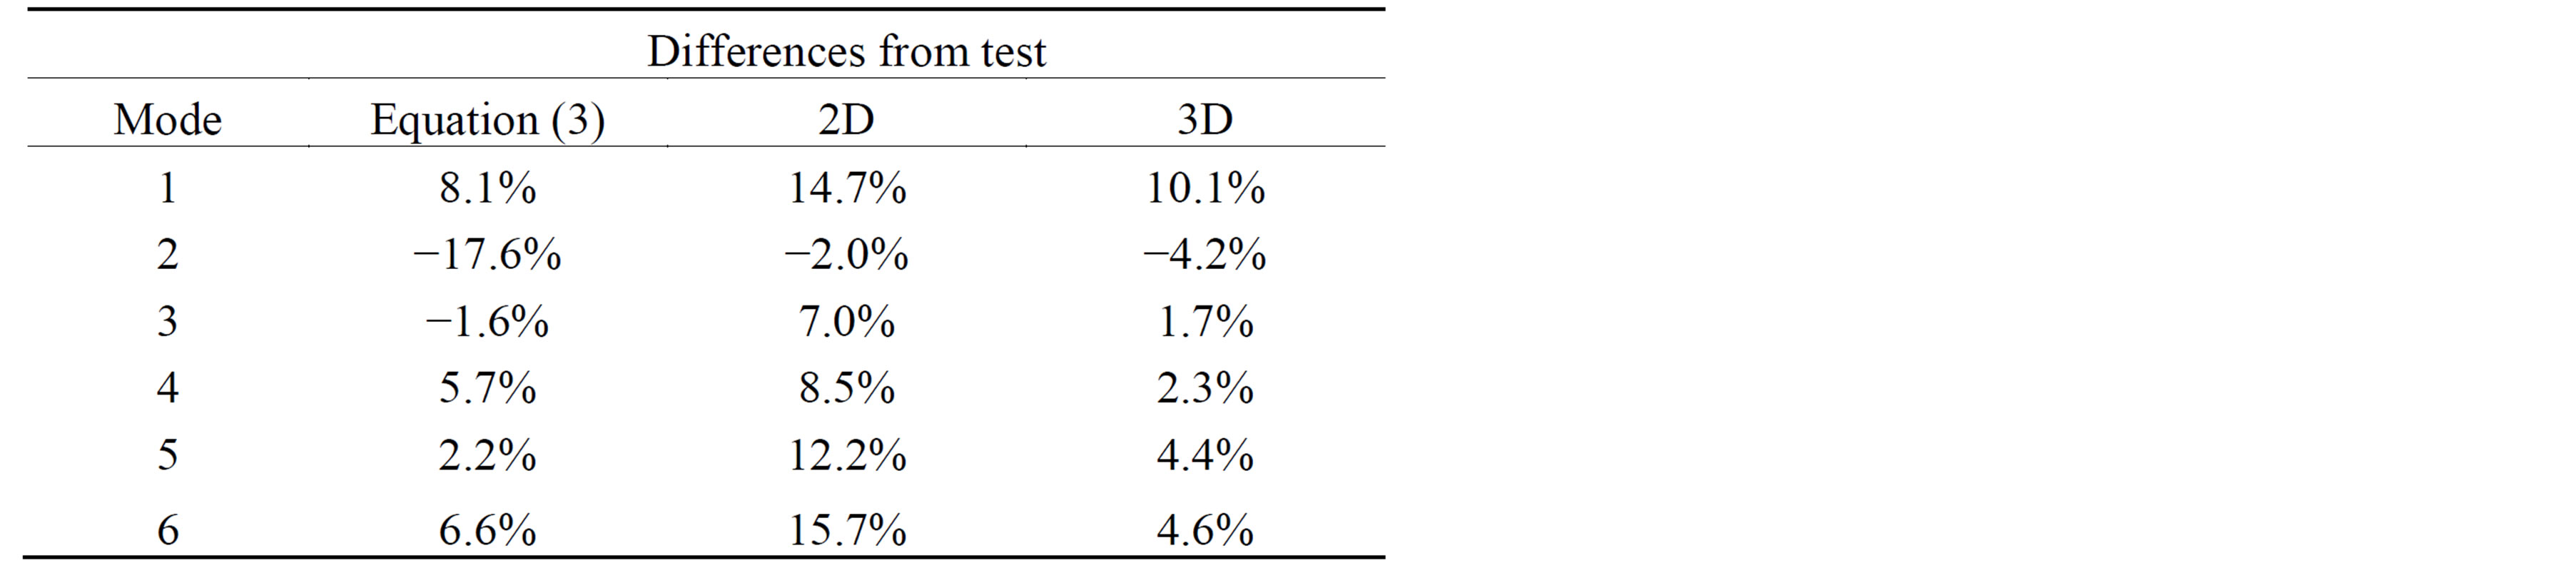
Table 4. Error between test, Equation (3) results and finite element analysis.
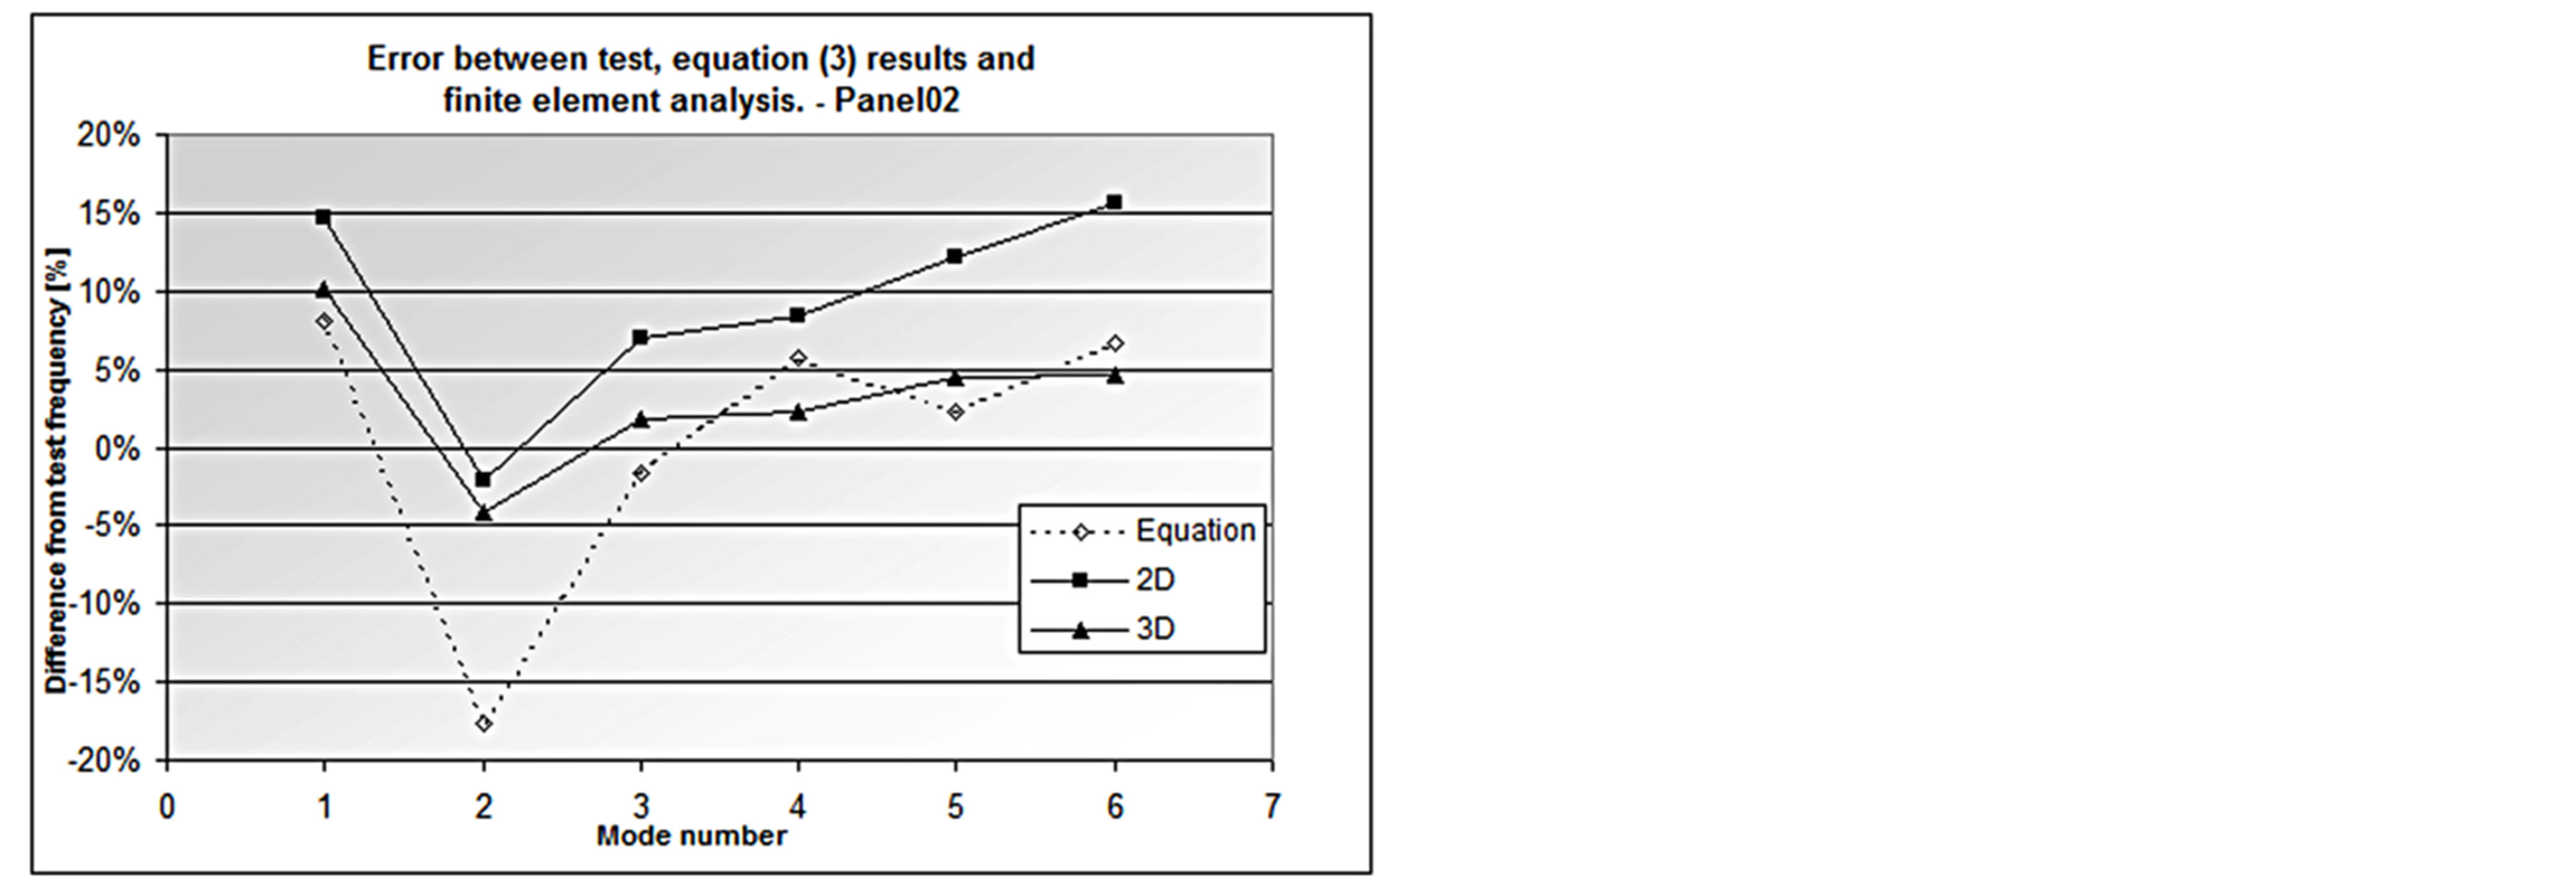
Figure 16. Error between test, Equation (3) results and finite element analysis.
6. Conclusions
In first-order dynamic analyses, the fiber architecture distortion may be assumed to be negligible. As a consequence, simple finite element models can be used in order to predict the dynamic behavior of complex as-woven geometries. This will reduce cost and time in future designs utilizing these materials.
A linear relation is shown to exist between panel frequencies and panel thickness (or fiber volume). Furthermore, it has been proven that the use of simple equations derived from plate theory can be used to verify these results.
Based on the results obtained, the authors suggest the use of the plate theory for initial study, and the use of quasi-3D finite element models for more detailed analysis, which are appropriate for characterizing the firstorder dynamic response of as-cured 3D through thickness angle interlock textile composites. It is furthermore recommended that future efforts should characterize the expected orthotropic response, to see if this is an improvement with respect to the isotropic approach.
Acknowledgements
The material addressed in this paper is based upon work supported by the National Science Foundation under Grant No. EPS-9874732 and matching supported from the State of Kansas.
The authors would like to thank Albany International Techniweave, Inc., for providing the samples used in the dynamic study.
REFERENCES
- R. M. Jones, “Mechanics of Composite Materials,” Taylor & Francis, Philadelphia, 1975.
- J. Goering, Albany International Techniweave, Inc.
- W. Soedel, “Vibration of Shells and Plates,” Marcel Dekker, New York, 1993.