Open Journal of Polymer Chemistry
Vol. 3 No. 1 (2013) , Article ID: 28479 , 6 pages DOI:10.4236/ojpchem.2013.31005
ESR Dosimetric Study on Gamma Induced Radicals in DL-Ornithine Hydrochloride
National Center for Radiation Research and Technology, Atomic Energy Authority, Cairo, Egypt
Email: drsayeda1@hotmail.com
Received November 16, 2012; revised December 21, 2012; accepted January 3, 2013
Keywords: Ornithine; EPR; Dosimetry
ABSTRACT
DL-ornithine hydrochloride rods (3 × 10 mm) were studied to be a radiation sensitive material for EPR dosimetry. The rods have specified EPR signal developed under irradiation and its intensity increases with the increase in absorbed dose. The intensity also affected by the concentration of DL-ornithine in the rods. The prepared rods can be used in the dose range from 0.5 - 50 kGy. The obtained number of free radicals per 100 eV (G value) was found to be 0.3551 ± 0.0333. The hyperfine (hf) coupling constant is 2.325 mT at g-factor 2.033. The rods have the advantage of negligible humidity effects during irradiation. The pre and post-irradiation stability was found to be satisfactory.
1. Introduction
Electron spin resonance (ESR) has been successfully applied to measuring intermediate and high doses using alanine as a radiation-sensitive material [1-3].
One of the advantages of ESR dosimetry is that the read out does not affect the spin concentration; the sample can be evaluated many times. Therefore, the signal to noise ratio (S/N) can be improved by repeated reading of the sample [1].
A comparative EPR study of a few simple amino acids has been made in order to identify qualitatively and quantitatively the different radiation induced radicals in amino acids powders [4].
Polycrystalline phenyl-alanine and perdeuterated L-α- alanine were studied as potential high-energy radiationsensitive materials (RSM) for solid state/EPR dosimetry [5].
Electron paramagnetic resonance (EPR) was proposed as a method to measure radiation-induced radicals. Alanine dosimetry has been already used for a long time as a standard method by national metrology institutes like NPL, LNHB or NIST, Also an ISO standard has been published [6]. A new EPR dosimeter was prepared by a simple technique in the laboratory through mixed arginine monohydrochloride with both vinyl acetate copolymer and paraffin wax. The dose response effects of humidity and temperature as well as (pre and post) irradiation stability were discussed [7]. A new simple method for preparation of alanine EPR pellets with a new binding medium has been carried out. The dose response influence of humidity and temperature during irradiation, energy dependence as well as storage at different conditions are discussed [8]. A number of solid materials, including amino acids, in which free-radical populations are formed by irradiation, have been suggested for highdose dosimetry by Electron Paramagnetic Resonance (EPR) analysis. A useful method of high dose measurement is the use of EPR spectrometry of irradiated amino acids, in particular L-alanine, CH3CH(NH2)COOH, purified in polycrystalline form [9-12]. A new alanine dosimeter in 2005 was prepared using poly (vinyl butyralco-vinyl alcohol-co-vinyl acetate) copolymer as a binder with ratio 40% L-alanine to 60% binder by weight in the form of pellets 5 mm in diameter and of average height 3.5 mm [13]. Several improvements to reduce the orientation effects can be accomplished by certain time-consuming procedures, e.g. for pellet-shaped dosimeters, averaging the measured values at two different orientations 90˚ apart [14,15] or by using double-integration of the spectrum [16], and for film dosimeters, by attaining maximum amplitude or by averaging the maximum and minimum amplitudes [17].
The objective of the present study is preparation of a new EPR dosimeter by simple technique in the laboratory by mixing DL-ornithine with both vinyl acetate copolymer and paraffin wax. The radiation-induced radicals in the rods were studied and investigated for its application from the dosimetric point of view.
2. Experimental
2.1. Materials
DL-ornithine hydrochloride (product of Sigma) has the molecular formula (C5H12N2O2∙HCl), molecular weight 168.62 g, and a melting point of 291˚C, as well as hot melt stick adhesive based on ethylene vinyl acetate copolymer (Tec-Bond 232/12, Power Adhesives Limited, England) and paraffin wax (congealing point 65˚C - 71˚C, BHD) were used for the rods preparation. The molecular structure diagram of DL-ornithine is represented in the following scheme (Scheme 1).
2.2. Preparation of DL-Ornithine Hydrochloride Rods
An equal weight mixture of paraffin wax and ethylene vinyl acetate copolymer (EVA) was melt at 85˚C - 95˚C in a water bath. 10%, 15% and 20% fine powdered DL ornithine hydrochloride material was added to the hot mixture solution and mechanically stirred for about 15 minutes at the same temperature to obtain a homogeneous mixture. The hot solution is sucked into polypropylene tubes (inner diameter 3 mm) and was left to solidify by cooling. Ornithine mixture rod was obtained by removing the polypropylene tube then cut into rods (3 × 10 mm dimensions). The average mass of the prepared rods was found to be 0.07 ± 0.003 g.
2.3. Irradiation of the Prepared Rods
Co60 irradiation facility was used for irradiation of the prepared rods. The absorbed dose rate was about 3.0639 kGy·h−1 overall the time of the experimental part. Five rods were irradiated together at the central position of the sample chamber using a specially designed holder made from polystyrene to ensure electronic equilibrium.
2.4. EPR Measurements
EPR signals were recorded at room temperature by using a Bruker EMX spectrometer (X-Band) product of Bruker, Germany. The operating conditions are, microwave power 5.041 mW, modulation amplitude 6.00 Gauss, modulation frequency 100 kHz, sweep width 250 Gauss, microwave frequency 9.725 GHz, time constant 81.92 ms and conversion time 20.48 ms The bottom of the EPR tube was adjusted at fixed position to ensure reproducible and accurate positioning of the rods in the sensing zone of the cavity.
EPR spectra were recorded at two orientations of each rod in the EPR cavity (0˚ and 90˚). The dose responses of dosimeters were calculated in terms of average peak-
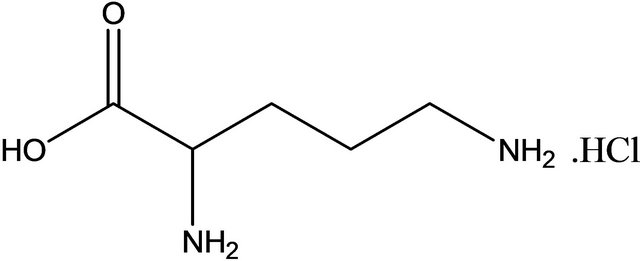
Scheme 1. Molecular structure of DL-ornithine hydrochloride.
to-peak heights of the two orientations (h0 and h90) per unit weight of dosimeter. Readings were corrected to the peak-to-peak height of the reference standard material DPPH (α-α-diphenyl β picrylhydrazyl), which was recorded before and after each signal spectrum of the samples in order to correct the change in the spectrometer sensitivity. Stability of EPR spectrometer sensitivity was checked before and after each series of measurement using reference irradiated alanine dosimeters.
3. Results and Discussion
3.1. Spectral Features
Spectrum of unirradiated DL-ornithine HCl shows no features, however, the spectrum of irradiated one to a dose of 45 Gy (20%) possesses a sextet signal with peakto-peak linewidth Wpp is about 10.4 mT Figure 1, the g-factor for S1 2.039 ± 0.0016, 2.024 ± 0.0014 for S2, 2.011 ± 0.0023 for S3, 1.995 ± 0.0009 for S4, 1.99 ± 0.005 for S5 and 0.979 ± 0.0012 for S6. So, this suggests the presence of more than one transition between energy levels present in the sample. The linewidth between signals is 2.56 mT between S1 and S2, 1.918 mT between S2, S3, 3.13 mT between S3 - S4, 0.87 mT between S4 - S5 and 1.83 mT between S5 - S6. S3 with magnetic field 34553.2 Gauss was chosen to perform all the work in this study due to its high sensitivity, the hyper fine coupling constant A11 is 2.325 and A┴ 1.967 mT.
3.2. Power Dependence
The intensity of EPR signals increases in proportion to p1/2 up to high microwave power. Appropriate setting of power level is necessary for the ESR measurement. Figure 2 shows the microwave power dependence of DLornithine signal intensity. The signal intensity increases as a function of power up to 5.041 mW without reaching saturation.
3.3. Effect of Ornithine Concentration on Signal Intensity
Three different concentrations of DL-ornithine hydro-
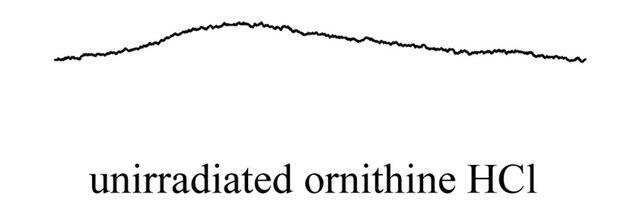
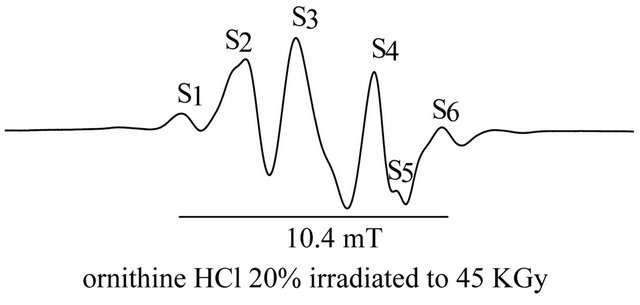
Figure 1. EPR spectra of unirradiated and irradiated ornithine HCl.
chloride namely 10%, 15%, 20% were irradiated to a dose of 15 kGy and the obtained spectra were shown in Figure 3 from which it could be concluded that the peak intensity increases with the increase of DL-ornithine concentration.
Figure 4 represents the EPR spectra of DL-ornithine rods (10%) were recorded after irradiation to doses 1, 5, 12, 20, 30 KGy.
From this figure it can be seen that the EPR signal begins to develop upon irradiation and its amplitude increases gradually with increasing the absorbed dose of γ-ray photons without any change in its shape.
3.4. Dose Response
Figure 5 represents the response curves of the three sets of ornithine rods concentrations (10%, 15% and 20%) to different absorbed dose ranging from 0.5 to 50 kGy. EPR spectra were recorded to establish the response curves (each dose point is represented by the average value of 3
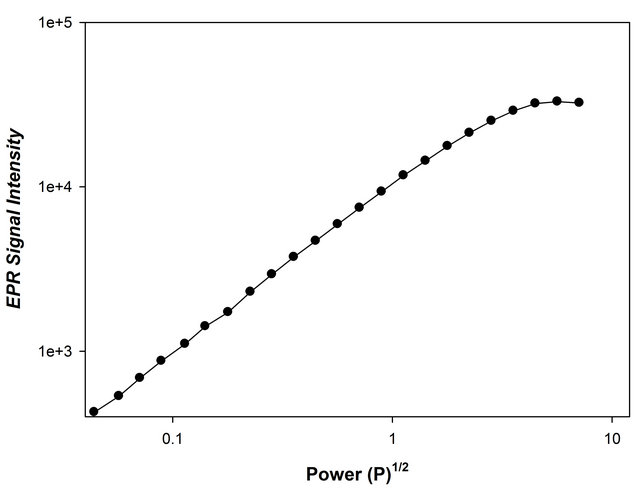
Figure 2. Relationship between the square root of microwave power (mW1/2) and ESR signal intensity of γ–irradiated ornithine hydrochloride powder.

Figure 3. EPR spectra recorded for orinithine rods of different concentrations irradiated to a dose of 15 KGy.
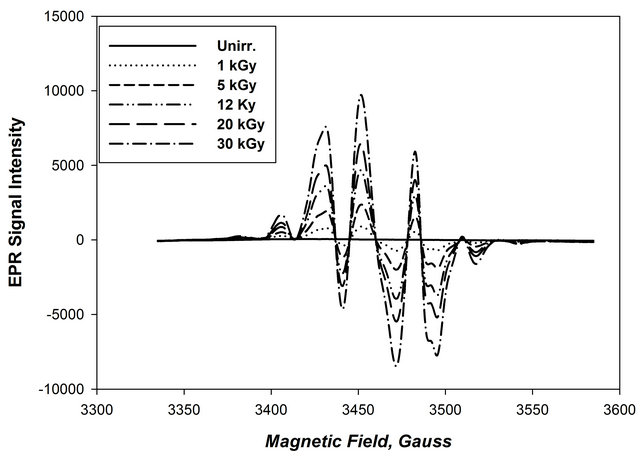
Figure 4. The EPR spectra of DL-ornithine hydrochloride rods irradiated to different absorbed doses.
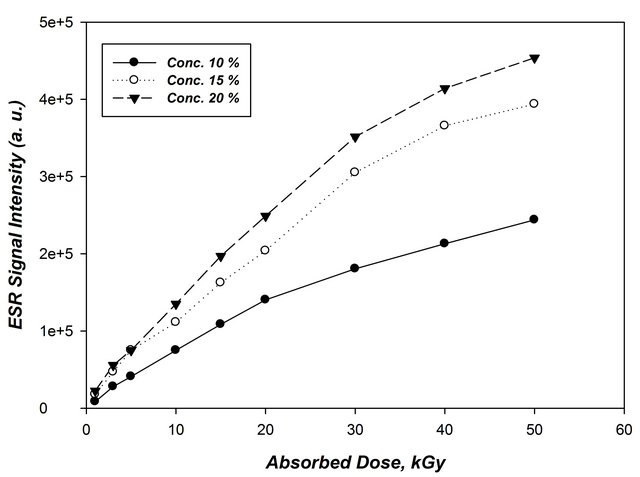
Figure 5. change of ESR intensity (a.u.), as a function of absorbed dose for different ornithine concentrations.
rods measurements, the response curves obtained for the irradiated samples in terms of average peak-to-peak amplitude normalized to dosimeter mass (peak height/mass) versus the absorbed dose. It can be seen that the radiation sensitivity of ornithine rods increases with the increase of absorbed dose and ornithine concentration in the rods. This increase in radiation sensitivity is mainly attributed to the increase in number of free radicals induced by radiation in the rods.
3.5. Radiation Sensitivity G-Value
The efficiency of a dosimeter is expressed by a “Gvalue”, i.e., the number of radicals or valency change of ions produced by the absorbed radiation per 100 ev. The radical formation efficiency was determined by double integration of the first derivative spectra of DPPH (α-α- diphenyl β picrylhydrazyl) and compared with those of irradiated materials .The absolute spin concentration was estimated by using the following equation [18,19].
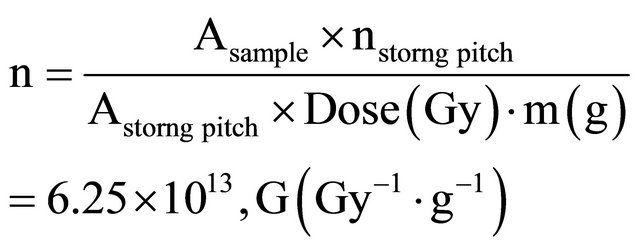
where, Asample, Astrong-pitch, nstrong-pitch and m are the areas of the integrated signals of the sample and strong pitch, number of spin in strong pitch and the mass of the sample, respectively.
The G value of the whole area was found 0.3551 ± 0.03.
4. Stability
4.1. Pre-Irradiation Stability
The pre irradiation stability of DL-ornithine rods was investigated by measuring the EPR signal of DL-ornithine rods with concentration 20% during a storage period of 50 days. The rods were conditioned at 35% RH and at room temperature (25˚C ± 3˚C) in dark and laboratory light, it was noticed that no detectable EPR signal was produced during the storage period at different storage conditions.
4.2. Post-Irradiation Stability
4.2.1. Stability of Ornithine Powder
DL-ornithine powder (0.0231 gm) was irradiated to a dose of 5 kGy and then measuring the signal intensity at different time intervals of 150 days as shown in Figure 6. The peak intensity values shows slight decrease in the first 5 days, then tends to be stable till the end of the storage period.
4.2.2. Long Term Post Irradiation Stability of Ornithine Rods
The post irradiation stability has been studied for DLornithine rods for a period of 60 days. The ornithine concentration is 20% stored at 35% relative humidity (RH) at room temperature (25˚C ± 3˚C) at dark. Three rods were irradiated to a dose of 30 KGy.The EPR signal intensity of the rods was recorded immediately after irradiation.The rods are then stored for about two month and were measured using EPR at different time intervals during this storage period. The post irradiation stability curve of these rods is shown in Figure 7. Excellent post irradiation stability is obtained where the response decreases only with around 1% at the end of the 2 month storage period.
5. Humidity during Irradiation
The effect of relative humidity during irradiation on the response of DL-ornithine dosimeters of concentration 10% was investigated by the irradiation of the rods to a dose of 30 kGy at different humidity values. The rods were stored before irradiation for a 3 days period under the same relative humidity as when irradiated, so that equilibrium moisture content in the rods has been established during irradiation. Figure 8 shows the variation in EPR signal intensity as a function of relative humidity during irradiation relative to the response value at 33% relative humidity. It can be concluded that DL-ornithine rods has negligible humidity effect in the range of humidity from 0% - 100% not more than 5%.
6. Conclusions
From the data presented in this study, the following conclusion can be drawn
• A new ornithine rod has been prepared by a simple technique in the laboratory using ethylene vinyl acetate copolymer and paraffin wax where the binding materials do not show interference or noise in the EPR signal before or after irradiation.
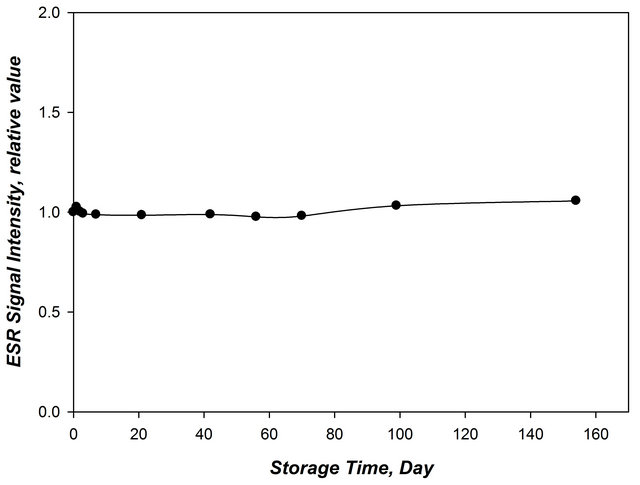
Figure 6. Post irradiation stability of ornithine powder irradiated to 5 kGy.
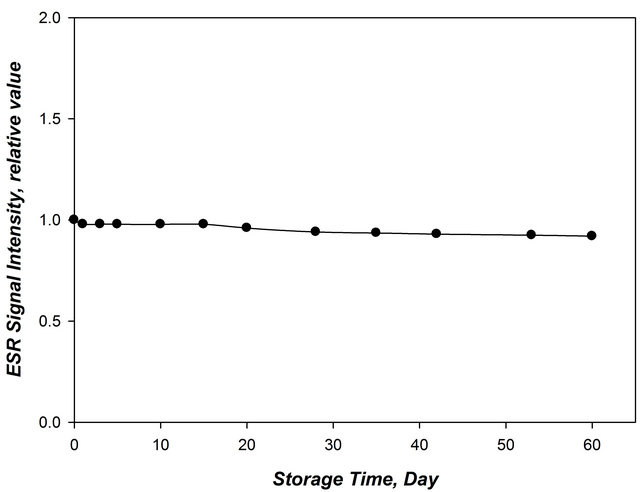
Figure 7. Decay of EPR line of irradiated ornithine (HCl 20%) at dose 30 kGy.

Figure 8. Variation of EPR response of ornithine rods as a function of relative humidity during irradiation (10% ornithine HCl), Irradiation dose 30 kGy
• The obtained number of free radicals per 100 eV (G value) was found to be 0.3551 ± 0.0333.
• The prepared rods have significant EPR signal developed upon irradiation and its intensity increases with the increase of absorbed dose and DL-ornithine concentration.
• The useful dose range for these rods was found to be 0.5 - 50 kGy.
• The response of this dosimeter has a negligible effect of humidity during irradiation (not more than 5%).
• These Dosimeters are fairly stable before irradiation and show little fading between 2% and 5% over a 60 days storage period depending on the storage conditions.
REFERENCES
- M. Ikeya, “New Applications of Electron Spin Resonance— Dating, Dosimeter and Microscopy,” World Scientific, Singapore, 1993.
- T. Kojima, R. Tanaka, Y. Morita and T. Seguchi, “Alanine Dosimeter Using Polymers as Binders,” International Journal of Radiation Applications and Instrumentation, Part A. Applied Radiation and Isotopes, Vol. 37, No. 8, 1986, pp. 517-520. doi:10.1016/0883-2889(86)90158-9
- D. F. Regulla and U. Deffner, “Dosimetry by ESR Spectroscopy of Alanine,” The International Journal of Applied Radiation and Isotopes, Vol. 33, No. 11, 1982, pp. 1101-1114. doi:10.1016/0020-708X(82)90238-1
- S. Talbi, J. Raffii, S. Arena, J. Colombani, P. Piccerelle, P. Prinderre and J. M. Dolo, “EPR Study of Gamma Induced Radicals in Amino Acids Powders,” Spectrochemica Acta Part A, Vol. 60, 2004, pp. 1335-1341.
- V. Gancheva, E. Sagstuen and N. D. Yordanv, “Study on the EPR/Dosimetric Properties of Some Substituted Alanines,” Radiation Physics and Chemistry, Vol. 75, No. 2, 2006, pp. 329-335.
- ASTM (American Society for Testing and Materials), “ISO/ASTM51607-04 Standard Practice for Use of the Alanine-EPR Dosimetry System (Nuclear Technology Standards),” West Conshohocken, 2002.
- W. B. Beshir, A. A. Abdel-Fattah, F. Abdel-Rehim and H. M. Hassan, “EPR Dosimetric Properties of RadiationFormed Radicals in Arginine Monohydrochloride,” Journal of Radiation Research and Applied Sciences, Vol. 4, No. 3, 2011, pp. 777-797.
- A. A. Abdel-Fattah, H. Ezz Eldin and F. Abdel-Rehim, “New Alanine/EPR Dosimeter Using EVA Copolymer/ Paraffin as a Binder for High-Dose Radiation Dosimetry: Performance Characterization,” International Journal of Polymeric Materials, Vol. 53, No. 11, 2004, pp. 927-939. doi:10.1080/00914030490502445
- F. Bermann, H. De Choudens and S. Descours, “Advances in Physical and Biological Radiation Detectors,” Proceedings of a Symposium on New Developments in Physical and Biological Radiation Detectors, Vienna, 23-27 November 1970, IAEA Publication STI/PUB/269 International Atomic Energy Agency, p. 331.
- D. F. Regulla and U. Deffner, “Dosimetry by ESR Spectroscopy of Alanine,” The International Journal of Applied Radiation and Isotopes, Vol. 33, No. 11, 1982, pp. 1101-1114. doi:10.1016/0020-708X(82)90238-1
- W. W. Bradshaw, D. G. Cadena Jr., G. W. Crawford and H. A. W. Spetzler, “The Use of Alanine as a Solid Dosimeter,” Radiation Research, Vol. 17, No. 1, 1962, pp. 11-21. doi:10.2307/3571206
- D. F. Regulla and U. Deffner, “Dosimetry by ESR Spectroscopy of Alanine,” Proceedings of International Symposium on High-Dose Dosimetry (221 SM-272/39), Vienna, 8-12 December 1984, International Atomic Energy Agency.
- W. B. Beshir, H. M. Ezz El-Din, A. A. Abdel-Fattah and S. Ebrahim, “Alanine/EPR Pellet to Dosimeter Using Vinyl butyral-co-vinyl alcohol-co-vinyl acetate)copolymer as a Binder for Radiation Dosimetry,” Arab Journal of Nuclear Sciences and Applications, Vol. 38, No. 1, 2005, p. 24
- T. J. L. Sollier, D. C. Mosse, M. M. T. Chartier and J. E. Joli, “The LMRI ESR/Alanine Disimetry System: Description and Performance,” Applied Radiation and Isotopes, Vol. 40, No. 10-12, 1989, pp. 961-965.
- J. M. Arber Sollier, P. H. G. Sharpe, H. A. Joly, J. R. Morton and K. F. Preston, “The ESR/Alanine DosimeterPower Dependence of the X Band,” Applied Radiation and Isotopes, Vol. 42, No. 7, 1991, pp. 665-668. doi:10.1016/0883-2889(91)90037-2
- D. F. Regulla, U. A. Deffner, O. Schidewolf, A. Vogenauer and A. Wiser, “Progress in Alanine/ESR Transfer Dosimetry,” IAEA-TECDOC-321, IAEA, Viena, 1983.
- I. Janovsky, “Radiation Processing,” Proceedings of a Symposium, Vienna, 1990, IAEA STII/PUB/846, IAEA, 1991, pp. 173-187.
- M. Ikeya, “Techniques of Radiation Dosimetry: Electron Spin Resonance Dosimetry,” In: K. Mahesh and D. R. Viji, Eds., Chapter 15, Wiley Eastern, NewDelhi, 2000. doi:10.1143/JJAP.39.6236
- M. Ikeya, “Techniques of Radiation Dosimetry Electron Spin Resonance Dosimetry,” In: K. Mahesh and D. R. Viji, Eds., Chapter 15, Wiley Eastern, New Delhi, 1985.