Journal of Power and Energy Engineering
Vol.06 No.03(2018), Article ID:83434,22 pages
10.4236/jpee.2018.63005
Design Analysis and Optimal Matching of a Controllable Pitch Propeller to the Hull and Diesel Engine of a CODOG System
Okim Bartholomew Ogar, Samson Nitonye, Ikue John-Hope
Department of Marine Engineering, Rivers State University, Port Harcourt, Nigeria

Copyright © 2018 by authors and Scientific Research Publishing Inc.
This work is licensed under the Creative Commons Attribution International License (CC BY 4.0).
http://creativecommons.org/licenses/by/4.0/


Received: December 19, 2017; Accepted: March 26, 2018; Published: March 29, 2018
ABSTRACT
The optimal matching of a propeller to the hull and the diesel engine of the combine diesel or gas (CODOG) system is a critical design analysis in ship building. In this research work, a controllable Pitch Propeller (CPP) was considered whereby the pitch was varied, but only the extreme pitch set the limit of operation and matching was done with the extreme pitch condition. It considers the performance analysis of the propeller, the hull and the engine both in design and off design conditions. Without propulsion a vessel built cannot move and so choosing the right propeller to match the hull and engine is very vital. The various processes involved in the matching of the propeller to the diesel engine and hull of the vessel are considered, in order to achieve optimal performance of the vessel. A Java program (prop-matching) was developed to facilitate the matching process. The graphs obtained are used to determine the matching point at corresponding speed and power. The thrust and torque developed under different conditions as well as their significance, considering the fact that the propeller is a CPP. The engine response in transient conditions in reaction to the turbo charger was considered, the matching graph of the turbo charger compressor was discussed, and the calculated mass flow rate with various engine speeds and boost pressure were also discussed. This program was further used in matching the propeller to the hull and diesel or gas engines of a F90 frigate. The corresponding propeller rpm and engine power with pitch ratios from the program were similar to those from the design of the frigates. The various thrust and torque coefficients and open water efficiency all correspond to the simulated results of those of the naval frigate.
Keywords:
CPP, CODOG, Propeller, Matching, Resistance, Effective Power, Speed

1. Introduction
The matching of a propeller to the engine and hull of a vessel is a key design analysis in ship building and especially in the design of the propulsion system of a combined system. The matching of the engine and gear ratio to the propeller means that the equilibrium between the available engine torque and the required propeller torque will not overload the engine and that the thrust required to make speed is available throughout the range of operation. The recent availability of modern computers has made propeller calculations much easier than it was before now. The characteristics of the propeller used on most small vessels are relatively easy to calculate, either with the use of a spreadsheet program such as excel or with dedicated propeller software [1] .
For a vessel to achieve its desire speed, overcome resistance and allow for high engine performance, optimal matching of the propeller is very important as this will reduce cost that may arise from fuel consumption, vibration induced stresses, which may contribute to already existing stresses of engine load, and wave motion on the vessel [2] . “To optimize the system, the following parameters must be considered, type of propulsion, maneuverability, fuel consumption, payload, main dimension, passenger/crew comfort, effects on the maritime environment, initial investment cost and so forth. But often, the initial investment cost becomes the major decision factor, while factors such as the life cycle perspective, the total fuel bill, and the total environmental impact over the ships lifetime are given less attention” [3] .
The use of CODOG for main propulsion has become imperative especially as it relates to naval frigates. CODOG is commonly associated with naval frigates and the need to implore this system is the key to our national development; it is economical, such that the diesel engines can be used while on patrol on cruising speed and the gas turbine for chase in the event of attack at high speed, but not both systems at the same time. The need for optimal propeller matching to the CODOG system cannot be over emphasis [4] . Marco et al., (2005) investigated the matching of propulsion plant and fuel consumption. However their work emphasized more on fuel consumption and emission control, even though the author discussed about the optimal pitch matching to achieve this aim [5] . Pivano (2008) explained the speed and position control system for marine vehicles with respect to performance and safety. He discussed on semi-submersible rigs and how to keep them in position and heading to achieve high accuracy and precision. He focuses on thrust estimation and control of marine propellers with particular attention to four quadrant operations. In the overall control system it is seen that propellers play a fundamental role since they are the main force producing devices and it is expected that the propellers produce the desire thrust regardless of the environmental state [6] .
The CPP can develop more thrust than its fixed pitch counterpart over most of the stopping manoeuvre, simply because its pitch can be adjusted to suit the highly off-design flow conditions that exist transiently. Thus stopping time and distance are expected to be shorter when a CPP is used. The CPP provides means of reversing thrust without reversing rotation. It thereby eliminates the need for a reverse train in reduction gears or for reverse running features with a direct-connected engine [7] . Zarbock in his investigation into “controllable pitch propeller for future warships and yachts” discussed extensively on the possibility and the boundaries of the hydrodynamic propeller design. The blade strength, analysis of blade fatigue and components of the controllable pitch system are components that must be taken into consideration [8] . Schultten in his thesis discussed on the investigation into the thermal loading and possible overloading of the Diesel Engine (DE) in a turn and the development of a constant Kt controller (meant for cavitation reduction) in his research he delve into answering questions like “what are the effects on a diesel engine if the maximum rudder angle is enlarged”, “what if the ship speed was controlled instead of the shaft speed” he went further into modeling the DE incorporating the sequential turbo charging system and the effects of the diesel engine variables ;temperature, torque and pressure on the performance of the DE [9] .
Barry (2005), extensively discuss about propeller matching, though emphasis was for boat and small ships. He progressively handles section by section discussion on the steps and processes involve in propeller matching to the hull and vessel. He discussed the propeller characteristics, engine characteristics as well as the hull form and the propeller design itself. Though there was no matching graph to buttress this point and further in clear terms how the matching point is determined [1] .
1.1. Propeller and Propulsion Plant Arrangement
Figure 1 shows the CODOG system, combine diesel and gas (CODAG), combined diesel and diesel (CODAD). “But important of note is the power required. The needed power to maintain constant ships speeds will vary with different optimum propeller design speed i.e. revolutions per minutes (rpm). Finding the most economic and reasonable matching point between engine and propeller on a constant ship speed curve in the layout area therefore becomes a matter of great importance” [10] .
For a proper propeller matching entails a reduced fuel consumption, low emission control, and reduced noise and vibration [12] . Stapersma & Woud in
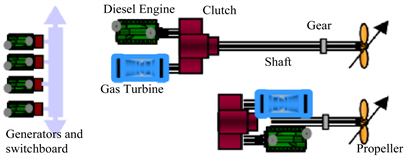
Figure 1. A typical CODOG system configuration with two propellers [11] .
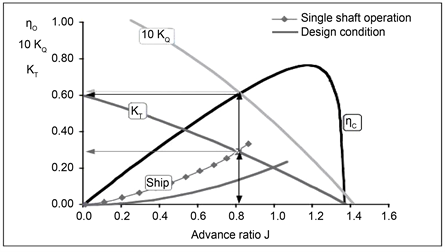
their work, deal decisively with the matching of fixed pitch propeller to an engine and hull, while in this research the matching is to a CPP and a program is developed in a java programmable language to help analyze the open water characteristics of the propeller and the matching graph. Stapersma & Woud discussed the CODAD system and considered an off design condition in which the change in number of driven shaft. This was demonstrated through the open water diagram as show in the Figure 2(a) & Figure 2(b) [13] .
1.2. Choice of Propeller
In propeller design the basic data are derived from advance hydrodynamic theories, practical experience and numerous model tests at various hydrodynamic institutes. Each blade is specially designed for a certain ship’s hull and its operating conditions; the total propeller efficiency, suppressed noise level and vibrations are prime design objectives [14] and [15] . Propeller theory is based on
 (a)
(a)
 (b)
(b)
Figure 2. The open water diagram [13] .
models, but in order to enable a general use of the theory a number of dimensionless propeller coefficients have been introduced in relation to propeller diameter d, the rate of revolution n, and the specific mass of the water of which the three most important coefficients are discussed below;
The advanced number; [16] (1)
The thrust coefficient; [16] (2)
The propeller torque as; [16] (3)
By means of special and complicated propeller diagrams, which amongst others, include, curves, it is possible to calculate the propeller size, the efficiency, the thrust pressure, and the shaft power. From the open water diagrams, off design conditions which affects the operating point of the propeller can be analyzed and resolved. This will be used as we progress further in solving some of the off design conditions that affects the operational envelope of the propeller and results will be discussed [16] .
Prior to manufacturing a propeller, the accuracy class standard must be established. Table 1 shows four different accuracy classes. Each class describes the maximum tolerance of the average pitch of the manufactured propeller, including the maximum tolerance of the corresponding propeller speed (the rate of revolution) the tolerance of the pitch should not be in excess of ±1.0%, the accuracy of manufacturing the propeller corresponds to the accuracy of the propeller speed (rate of revolution) tolerance and is ±1.0%.
1.3. Cavitation Criteria
Cavitation is a phenomenon observed in highly loaded propellers, manifesting itself beyond a certain number of revolutions of a propeller by noise, vibration and erosion of the propeller blades, strut and sometimes even rudders. An increasing loss of thrust will cause cavitation which must be avoided in the design of propeller [17] .
Cavitation number σ, can be calculated using the formula below.
[17] (4)
The critical thrust coefficient is define by the formula below

Table 1. Manufacturing accuracy of propellers [16] .
(5)
where = the projected area, = the speed of advance, n = propeller rpm, D = propeller diameter.
2. Materials and Methods
2.1. Research Methods
In matching a propeller to the ship hull and engine, the total resistance of the vessel must be known, propeller selection with torque and thrust to overcome the resistance and selecting an engine that match the propeller. In doing this the propeller characteristics and engine characteristics must be harmonized for effective fuel consumption and reduced vibration thereby achieving optimal matching. When an engine is to be matched with a propeller the following criteria should be met; [18] [19] .
The engine is able to develop full power or nearly full power at the design condition. Table 2 shows the engine data from the Diesel and gas turbine engines of the CODOG system.
Table 2. Case study vessel design data [23] .
2.1.1. Ship Resistance Estimation
To propel a ship, it is very necessary to overcome the resistance of the ship, the resistance is highly influenced by it speed, displacement and hull form. It is imperative to outline the various steps in calculating the ship resistance.
According to ITTC calculation procedures in finding the resistance of a ship using a model test, firstly a scale is chosen [20]
(6)
where = the length of the ship, = the length of model and λ = the scale factor.
Scaling according to Froude number is practical. We scale model speed according to so that the wave resistance is modelled correctly and we choose a model size that, in conjunction with the model speed, should give Reynolds number that are high enough to ensure a turbulent flow regime.
Thus
(7)
(8)
where = ship’s Froude number, = model’s Froude number, = models speed, = ship speed, = length of ship, = length of model, = acceleration due to gravity.
In this research due to the availability of a working model and a towing tank, and because the case study, is refitting a propeller to the ship. Back calculation procedures are best matching technique. Back calculation entails us knowing the rpm and the propeller characteristics, then we can calculate the current resistance, including all of the adjustments already made, this is done by determining the characteristics of the propeller and gear ratio, then measure speed and rpm. With this data I have to use the program design to determine the thrust and torque. The existing thrust for case study vessel is, T = 667,233.24N.
2.1.2. Relationship between the Hull Interaction, Propeller and Main Engine
For an effective interaction between the hull, propeller and the main engine the following requirements must be satisfied. The torque necessary to rotate the propeller must be equal to the torque delivered by the engine unto the end of the tail shaft. The number of revelations of the propeller must be equal to the engine rpm (with allowance for gear for medium and high speed engine). The thrust of the propeller must be equal to the resistance of the ship at a given speed, taking into consideration the thrust deduction.
The propeller delivers a thrust power
(9)
where T = thrust, = speed of advance.
The thrust power may be bigger or smaller than the effective power, depending on the mutual interaction between the hull and the propeller. The ratio of the effective power to the thrust power is the hull efficiency, expressed thus;
(10)
where t = thrust deduction, w = wake fraction
(11)
(12)
(13)
(14)
(15)
(16)
The total resistance of the vessel will be calculated using Equation (12). Because in this very case the thrust of the propeller is available from the ships machinery data.
The efficiency depends on the value of the coefficients w and t. i.e. on the shape of the hull and the number of propellers.
For this vessel, the wake w and thrust deduction fraction for its twin screw is define thus;
(17)
(18)
But
(19)
(20)
In general is approximately 0.10 higher than the . Slightly higher with fast ships with low where stern is partially submerged.
Therefore (21)
From ships data the following are obtained. , , , , , , .
From Equation (19), .
Hence from Equation (17), .
And , .
2.1.3. Propeller Hydrodynamic Equations
The polynomials derived from the B-series report will be used to plot the open water characteristics for Reynolds number and for ranges of number of blades, blade area ratio and pitch-diameter ratio. The extent of applicability of the polynomial is also discussed [21] . The derived polynomial expressed the thrust and torque coefficients in terms of number of blades, the blade area ratio, pitch-diameter ratio, and advance coefficient. The Reynolds number effect and the effect of variation of blade thickness on the B-series propeller characteristics have also been evaluated.
The polynomial for and derived with multiple regression analysis are;
(fit to test data) [21] (22)
(fit to test data) [21] (23)
The Reynolds number correction of 2.0 × 10⁶ applies to the equations.
The coefficients and and terms are given in a table. The dimensionless parameter that characterize the open water characteristics are the and from Equation (1), it can be seen that the advance ratio J, the wake fraction w, and the propeller speed can be determined as a function of ship speed.
(24)
(25)
(26)
The open water efficiency can be expressed in these three terms:
Also with the torque coefficient and relative rotative efficiency the propeller load can be determined.
The open water efficiency can be expressed in this three terms: from the equation below
(27)
But Power and torque are related thus
(28)
From propeller law; [16] (29)
(30)
( derived from open water diagram) (31)
Similarly
( derived from open water diagram) (32)
KTShip or KTPrime is also derived thus. When n is not known
(33)
[22] (34)
3. Discussion of Results and Findings
3.1. Propeller Matching Program Interface
The propeller matching program interface is user friendly and easy to execute. On running the program a dial-up box pops up to enable you to input the hull information and vessel speed, the engine data and as well as the propeller data. With the above given data a matching pitch is obtained, with another dial-up box indicating a range of pitch ratios of four different range to enable you compare results since it’s a controllable pitch propeller. From the information provided the open water diagram is obtained which is used to analyze the open water efficiency curve, torque coefficient, thrust coefficient and advance ratio. The Blount-fox thrust criteria ( ) call the Kt prime in the program, this coefficient helps determine some propeller factors before you know rpm, then solve for rpm, as shown in Figure 3 this is indicated with the yellow line running from the origin and cutting across the and curve, the point of intersection is trace vertically across the lines and curve to determine the and

Figure 3. J-Kt-Kq-ηO diagram at PD = 0.856.
on the y-axis, then traced downward to obtain the corresponding value of J on the x-axis. This method helps us to find rpm if we know resistance, speed and diameter―the equation eliminate rpm, we calculate curves of efficiency etc. by and can then optimize them and pick the point where you get the right then calculate required rpm from J.
3.2. Propeller Open Water Characteristics Results from the Java Program
Table 3 shows the results of the gas turbine engine and diesel engine design conditions while Table 4 shows the result of the sea trial conditions of the gas turbine engine and the Diesel engines. The variation in coefficient is an indication that various conditions of the vessel affect the performance of the engine and propeller. From Table 3 and Table 4 it can be seen that as the resistance/Thrust increases with a corresponding decrease in speed the matching pitch of the propeller reduces from 1.092 to 0.99 for the gas turbine and from 0.856 to 0.764 for the diesel engine in the design condition and sea trial conditions respectively.
Table 3. Results for design condition [23] .
Table 4. Results for sea trial condition [23] .
1) J-Kt-Kq and Open Water Diagram for Rated Power and Speed.
It can be seen from the open water diagram that the torque coefficient, the thrust coefficient, advance ratio and open water efficiency can be read out. Figure 3 shows a matching pitch of 0.856 the following coefficients KT, KQ, and J can be read from the graph and the propeller open water efficiency as well. The Kt prime line which is indicated with the yellow line intercept the red line which is the thrust coefficient. When a vertical line is drawn across that point the corresponding advance coefficient will be read. Which from the Figure 3 is 0.53, with this the vessel speed can be calculated, if propeller rpm and diameter are known, Equation (22) will be used to obtain the speed. The Kt can be read from scale as 0.18 on the y-axis while the torque coefficient Kq can also be read as 0.29. The open water efficiency corresponding to the intercept will be 0.566.
Figure 4 and Figure 5 show that at different pitch the propeller open water efficiency varies, for instance at a pitch of 1.20 and 1.10 the efficiencies are 0.60 and 0.59 (Figure 4 and Figure 5) but at these efficiencies the vessel will not develop their rated power and rpm as it is seen from Figure 6. But rather an efficiency of 0.566 is consider because this is the efficiency that will give a chosen pitch for the rated rpm and power as indicated in Figure 3. So the optimized

Figure 4. J-Kt-Kq-ηO diagram at PD = 1.10.

Figure 5. J-Kt-Kq-ηO diagram at PD = 1.20.
matching point is the point where the pitch is 0.856 this is the point where the engine will develop its rated power and rpm and as such maximum fuel consumption will be achieved.
The run of hydrodynamic curves of a propeller depends on the geometric shape of the propeller, the biggest influence being exerted by pitch ratio and develop area ratio. The effects of the increase of the pitch ratio for propeller is identical, this is shown in Figures 3-5. With growing pitch ratio by constant advance ratio J the thrust and torque are growing too, but the efficiency of the propeller decreases. At the same time the maximum value of the efficiency increases with growing pitch ratio.

Figure 6. Power-propeller rpm curve for CODOG.
2) Significance of J-KT-KQ and ηO to the Propeller Design.
As it can be seen from Figures 3-5, the pitch of the propeller changes the corresponding values of J, KT, KQ and ηO changes as well, an indication of the effect of pitch ratio on the hydrodynamic curve of the propeller. It shows that the hydrodynamic curves depend on the geometric shape of the propeller. This coefficient in the open water diagram helps in analyzing the propeller torque, thrust and the open water efficiency. As it can be seen from the open water diagrams these coefficients helps in the analysis of the propeller performance. As earlier stated it helps in analyzing some off design conditions from the open water diagram e.g. change in number of driven shaft, change in resistance and change in pitch. In this research two of the off designs conditions that were considered here are the increase in resistance and change of pitch.
The delima that may arise in matching a propeller to the engine is the rated power, rpm and pitch, in most cases a tradeoff has to be made in term of propeller efficiency in other to achieve the rated power and rpm, therefore it is advicable to pitch the propeller to achieve the rated power and rpm and a tradeoff is made for the efficiency which in most cases will or may not be much, say 1.5% to 5% with a corresponding percentage increase in rpm. The controllable pitch propeller offers a solution to this dilema. The power of the engine is developed only at the point of intercept of the engine power of 100% power and propeller power for pd = 0.856 as shown in Figure 6. If then the engine is to develop rated power, the propeller curve must have to pass through that point. Otherwise, the rated rpm will be reached before the rated bmep (pitch too low) or rated bmep will be reach before rated rpm (pitch too high). But in some instances the rate power cannot be reach, this becomes a case of “hitting the corner” via the designer choice of propeller pitch.
The propeller curves of Figure 6 most likely represent propellers that differ only in pitch. Matching to the engine typically involves only choice of pitch, and such is the situation assumed here.
Figure 7 shows the matching point of the propeller and the engine. It can be said that if the propeller speed exceeds the design speed by way of any aberration (fouling or otherwise), then the torque demanded by the load (propeller) to maintain that rpm would exceed that available from the driver (engine). So at all times it becomes imperative to keep all conditions of the engine in good performance for maximum power delivery.
3.3. Off Design Conditions
It is noted that changes occur in propeller-hull conditions during service, and these are compensated for by allowing a margin in selecting the design point. Let’s recognize that there are always uncertainties (finite probabilities of error) in design and manufacturing processes. For instance the propeller will not have exactly the pitch ratio specified, or if it did, will it produce the exactly the efficiency and rpm that the design charts predict. Analogous statement can be made for the engine. As a result “hitting the corner” precisely can only happen fortuitously. Fortunately, the consequences of this handicap can be handled by modification to the design process. It has been said that the engine develops it rated power when it produces it rated bmep at the rated rpm, and that the propeller pitch ratio should be chosen so that this condition is attained.
Sea state, wind, hull roughness, propeller roughness, and draft all affects the speed-power relationship of the vessel. In most instances the changes are unfavorable e.g. bottom is rougher and weather is worse than under design conditions. In terms of the power-rpm plot, this means that the propeller characteristics will shift to the left of the curves. The consequences to the engine will result

Figure 7. Diesel engine matching point with power-propeller curve.
in power loss. Either the engine must slow down, thus losing its power capability, or if rpm is to be maintained, the engine must be over loaded. But an eventual 20% increase in resistance at design speed appears to be reasonable estimate of the hull roughening factor for an ocean going vessel, Figure 8 is a power rpm curve when the resistance of the vessel is increased by 20%, it can be seen from the graph that the power has increase to 2718 KW at a vessel speed of 17 knots though the propeller speed is still within the operating range of 151 rpm as to design condition of 149 rpm. From the analysis it will be observed that for the rated power of the vessel to be achieved the engine will be strained therefore overloading the engine which is not a good practice. But because we are using a CPP it offers a solution to this dilemma. As well know, CPP has infinite possible pitch/rpm combinations for a given thrust requirement. With a CPP, the matching process is essentially the same, except that the margin need not be allowed. The change in pitch that is readily accomplished in service permits the engine to turn at the same rpm under both design and deteriorated conditions, and it is this constancy of rpm that is the benefit of margin with fixed pitch. The CPP therefore eliminates the need for the margin, and allow the vessel to develop full power under both trial and service conditions.
If the engine is unable to provide enough torque to turn the propeller, the shaft slows down, and the thrust and speed will drop to equilibrium. However this condition may not allow the engine to achieve full rpm for a fixed pitch propeller, so the engine may smoke and lug and eventually suffer damage. This is especially a problem with turbo charged engines because they depend on air flow to cool the heads, and in the long run can be damage by lugging. Which is why we need to know the engine characteristics properly and the need for

Figure 8. J-Kt-Kq-ηO diagram for 20% increase in resistance.
sequential turbo charging is essential in such transient condition. The amount of either power or torque available varies with rpm. The data for a specific engine is generally available from the manufacturer. The solution is to select the engine and choose the propeller pitch so that design speed is attained on trial trip with a bmep less than rated. Then when deteriorations occur in service, bmep can be increased up to the rating without overload. On sea trial trip, the engine will not reach its full power, and the vessel its maximum possible speed, because it will reach maximum rpm before reaching rated bmep. A partial remedy for this handicap is to allow a margin in rpm also. As it can be seen from figure 4.10, the advance ratio has shift from 0.53 in design condition to 0.35 in the sea trial condition consequently the propeller efficiency has also dropped from 0.566 to 0.52 with a corresponding pitch of 0.764. however because we are using a CPP and from the program design the range of pitch fall within 0.5 to 1.4 then the pitch range will be accommodated. This will have been a problem for fixed pitch propeller because the vessel will have been operating outside the operational envelope but CCP has eliminated this margin. So rather than operating the vessel out of the operational envelope which puts the engine on overload it can operate comfortably within that range because the CPP will adjust it pitch to suit the condition. For every change in resistance due to fouling, experiment shows that it is equivalent to a change of pitch.
3.4. Matching Point for Corresponding Gas Turbine Operation
From the Figure 8 it can be seen that if the gas turbine operation was to be run the matching point as indicated in the graph corresponds to 13,410 KW and 235 rpm. This is an indication that the program allow for both the diesel engine and gas turbine characteristics to be achieve. These values correspond to the existing diesel and gas turbine engines characteristics with the hull and propeller diameter. From Figure 9 of the open water diagram for gas turbine engine, the pitch which matches the propeller and develops the rated power and rpm is 1.092 in line with existing value. The torque and thrust coefficient as well as the advance coefficient obtained are all pointers to obtaining the real values when substituted into the various equations appropriately. With this the gas turbine is allow to run at its maximum speed, which is used intermittently while the diesel engine is use for the cruising speed.
4. Conclusions
The defect in CODAG leads to consideration of CODOG. If only one or the other engine is run, then each can be matched independently to the propeller so that each can develop its full capability. The only defect here is that the two engines cannot run together, since they would be over-speed, and maximum power is less than with CODAG. But with the CPP this offers a solution to the challenge.
The process of matching is basically one of working with the power-rpm or

Figure 9. Open water diagram for gas turbine with the matching pitch ratio.
torque-rpm characteristics of engine and of propeller. Since respective characteristics are always represented graphically, therefore the matching techniques will involve finding the intersection (i.e. Points where torque, power, rpm are equal) of these curves, then adjusting engine or propeller parameters to place these intersections at the desired location (John, 1976). Figure 6 shows the matching point for the diesel engine i.e. the point of intersects where the corresponding power and propeller rpm are achieved. With the use of CPP some aspects of the matching problem are eased, since pitch can be adjusted in service. With the adjusted pitch it gives a high degree of freedom which allows the operation of the propulsion plant at unfavorable points as can be seen in Figure 6 where ordinarily the propeller pitch has shifted from the design pitch of 0.856 to 0.764 in the sea trial design condition with increased resistance. At this pitch, though the engine power is 2700 KW which is still the rated power, the propeller rpm still remains at 149 rpm, but does not put too much load on the engine as in the case of a fixed pitch propeller. Rather the pitch has adjusted to achieve the desire result.
It therefore becomes very imperative for the designer to utilize this degree of freedom from CCP by linking the pitch control and the throttle control in a definite program. This is the case in the case study vessel and is what has been developed through the prop-matching.
Cite this paper
Ogar, O.B., Nitonye, S. and John-Hope, I. (2018) Design Analysis and Optimal Matching of a Controllable Pitch Propeller to the Hull and Diesel Engine of a CODOG System. Journal of Power and Energy Engineering, 6, 53-74. https://doi.org/10.4236/jpee.2018.63005
References
- 1. Barry, C. (2005) Propeller Selection for Boats and Small Ships. E-Marine Training.
- 2. Samson, N. (2017) Numerical Analysis for the Design of the Fuel System of a Sea Going Tug Boat in the Niger Delta. World Journal of Engineering Research and Technology, 3, 161-177. http://www.wjert.org
- 3. Grunditz, G. (2015) Optimizing Propeller and Propulsion, the Quest for Reduced Fuel Consumption, Emission and Noise Level. Marine Technology, Mandeville, 49-55.
- 4. Griffiths, D. (2010) Engine Selection and Installation, Safety, Additional Engine Systems, Monitoring and Control. In: Marine Low Speed Medium Engines, IMAREST, London, 86-127.
- 5. Marco, A., Michela, B., Marco, C. and Massimo, F. (2005) Computer Base Design Tool for a Fuel Efficient Low-Emission Marine Propulsion Plant. https://www.researchgate.net/publication/266576124_ComputerBased_Design_Tool_For_A_Fuel_Efficient_Low_Emissions_Marine_Propulsion_Plant
- 6. Pivano, L. (2008) Thrust Estimation and Control of Marine Propeller in Four Quadrant Operation. Master’s Thesis, Norwegian University of Science and Technology, Trondheim.
- 7. Schanz, F. (I967) The Controllable Pitch Propeller as an Integral Part of the Ships Propulsion System. Society of Naval Architecture and Marine Engineers, Michigan.
- 8. Zarbock, O. (2009) Controllable Pitch Propellers for Future Warships and Yachts. 1st International Symposium on Marine Propulsors, Trondheim, 22-24 June 2009, 1-6.
- 9. Schulten, P. and Johannes, M. (2005) Interaction between Diesel Engines Ship and Propeller during Manoeuvring. Delft University Press.
- 10. Cui, C. (1985) Selection of Main Engine and Its Match with Propeller from the Energy Saving Point of View. 10-25.
- 11. David, J.B. (2009) Power and Propulsion Option for Modern Warships. Rolls-Royce Naval Marine UK.
- 12. Cudina, P. (2015) Analysis of the Energy Efficiency Design Index (EEDI) with a Proposal for Improvement.
- 13. Stapersma, D. and Woud, H.K. (2005) Matching Propulsion Engine with Propulsor. Journal of Marine Engineering and Technology, 4, 25-32.
- 14. Bezzi, P. (2014) How to Match Engine and Propeller-France Helices. http://www.marinedieseleurope.com/blog/2014/11/
- 15. Bob-Manuel, K. (2017) Advance Ship Power Plants. Rivers State University Port Harcourt.
- 16. Kuiken, K. (2008) Ship Propulsion and Propellers. In: Diesel Engines II for Ship Propulsion and Power Plants, Target Global Energy Training, Onnen, 38-113, 368-395.
- 17. Nitonye, S., Adumene, S. and Howells, U.U. (2017) Numerical Design and Performance Analysis of a Tug Boat Propulsion System. Journal of Power and Energy Engineering, 5, 80-98. http://www.scirp.org/journal/jpee https://doi.org/10.4236/jpee.2017.511007
- 18. Samson, N. and Adumene, S. (2015) Comparative Modeling of Hull form Resistance for Three Ocean Going Vessels using Methodical Series. International Journal of Engineering and Technology, 4, 489-496. https://doi.org/10.14419/ijet.v4i4.4948
- 19. Nitonye, S. and Adumene, S. (2015) Predictive Analysis of Bare-Hull Resistance of a 25,000 DWT Tanker Vessel. International Journal of Engineering and Technology, 5, 194-198. http://iet-journals.org/archive/2015/april_vol_5_no_4/4613251421838595.pdf
- 20. Harris, I. (2003) Naval Architecture Lecture Notes. Chief Engineers Unlimited Part B, City of Glasgow College, Glasgow.
- 21. Oosterveld, M.W.C. and van Oossanen, P. (1975) Further Computer-Analyzed Data of the Wageningen B-Screw Series. Journal International Shipbuilding Progress, 22, 251-261. https://doi.org/10.3233/ISP-1975-2225102
- 22. William, E. and Leslie, J. (2012) Applied Heat for Engineers. Adlard Coles Nautical, London.
- 23. NNS Thunder (2016) NNS Thunder Vessel Parameters. Nigerian Navy, Federal Ocean Terminal, Onne.
Nomenclature
Symbol Definition
CODAD Combined Diesel and Diesel
CODAG Combine Diesel and Gas,
CODOG Combined Diesel or Gas
CPP Controllable Pitch Propeller
DP Dynamic Positioning
EM Engine Margin
EAR Expanded Area Ratio
ITTC International Towing Tank Conference
JIP Joint Industry Projects
MARIN Maritime and research institute of the Netherlands
MCR Maximum Continuous Rating
NNS Nigeria Navy Ship
PD Pitch Ratio
PTO’s power take offs
SSC Self-Synchronising Clutch
J Advance Ratio
Kt Thrust coefficient
Kq Torque Coefficient
Propeller Design Power
Effective Power
Measured of Surface Roughness.
Length on the waterline
T = Torque
J = Polar 2nd Moment of Area (M4)
= Shear Stress (N/M2)
R = Radius of Shaft.
G = Modulus of Elasticity (N/M2)
= Angle of Shaft Twist (radians)
L = Length of shaft twisting (M)
Roughness allowance coefficient
Resistance coefficient
Model frictional resistance coefficient
Frictional resistance coefficient for smooth hull
Total measured resistance coefficient
Total ship resistance coefficient
Residuary resistance coefficient
S Wetted Surface area of model
Wetted surface area of ship
= the length of the ship
= the length of model
Shaft Efficiency
Gear Box Efficiency
Transmission Efficiency
Model’s Froude number
Speed of Advance
The pitch diameter ratio
The blade area ratio
Z The number of blades
The Reynolds number of a characteristic radius (0.75R).
The ratio of the maximum propeller blade thickness to the length of the cord at a characteristics radius (0.75R).
t Thrust deduction
w Wake fraction
Models Speed
Ship’s speed
g Acceleration due to gravity
Scale Factor
Mass displacement
Open water efficiency
Propeller efficiency
Hull Efficiency
Relative Rotative Efficiency
Density